Races in Central Manchester, Connecticut (CT) Detailed Stats
Ancestries, Foreign-born residents, place of birth

Recent posts about races in Central Manchester, Connecticut on our local forum with over 2,400,000 registered users:
 | We're In The Wrong Area (65 replies) |
7.0% of Central Manchester, CT residents are foreign-born (2.2% born in Asia, 2.0% born in Europe, 1.9% born in Latin America, 0.8% born in North America), which is 114.6% less than the foreign-born rate of 15.0% across the entire state of Connecticut.
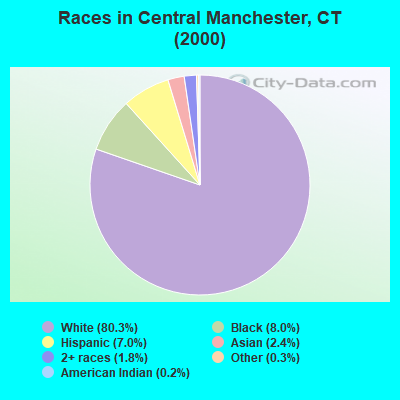
Race distribution in Central Manchester

- 24,57080.3%White alone
- 2,4458.0%Black alone
- 2,1307.0%Hispanic
- 7322.4%Asian alone
- 5631.8%Two or more races
- 870.3%Other race alone
- 550.2%American Indian alone
- 130.04%Native Hawaiian and Other
Pacific Islander alone
2000
2022
-
- 2,638,84577.5%White alone
- 320,3239.4%Hispanic
- 295,5718.7%Black alone
- 81,5642.4%Asian alone
- 52,8961.6%Two or more races
- 8,1410.2%Other race alone
- 7,2670.2%American Indian alone
- 9580.03%Native Hawaiian and Other
Pacific Islander alone

-
- 2,246,91362.0%White alone
- 658,97818.2%Hispanic
- 353,9739.8%Black alone
- 172,9294.8%Asian alone
- 159,6314.4%Two or more races
- 29,7610.8%Other race alone
- 3,4280.09%American Indian alone
- 5920.02%Native Hawaiian and Other
Pacific Islander alone

Income and house value in Central Manchester
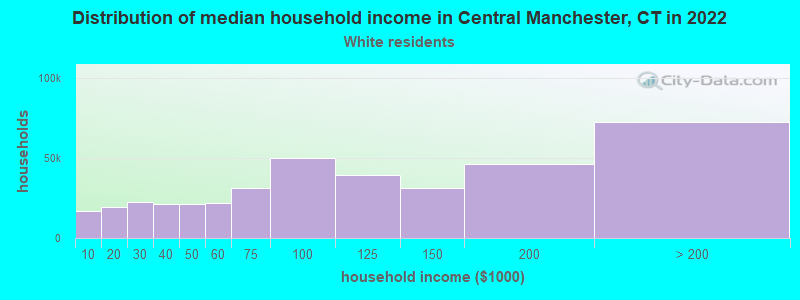
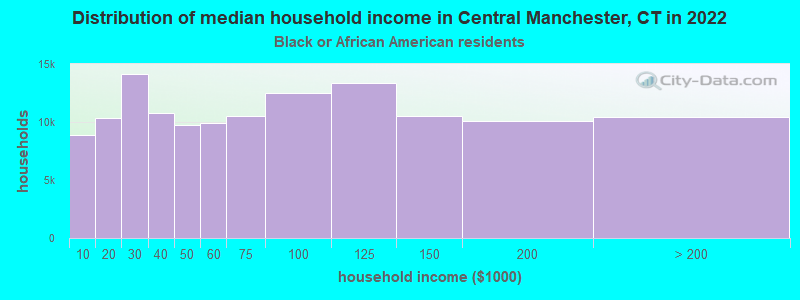
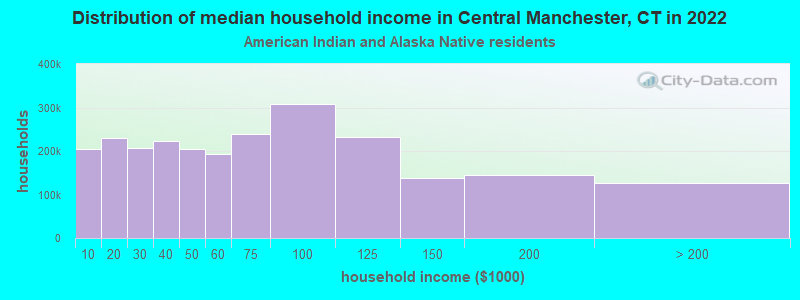
- Median household income in 2022
- $74,449White non-Hispanic householders
- $57,950Black householders
- $81,544American Indian and Alaska Native householders
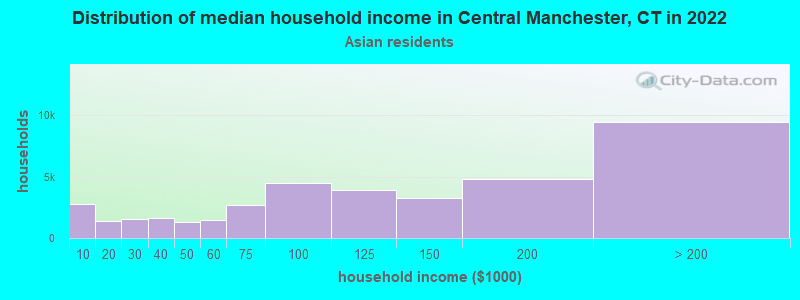
- $69,623Asian householders
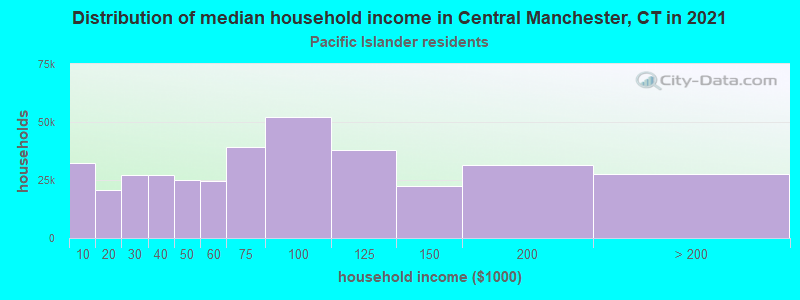
- $153,275Native Hawaiian and other Pacific Islander householders
- $62,077Some other race householders
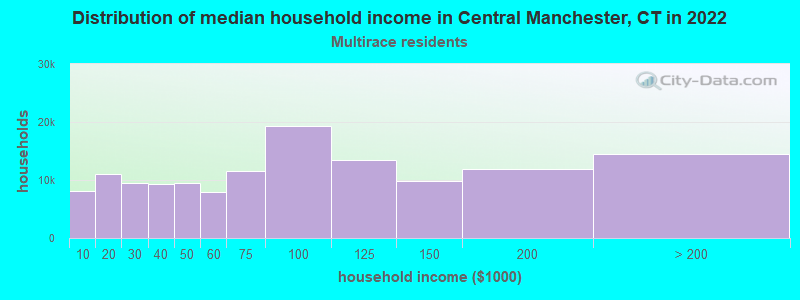
- $81,882Two or more races householders
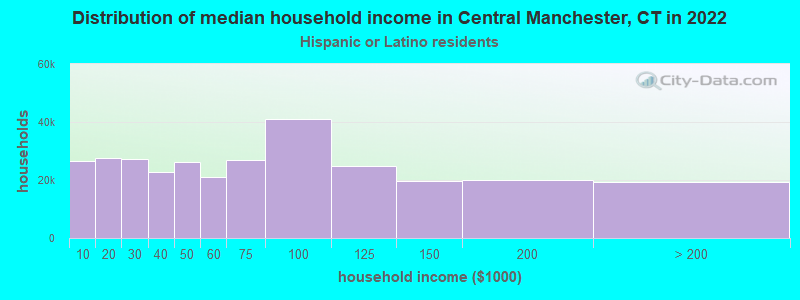
- $83,694Hispanic or Latino race householders
- Median 2022 house value
- $244,510White Non-Hispanic householders
- $229,376Black or African American householders
- $188,733American Indian or Alaska Native householders
- $310,015Asian householders
- $459,402Native Hawaiian and other Pacific Islander householders
- $244,293Some other race householders
- $300,286Two or more races householders
- $251,644Hispanic or Latino householders
Household income for White non-Hispanic householders
Household income for Black householders
Household income for American Indian and Alaska Native householders
Household income for Asian householders
Household income for Native Hawaiian and other Pacific Islander householders
Household income for Two or more races householders
Household income for Hispanic or Latino race householders
Foreign-born residents in Central Manchester
2,139 residents are foreign born (2.2% Asia, 2.0% Europe, 1.9% Latin America, 0.8% North America).
| This city: | 7.0% |
| Connecticut: | 10.9% |
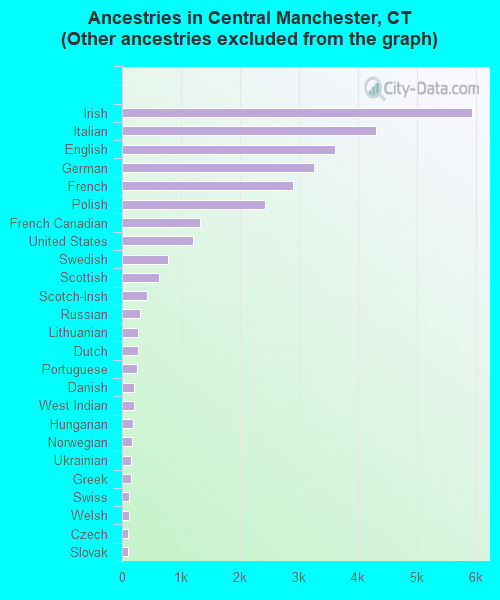
Ancestries in Central Manchester

- 6,50718.0%Other
- 5,93216.4%Irish
- 4,31912.0%Italian
- 3,61510.0%English
- 3,2669.0%German
- 2,9008.0%French
- 2,4296.7%Polish
- 1,3183.6%French Canadian
- 1,2093.3%United States
- 7882.2%Swedish
- 6331.8%Scottish
- 4191.2%Scotch-Irish
- 2990.8%Russian
- 2790.8%Lithuanian
- 2770.8%Dutch
- 2510.7%Portuguese
- 1980.5%Danish
- 1970.5%West Indian
- 1890.5%Hungarian
- 1660.5%Norwegian
- 1610.4%Ukrainian
- 1560.4%Greek
- 1250.3%Swiss
- 1170.3%Welsh
- 1040.3%Czech
- 1020.3%Slovak
- 940.3%Arab
- 770.2%Subsaharan African
Zip codes: 06040.