Races in Cerritos, California (CA) Detailed Stats
Data:
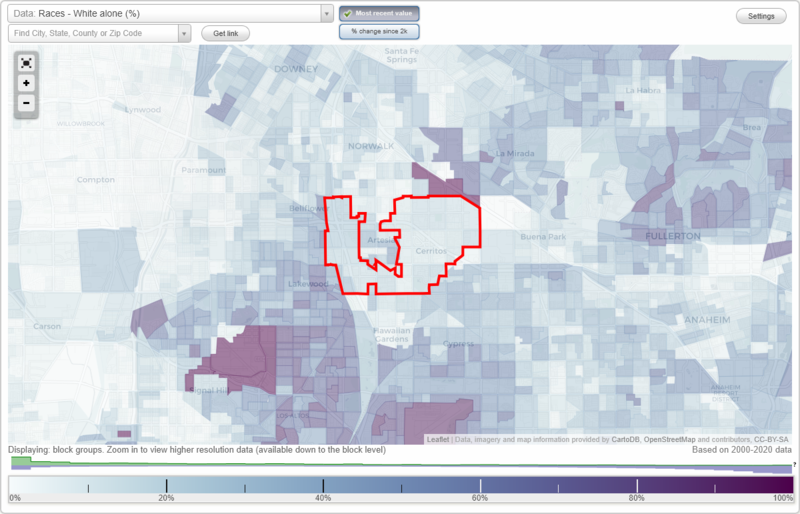
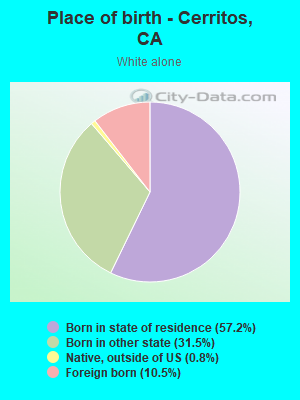
Races - White alone (%)
Races - White alone (% change since 2000)
Races - Black alone (%)
Races - Black alone (% change since 2000)
Races - American Indian alone (%)
Races - American Indian alone (% change since 2000)
Races - Asian alone (%)
Races - Asian alone (% change since 2000)
Races - Hispanic (%)
Races - Hispanic (% change since 2000)
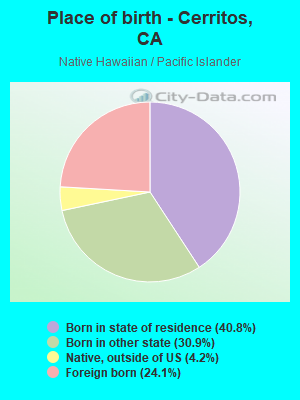
Races - Native Hawaiian and Other Pacific Islander alone (%)
Races - Native Hawaiian and Other Pacific Islander alone (% change since 2000)
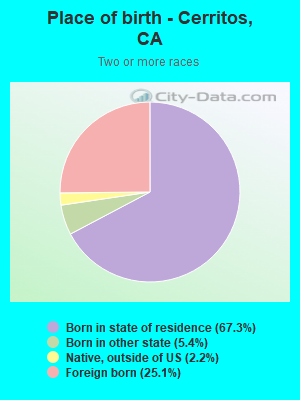
Races - Two or more races(%)
Races - Two or more races(% change since 2000)
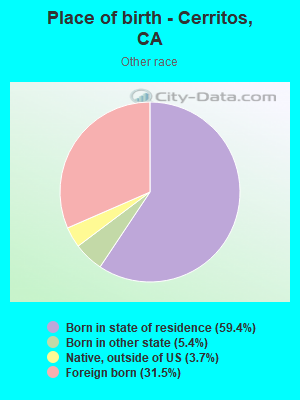
Races - Other race alone (%)
Races - Other race alone (% change since 2000)
Racial diversity
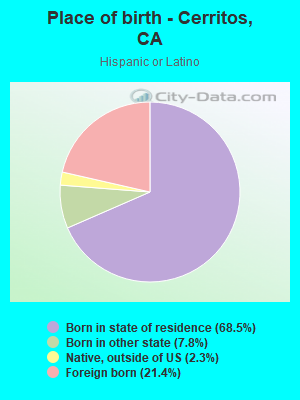
Place of birth - Born in state of residence (%)
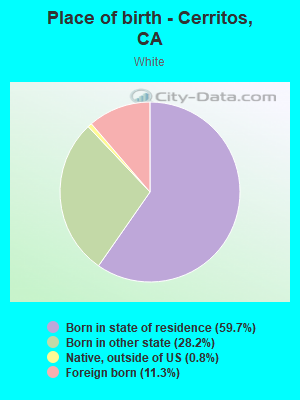
Place of birth - Born in state of residence (%) - White
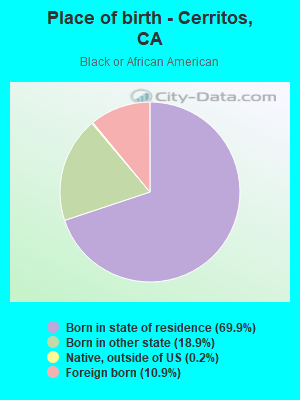
Place of birth - Born in state of residence (%) - Black or African American
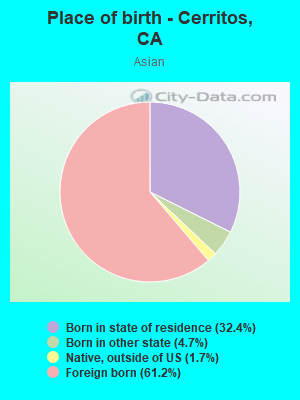
Place of birth - Born in state of residence (%) - Asian
Place of birth - Born in state of residence (%) - Hispanic or Latino
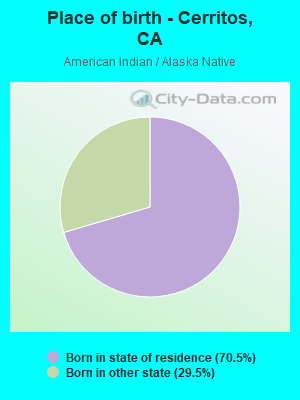
Place of birth - Born in state of residence (%) - American Indian and Alaska Native
Place of birth - Born in state of residence (%) - Multirace
Place of birth - Born in state of residence (%) - Other Race
Place of birth - Born in other state (%)
Place of birth - Born in other state (%) - White
Place of birth - Born in other state (%) - Black or African American
Place of birth - Born in other state (%) - Asian
Place of birth - Born in other state (%) - Hispanic or Latino
Place of birth - Born in other state (%) - American Indian and Alaska Native
Place of birth - Born in other state (%) - Multirace
Place of birth - Born in other state (%) - Other Race
Place of birth - Native, outside of US (%)
Place of birth - Native, outside of US (%) - White
Place of birth - Native, outside of US (%) - Black or African American
Place of birth - Native, outside of US (%) - Asian
Place of birth - Native, outside of US (%) - Hispanic or Latino
Place of birth - Native, outside of US (%) - American Indian and Alaska Native
Place of birth - Native, outside of US (%) - Multirace
Place of birth - Native, outside of US (%) - Other Race
Place of birth - Foreign born (%)
Place of birth - Foreign born (%) - White
Place of birth - Foreign born (%) - Black or African American
Place of birth - Foreign born (%) - Asian
Place of birth - Foreign born (%) - Hispanic or Latino
Place of birth - Foreign born (%) - American Indian and Alaska Native
Place of birth - Foreign born (%) - Multirace
Place of birth - Foreign born (%) - Other Race
Residents speaking English at home (%)
Residents speaking English at home - Born in the United States (%)
Residents speaking English at home - Native, born elsewhere (%)
Residents speaking English at home - Foreign born (%)
Residents speaking Spanish at home (%)
Residents speaking Spanish at home - Born in the United States (%)
Residents speaking Spanish at home - Native, born elsewhere (%)
Residents speaking Spanish at home - Foreign born (%)
Residents speaking other language at home (%)
Residents speaking other language at home - Born in the United States (%)
Residents speaking other language at home - Native, born elsewhere (%)
Residents speaking other language at home - Foreign born (%)
Marital status - Never married (%)
Marital status - Now married (%)
Marital status - Separated (%)
Marital status - Widowed (%)
Marital status - Divorced (%)
Ancestries Reported - Arab (%)
Ancestries Reported - Czech (%)
Ancestries Reported - Danish (%)
Ancestries Reported - Dutch (%)
Ancestries Reported - English (%)
Ancestries Reported - French (%)
Ancestries Reported - French Canadian (%)
Ancestries Reported - German (%)
Ancestries Reported - Greek (%)
Ancestries Reported - Hungarian (%)
Ancestries Reported - Irish (%)
Ancestries Reported - Italian (%)
Ancestries Reported - Lithuanian (%)
Ancestries Reported - Norwegian (%)
Ancestries Reported - Polish (%)
Ancestries Reported - Portuguese (%)
Ancestries Reported - Russian (%)
Ancestries Reported - Scotch-Irish (%)
Ancestries Reported - Scottish (%)
Ancestries Reported - Slovak (%)
Ancestries Reported - Subsaharan African (%)
Ancestries Reported - Swedish (%)
Ancestries Reported - Swiss (%)
Ancestries Reported - Ukrainian (%)
Ancestries Reported - United States (%)
Ancestries Reported - Welsh (%)
Ancestries Reported - West Indian (%)
Ancestries Reported - Other (%)
Geographical mobility - Same house 1 year ago (%)
Geographical mobility - Same house 1 year ago (%) - White
Geographical mobility - Same house 1 year ago (%) - Black or African American
Geographical mobility - Same house 1 year ago (%) - Asian
Geographical mobility - Same house 1 year ago (%) - Hispanic or Latino
Geographical mobility - Same house 1 year ago (%) - American Indian and Alaska Native
Geographical mobility - Same house 1 year ago (%) - Multirace
Geographical mobility - Same house 1 year ago (%) - Other Race
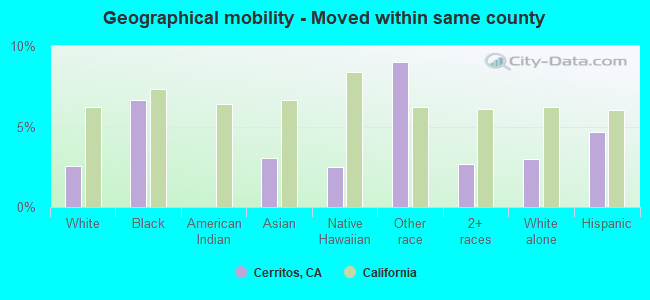
Geographical mobility - Moved within same county (%)
Geographical mobility - Moved within same county (%) - White
Geographical mobility - Moved within same county (%) - Black or African American
Geographical mobility - Moved within same county (%) - Asian
Geographical mobility - Moved within same county (%) - Hispanic or Latino
Geographical mobility - Moved within same county (%) - American Indian and Alaska Native
Geographical mobility - Moved within same county (%) - Multirace
Geographical mobility - Moved within same county (%) - Other Race
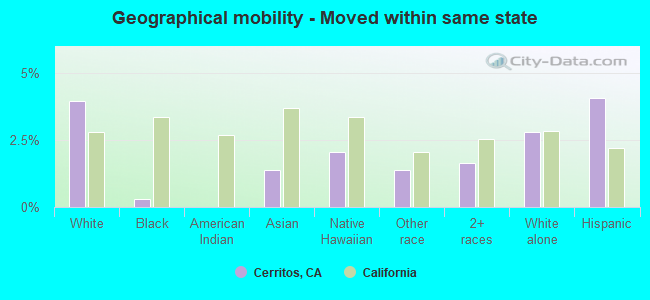
Geographical mobility - Moved from different county within same state (%)
Geographical mobility - Moved from different county within same state (%) - White
Geographical mobility - Moved from different county within same state (%) - Black or African American
Geographical mobility - Moved from different county within same state (%) - Asian
Geographical mobility - Moved from different county within same state (%) - Hispanic or Latino
Geographical mobility - Moved from different county within same state (%) - American Indian and Alaska Native
Geographical mobility - Moved from different county within same state (%) - Multirace
Geographical mobility - Moved from different county within same state (%) - Other Race
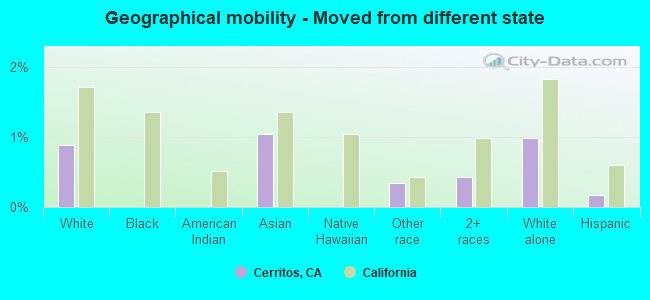
Geographical mobility - Moved from different state (%)
Geographical mobility - Moved from different state (%) - White
Geographical mobility - Moved from different state (%) - Black or African American
Geographical mobility - Moved from different state (%) - Asian
Geographical mobility - Moved from different state (%) - Hispanic or Latino
Geographical mobility - Moved from different state (%) - American Indian and Alaska Native
Geographical mobility - Moved from different state (%) - Multirace
Geographical mobility - Moved from different state (%) - Other Race
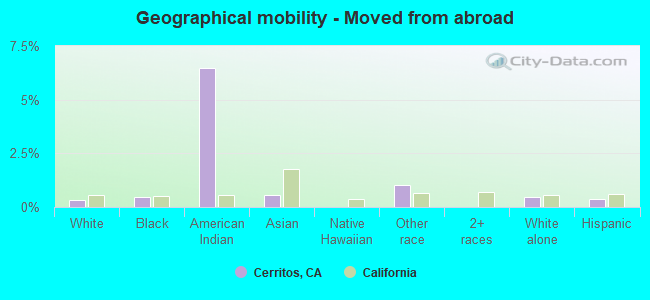
Geographical mobility - Moved from abroad (%)
Geographical mobility - Moved from abroad (%) - White
Geographical mobility - Moved from abroad (%) - Black or African American
Geographical mobility - Moved from abroad (%) - Asian
Geographical mobility - Moved from abroad (%) - Hispanic or Latino
Geographical mobility - Moved from abroad (%) - American Indian and Alaska Native
Geographical mobility - Moved from abroad (%) - Multirace
Geographical mobility - Moved from abroad (%) - Other Race
Place of birth for the foreign-born population - Ireland (%)
Place of birth for the foreign-born population - Denmark (%)
Place of birth for the foreign-born population - Norway (%)
Place of birth for the foreign-born population - Sweden (%)
Place of birth for the foreign-born population - United Kingdom (%)
Place of birth for the foreign-born population - England (%)
Place of birth for the foreign-born population - Scotland (%)
Place of birth for the foreign-born population - Other Northern Europe (%)
Place of birth for the foreign-born population - Austria (%)
Place of birth for the foreign-born population - Belgium (%)
Place of birth for the foreign-born population - France (%)
Place of birth for the foreign-born population - Germany (%)
Place of birth for the foreign-born population - Netherlands (%)
Place of birth for the foreign-born population - Switzerland (%)
Place of birth for the foreign-born population - Other Western Europe (%)
Place of birth for the foreign-born population - Greece (%)
Place of birth for the foreign-born population - Italy (%)
Place of birth for the foreign-born population - Portugal (%)
Place of birth for the foreign-born population - Spain (%)
Place of birth for the foreign-born population - Other Southern Europe (%)
Place of birth for the foreign-born population - Albania (%)
Place of birth for the foreign-born population - Belarus (%)
Place of birth for the foreign-born population - Bosnia and Herzegovina (%)
Place of birth for the foreign-born population - Bulgaria (%)
Place of birth for the foreign-born population - Croatia (%)
Place of birth for the foreign-born population - Czechoslovakia (%)
Place of birth for the foreign-born population - Hungary (%)
Place of birth for the foreign-born population - Latvia (%)
Place of birth for the foreign-born population - Lithuania (%)
Place of birth for the foreign-born population - North Macedonia (Macedonia) (%)
Place of birth for the foreign-born population - Moldova (%)
Place of birth for the foreign-born population - Poland (%)
Place of birth for the foreign-born population - Romania (%)
Place of birth for the foreign-born population - Russia (%)
Place of birth for the foreign-born population - Serbia (%)
Place of birth for the foreign-born population - Ukraine (%)
Place of birth for the foreign-born population - Other Eastern Europe (%)
Place of birth for the foreign-born population - China (%)
Place of birth for the foreign-born population - Hong Kong (%)
Place of birth for the foreign-born population - Taiwan (%)
Place of birth for the foreign-born population - Japan (%)
Place of birth for the foreign-born population - Korea (%)
Place of birth for the foreign-born population - Other Eastern Asia (%)
Place of birth for the foreign-born population - Afghanistan (%)
Place of birth for the foreign-born population - Bangladesh (%)
Place of birth for the foreign-born population - India (%)
Place of birth for the foreign-born population - Iran (%)
Place of birth for the foreign-born population - Kazakhstan (%)
Place of birth for the foreign-born population - Nepal (%)
Place of birth for the foreign-born population - Pakistan (%)
Place of birth for the foreign-born population - Sri Lanka (%)
Place of birth for the foreign-born population - Uzbekistan (%)
Place of birth for the foreign-born population - Other South Central Asia (%)
Place of birth for the foreign-born population - Burma (%)
Place of birth for the foreign-born population - Cambodia (%)
Place of birth for the foreign-born population - Indonesia (%)
Place of birth for the foreign-born population - Laos (%)
Place of birth for the foreign-born population - Malaysia (%)
Place of birth for the foreign-born population - Philippines (%)
Place of birth for the foreign-born population - Singapore (%)
Place of birth for the foreign-born population - Thailand (%)
Place of birth for the foreign-born population - Vietnam (%)
Place of birth for the foreign-born population - Other South Eastern Asia (%)
Place of birth for the foreign-born population - Armenia (%)
Place of birth for the foreign-born population - Iraq (%)
Place of birth for the foreign-born population - Israel (%)
Place of birth for the foreign-born population - Jordan (%)
Place of birth for the foreign-born population - Kuwait (%)
Place of birth for the foreign-born population - Lebanon (%)
Place of birth for the foreign-born population - Saudi Arabia (%)
Place of birth for the foreign-born population - Syria (%)
Place of birth for the foreign-born population - Turkey (%)
Place of birth for the foreign-born population - Yemen (%)
Place of birth for the foreign-born population - Other Western Asia (%)
Place of birth for the foreign-born population - Eritrea (%)
Place of birth for the foreign-born population - Ethiopia (%)
Place of birth for the foreign-born population - Kenya (%)
Place of birth for the foreign-born population - Somalia (%)
Place of birth for the foreign-born population - Uganda (%)
Place of birth for the foreign-born population - Zimbabwe (%)
Place of birth for the foreign-born population - Other Eastern Africa (%)
Place of birth for the foreign-born population - Cameroon (%)
Place of birth for the foreign-born population - Congo (%)
Place of birth for the foreign-born population - Democratic Republic of Congo (Zaire) (%)
Place of birth for the foreign-born population - Other Middle Africa (%)
Place of birth for the foreign-born population - Egypt (%)
Place of birth for the foreign-born population - Morocco (%)
Place of birth for the foreign-born population - Sudan (%)
Place of birth for the foreign-born population - Other Northern Africa (%)
Place of birth for the foreign-born population - South Africa (%)
Place of birth for the foreign-born population - Other Southern Africa (%)
Place of birth for the foreign-born population - Cabo Verde (%)
Place of birth for the foreign-born population - Ghana (%)
Place of birth for the foreign-born population - Liberia (%)
Place of birth for the foreign-born population - Nigeria (%)
Place of birth for the foreign-born population - Senegal (%)
Place of birth for the foreign-born population - Sierra Leone (%)
Place of birth for the foreign-born population - Other Western Africa (%)
Place of birth for the foreign-born population - Australia (%)
Place of birth for the foreign-born population - New Zealand (%)
Place of birth for the foreign-born population - Fiji (%)
Place of birth for the foreign-born population - Micronesia (%)
Place of birth for the foreign-born population - Bahamas (%)
Place of birth for the foreign-born population - Barbados (%)
Place of birth for the foreign-born population - Cuba (%)
Place of birth for the foreign-born population - Dominica (%)
Place of birth for the foreign-born population - Dominican Republic (%)
Place of birth for the foreign-born population - Grenada (%)
Place of birth for the foreign-born population - Haiti (%)
Place of birth for the foreign-born population - Jamaica (%)
Place of birth for the foreign-born population - St. Vincent and the Grenadines (%)
Place of birth for the foreign-born population - Trinidad and Tobago (%)
Place of birth for the foreign-born population - West Indies (%)
Place of birth for the foreign-born population - Other Caribbean (%)
Place of birth for the foreign-born population - Belize (%)
Place of birth for the foreign-born population - Costa Rica (%)
Place of birth for the foreign-born population - El Salvador (%)
Place of birth for the foreign-born population - Guatemala (%)
Place of birth for the foreign-born population - Honduras (%)
Place of birth for the foreign-born population - Mexico (%)
Place of birth for the foreign-born population - Nicaragua (%)
Place of birth for the foreign-born population - Panama (%)
Place of birth for the foreign-born population - Other Central America (%)
Place of birth for the foreign-born population - Argentina (%)
Place of birth for the foreign-born population - Bolivia (%)
Place of birth for the foreign-born population - Brazil (%)
Place of birth for the foreign-born population - Chile (%)
Place of birth for the foreign-born population - Colombia (%)
Place of birth for the foreign-born population - Ecuador (%)
Place of birth for the foreign-born population - Guyana (%)
Place of birth for the foreign-born population - Peru (%)
Place of birth for the foreign-born population - Uruguay (%)
Place of birth for the foreign-born population - Venezuela (%)
Place of birth for the foreign-born population - Other South America (%)
Place of birth for the foreign-born population - Canada (%)
Place of birth for the foreign-born population - Other Northern America (%)
Place of birth for the foreign-born population - Other (%)
Latest news about races in Cerritos, CA collected exclusively by city-data.com from local newspapers, TV, and radio stations
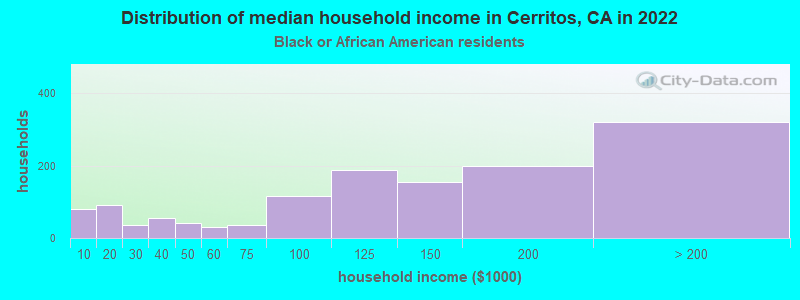
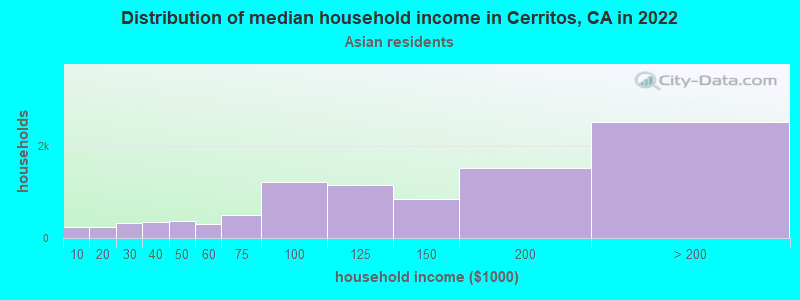
According to 2022 data, the most numerous races in Cerritos, CA are Hispanic (7,037 residents), White alone (6,550 residents), and Asian alone (30,874 residents). 43.7% of Cerritos residents speak English at home. 44.2% of Cerritos, CA residents are foreign-born (38.1% born in Asia), which is 41.2% greater than the foreign-born rate of 26.0% across the entire state of California.
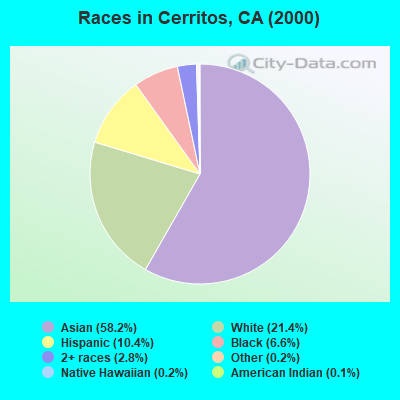
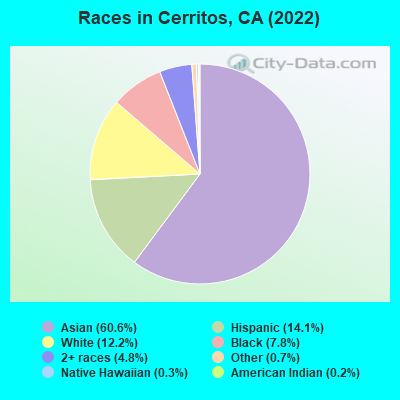
Race distribution in Cerritos
2000 2022
29,989 58.2% Asian alone 11,040 21.4% White alone 5,349 10.4% Hispanic 3,386 6.6% Black alone 1,459 2.8% Two or more races 101 0.2% Other race alone 89 0.2% Native Hawaiian and Other 75 0.1% American Indian alone
30,874 61.7% Asian alone 7,037 14.1% Hispanic 6,550 13.1% White alone 4,041 8.1% Black alone 2,558 5.1% Two or more races 284 0.6% Other race alone 219 0.4% Native Hawaiian and Other 120 0.2% American Indian alone
2000 2022
15,816,790 46.7% White alone 10,966,556 32.4% Hispanic 3,648,860 10.8% Asian alone 2,181,926 6.4% Black alone 903,115 2.7% Two or more races 178,984 0.5% American Indian alone 103,736 0.3% Native Hawaiian and Other 71,681 0.2% Other race alone
15,732,184 40.3% Hispanic 13,160,426 33.7% White alone 5,957,867 15.3% Asian alone 2,025,218 5.2% Black alone 1,663,222 4.3% Two or more races 251,618 0.6% Other race alone 135,777 0.3% Native Hawaiian and Other 103,030 0.3% American Indian alone
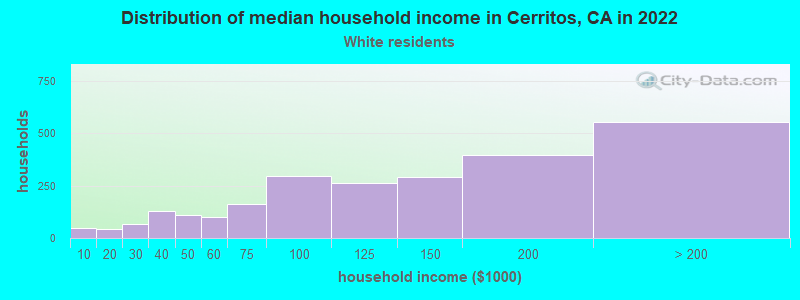
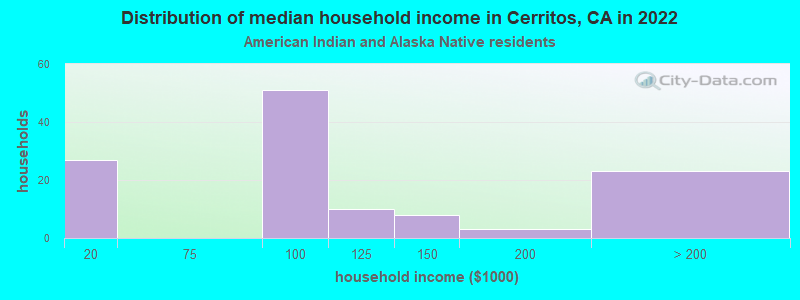
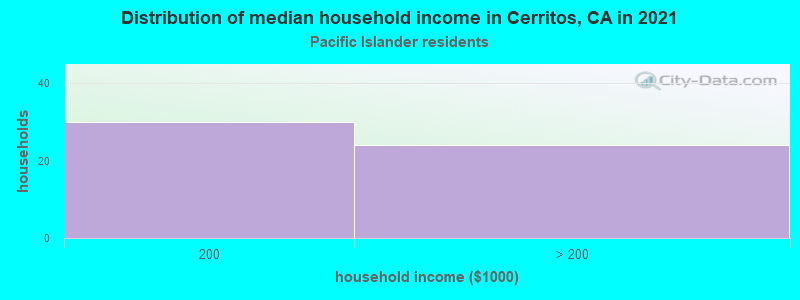
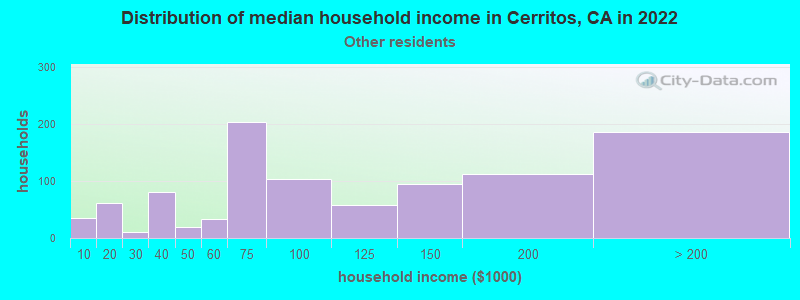
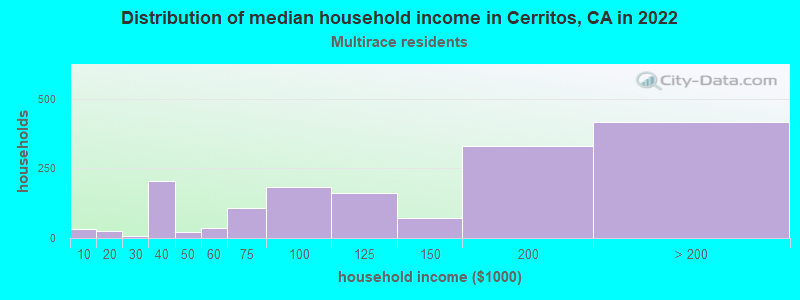
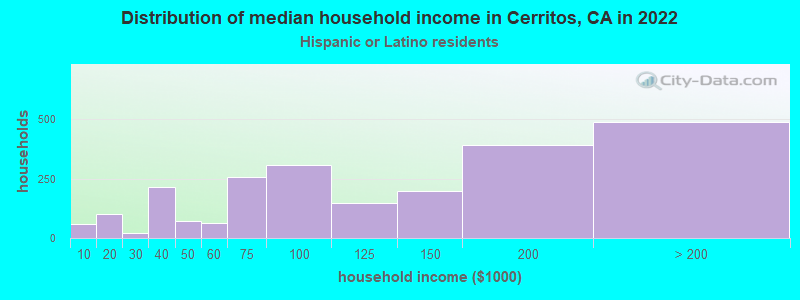
Income and house value in Cerritos Median household income in 2022 $105,361 White non-Hispanic householders$143,103 Black householders$68,105 American Indian and Alaska Native householders$148,641 Asian householdersover $200,000 Native Hawaiian and other Pacific Islander householders$102,600 Some other race householders$101,979 Two or more races householders$109,834 Hispanic or Latino race householdersMedian 2022 house value over $1,000,000 White Non-Hispanic householdersover $1,000,000 Black or African American householders$861,311 American Indian or Alaska Native householders over $1,000,000 Asian householders$494,903 Native Hawaiian and other Pacific Islander householders$984,767 Some other race householders$984,767 Two or more races householders$986,567 Hispanic or Latino householders
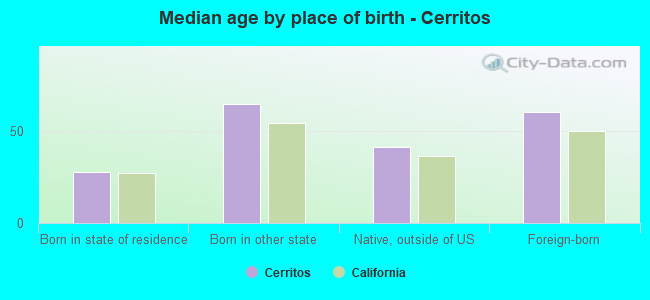
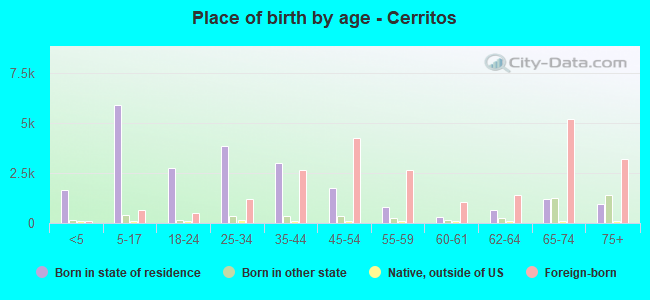
Median age by race in Cerritos
59.8 Median age for White residents58.1 62.4 37.7 Median age for Black or African American residents35.1 42.4 49.1 Median age for American Indian / Alaska Native residents56.8 48.3 48.3 Median age for Asian residents45.5 50.4 23.4 Median age for Native Hawaiian / Pacific Islander residents54.7 24.4 38.7 Median age for Other race residents34.6 40.7 26.5 Median age for Two or more races residents34.1 21.4 61.0 Median age for White alone residents59.6 63.1 38.3 Median age for Hispanic or Latino residents34.3 39.2
Owner/renter occupied households by race in Cerritos
House owners and renters - White residents 2,735 80.1% Owner occupied678 19.9% Renter occupiedHouse owners and renters - Black or African American residents 663 60.6% Owner occupied431 39.4% Renter occupiedHouse owners and renters - American Indian / Alaska Native residents 82 100.0% Owner occupiedHouse owners and renters - Asian residents 8,262 81.4% Owner occupied1,890 18.6% Renter occupiedHouse owners and renters - Native Hawaiian / Pacific Islander residents 61 100.0% Owner occupiedHouse owners and renters - Other race residents 510 59.4% Owner occupied349 40.6% Renter occupiedHouse owners and renters - Two or more races residents 1,238 74.0% Owner occupied436 26.0% Renter occupiedHouse owners and renters - White alone residents 2,254 79.8% Owner occupied571 20.2% Renter occupiedHouse owners and renters - Hispanic or Latino residents 1,318 71.1% Owner occupied536 28.9% Renter occupied
Language usage in Cerritos
English speakers - Total 43.7% of residents of Cerritos speak English at home.
8.0% of residents speak Spanish at home 3,124 81.2% Speak English very well723 18.8% Speak English less than very well49.0% of residents speak other language at home 13,916 58.7% Speak English very well9,799 41.3% Speak English less than very well
English speakers - Born in the United States 82.0% of residents of Cerritos speak English at home.
6.6% of residents speak Spanish at home 277 84.5% Speak English very well51 15.5% Speak English less than very well12.1% of residents speak other language at home 512 84.8% Speak English very well92 15.2% Speak English less than very well
English speakers - Native, born elsewhere 38.7% of residents of Cerritos speak English at home.
16.3% of residents speak Spanish at home 128 100.0% Speak English very well43.3% of residents speak other language at home 244 72.0% Speak English very well95 28.0% Speak English less than very well
English speakers - Foreign-born 8.2% of residents of Cerritos speak English at home.
6.7% of residents speak Spanish at home 985 68.0% Speak English very well463 32.0% Speak English less than very well87.2% of residents speak other language at home 9,834 52.2% Speak English very well8,998 47.8% Speak English less than very well
White (Caucasian) - Speak only English Native:
87.4% (6,333)Foreign-born:
16.1% (150)
White (Caucasian) - Speak another language Native:
12.7% (922)Foreign-born:
83.2% (774)
Black or African American - Speak only English Native:
95.8% (3,298)Foreign-born:
33.4% (154)
Black or African American - Speak another language Native:
3.9% (134)Foreign-born:
66.9% (307)
Asian - Speak only English Native:
60.5% (6,682)Foreign-born:
6.8% (1,281)
Asian - Speak another language Native:
39.7% (4,386)Foreign-born:
92.7% (17,490)
Native Hawaiian / Pacific Islander - Speak another language Native:
33.1% (55)Foreign-born:
97.0% (73)
Other race - Speak only English Native:
53.2% (1,144)Foreign-born:
7.8% (75)
Other race - Speak another language Native:
50.1% (1,079)Foreign-born:
92.8% (898)
Two or more races - Speak only English Native:
62.7% (3,635)Foreign-born:
13.2% (305)
Two or more races - Speak another language Native:
39.7% (2,299)Foreign-born:
83.2% (1,919)
White alone - Speak only English Native:
93.7% (5,410)Foreign-born:
18.4% (128)
White alone - Speak another language Native:
6.4% (367)Foreign-born:
82.1% (572)
Hispanic or Latino - Speak only English Native:
61.6% (3,424)Foreign-born:
5.6% (84)
Hispanic or Latino - Speak another language Native:
40.3% (2,237)Foreign-born:
94.3% (1,406)
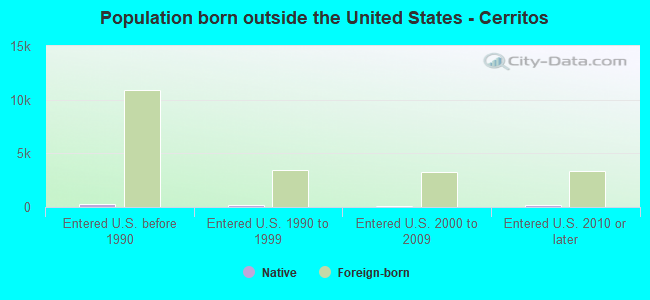
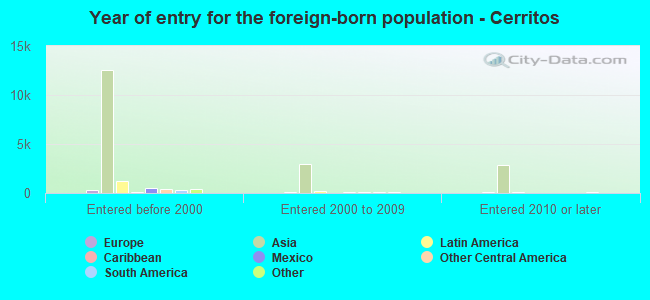
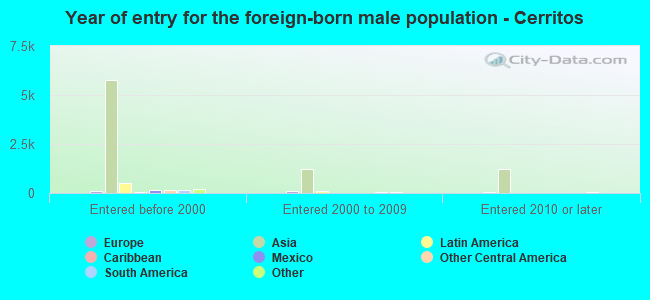
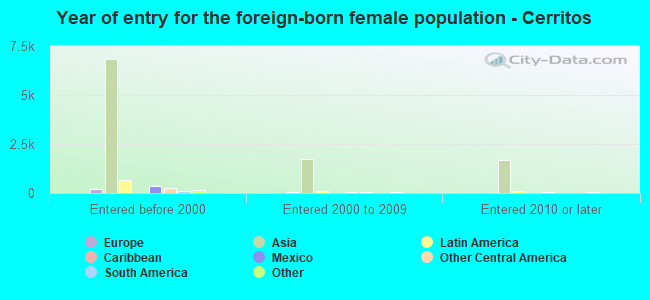
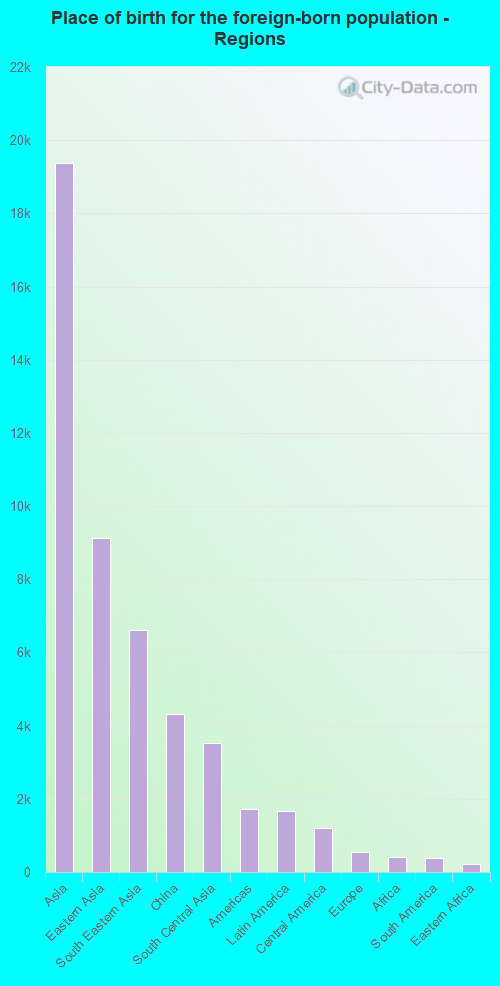
Foreign-born residents in Cerritos 22,122 residents are foreign born (38.1% Asia ).
This city:
44.2%California:
100.0%
Marital status for residents in Cerritos Marital status - White (Caucasian) population 15 years and over
Males 28.2% Never married58.7% Now married0.6% Separated4.4% Widowed8.0% DivorcedFemales 20.1% Never married54.8% Now married1.3% Separated14.4% Widowed9.4% DivorcedWomen who gave birth in the past 12 months Now married:
72.9% (55)Unmarried:
27.1% (20)
Women who did not give birth in the past 12 months Now married:
45.9% (521)Unmarried:
54.1% (614)
Marital status - Black or African American population 15 years and over
Males 46.4% Never married40.4% Now married3.0% Separated6.6% Widowed3.5% DivorcedFemales 38.0% Never married42.8% Now married0.6% Separated8.2% Widowed10.4% DivorcedWomen who gave birth in the past 12 months Now married:
63.6% (6)Unmarried:
36.4% (4)
Women who did not give birth in the past 12 months Now married:
28.1% (239)Unmarried:
71.9% (613)
Marital status - American Indian / Alaska Native population 15 years and over
Males 18.7% Never married56.0% Now married25.3% Separated0.0% Widowed0.0% DivorcedFemales 16.7% Never married29.5% Now married0.0% Separated21.8% Widowed32.1% DivorcedWomen who did not give birth in the past 12 months Now married:
15.6% (10)Unmarried:
84.4% (55)
Marital status - Asian population 15 years and over
Males 29.9% Never married65.4% Now married0.6% Separated1.9% Widowed2.2% DivorcedFemales 22.2% Never married63.2% Now married0.7% Separated8.2% Widowed5.8% DivorcedWomen who gave birth in the past 12 months Now married:
76.4% (225)Unmarried:
23.6% (70)
Women who did not give birth in the past 12 months Now married:
53.5% (3,183)Unmarried:
46.5% (2,768)
Marital status - Native Hawaiian / Pacific Islander population 15 years and over
Males 3.4% Never married96.6% Now married0.0% Separated0.0% Widowed0.0% DivorcedFemales 45.5% Never married41.6% Now married12.9% Separated0.0% Widowed0.0% DivorcedWomen who did not give birth in the past 12 months Now married:
51.1% (46)Unmarried:
48.9% (44)
Marital status - Other race population 15 years and over
Males 47.1% Never married50.2% Now married1.7% Separated0.0% Widowed1.0% DivorcedFemales 37.9% Never married49.0% Now married2.2% Separated3.0% Widowed7.9% DivorcedWomen who did not give birth in the past 12 months Now married:
43.1% (427)Unmarried:
56.9% (564)
Marital status - Two or more races population 15 years and over
Males 45.9% Never married42.0% Now married0.0% Separated5.0% Widowed7.1% DivorcedFemales 51.8% Never married38.2% Now married3.6% Separated1.3% Widowed5.1% DivorcedWomen who gave birth in the past 12 months Now married:
100.0% (62)Unmarried:
0.0% (0)
Women who did not give birth in the past 12 months Now married:
24.8% (438)Unmarried:
75.2% (1,327)
Marital status - White alone, not Hispanic / Latino population 15 years and over
Males 24.2% Never married60.3% Now married0.6% Separated5.3% Widowed9.5% DivorcedFemales 17.7% Never married56.4% Now married1.2% Separated14.1% Widowed10.7% DivorcedWomen who gave birth in the past 12 months Now married:
75.0% (46)Unmarried:
25.0% (15)
Women who did not give birth in the past 12 months Now married:
45.8% (346)Unmarried:
54.2% (408)
Marital status - Hispanic or Latino population 15 years and over
Males 45.5% Never married49.8% Now married1.1% Separated1.5% Widowed2.1% DivorcedFemales 33.4% Never married47.7% Now married2.9% Separated8.3% Widowed7.7% DivorcedWomen who gave birth in the past 12 months Now married:
72.7% (24)Unmarried:
27.3% (9)
Women who did not give birth in the past 12 months Now married:
40.7% (720)Unmarried:
59.3% (1,049)
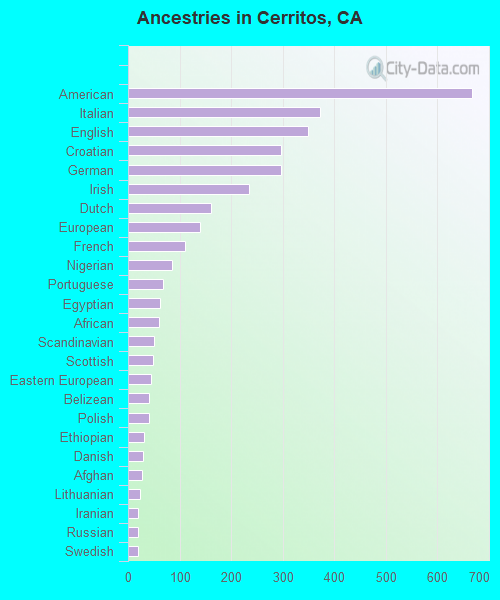
Ancestries in Cerritos
434 1.2% English429 1.2% Italian333 0.9% German324 0.9% American264 0.8% European196 0.6% Dutch172 0.5% Portuguese138 0.4% Irish136 0.4% Egyptian122 0.3% Nigerian75 0.2% Polish58 0.2% African57 0.2% British55 0.2% Norwegian54 0.2% Swedish52 0.1% Russian48 0.1% Lebanese48 0.1% Scandinavian45 0.1% Scottish38 0.1% Eastern European38 0.1% Iranian37 0.1% Northern European33 0.09% French29 0.08% Scotch-Irish28 0.08% Canadian27 0.08% Ethiopian24 0.07% Greek17 0.05% Czechoslovakian14 0.04% Armenian13 0.04% Jamaican12 0.03% Haitian11 0.03% Yugoslavian8 0.02% Romanian8 0.02% Swiss8 0.02% Serbian7 0.02% Welsh7 0.02% Lithuanian6 0.02% Belgian5 0.01% Australian4 0.01% Maltese2 0.01% Guyanese
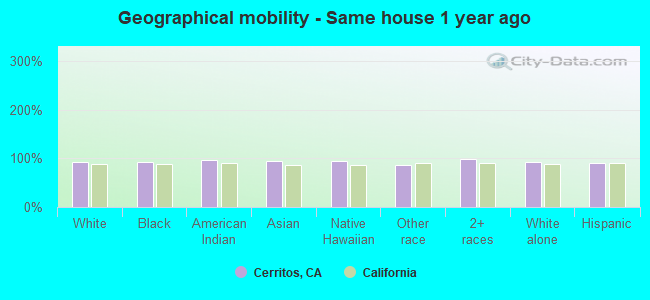
Geographical mobility in Cerritos Same house 1 year ago 7,516 92.8% White (Caucasian)3,827 92.7% Black or African American241 96.4% American Indian / Alaska Native29,269 95.0% Asian252 95.4% Native Hawaiian / Pacific Islander2,674 86.7% Other race8,017 98.8% Two or more races6,200 93.5% White alone, not Hispanic / Latino6,423 91.1% Hispanic or LatinoMoved within same county 205 2.5% White / Caucasian275 6.7% Black or African American941 3.1% Asian6 2.5% Native Hawaiian / Pacific Islander278 9.0% Other race217 2.7% Two or more races197 3.0% White alone, not Hispanic / Latino327 4.6% Hispanic or LatinoMoved within same state 319 3.9% White / Caucasian13 0.3% Black or African American430 1.4% Asian5 2.1% Native Hawaiian / Pacific Islander43 1.4% Other race134 1.7% Two or more races185 2.8% White alone, not Hispanic / Latino286 4.1% Hispanic or LatinoMoved from different state 72 0.9% White / Caucasian324 1.1% Asian11 0.3% Other race34 0.4% Two or more races65 1.0% White alone, not Hispanic / Latino12 0.2% Hispanic or LatinoMoved from abroad 25 0.3% White19 0.5% Black or African American16 6.5% American Indian / Alaska Native174 0.6% Asian32 1.0% Other race30 0.5% White alone, not Hispanic / Latino25 0.4% Hispanic or Latino
Children Nativity (place of birth) in Cerritos
Children under 6 years - Living with two parents Both parents native 793 100.0% Native0 0.0% Foreign-bornBoth parents foreign-born 529 96.7% Native18 3.3% Foreign-bornOne native, one foreign-born parent 381 100.0% NativeChildren under 6 years - Living with one parent Native parent 235 100.0% NativeForeign-born parent 68 100.0% NativeChildren 6 to 17 years - Living with two parents Both parents native 1,445 98.8% Native17 1.2% Foreign-bornBoth parents foreign-born 2,342 85.3% Native405 14.7% Foreign-bornOne native, one foreign-born parent 875 97.2% Native25 2.8% Foreign-bornChildren 6 to 17 years - Living with one parent Native parent 772 100.0% NativeForeign-born parent 459 60.5% Native300 39.5% Foreign-born
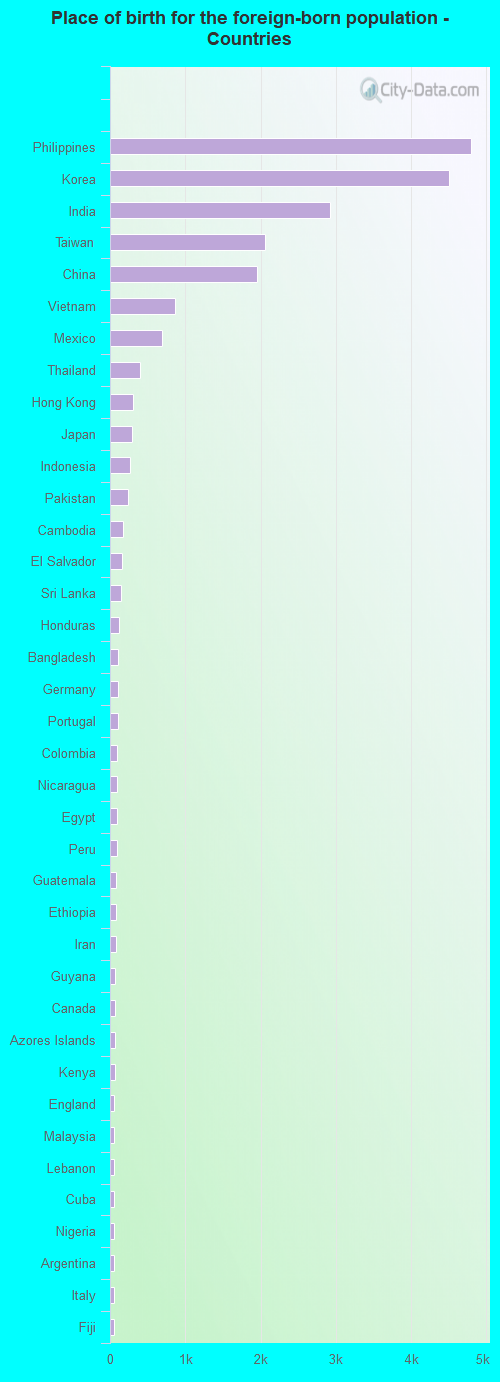
Place of birth for residents in Cerritos 19,380 Asia9,137 Eastern Asia6,625 South Eastern Asia4,328 China3,517 South Central Asia1,724 Americas1,654 Latin America1,205 Central America548 Europe411 Africa373 South America213 Eastern Africa176 Southern Europe164 Western Europe119 Eastern Europe105 Northern Africa89 Northern Europe86 Western Asia74 Caribbean70 Northern America56 Oceania52 Western Africa39 Middle Africa8 Australia and New Zealand Subregion4,796 Philippines4,499 Korea2,919 India2,065 Taiwan1,952 China860 Vietnam697 Mexico405 Thailand310 Hong Kong292 Japan265 Indonesia235 Pakistan179 Cambodia165 El Salvador143 Sri Lanka115 Honduras112 Bangladesh111 Germany102 Portugal92 Colombia89 Nicaragua89 Egypt87 Peru84 Guatemala81 Ethiopia81 Iran71 Guyana70 Canada65 Azores Islands62 Kenya58 England57 Malaysia55 Lebanon53 Cuba52 Nigeria50 Argentina49 Italy48 Fiji39 Cameroon38 Ukraine36 Russia34 Ecuador33 Laos30 Kuwait30 United Kingdom29 Belize28 Netherlands25 Nepal21 Burma21 Uganda19 Croatia17 Jamaica16 Switzerland16 Costa Rica15 Morocco15 Spain11 Eritrea10 Brazil9 Greece8 Belgium8 New Zealand8 Serbia8 Panama7 Poland5 Singapore4 Dominican Republic
Grandparents responsible for own grandchildren in Cerritos
Grandparents (30 to 59 years) White / Caucasian 13 37.2% Responsible for grandchildren22 62.8% Not responsible for grandchildrenBlack or African American 6 100.0% Responsible for grandchildrenAsian 8 8.7% Responsible for grandchildren82 91.3% Not responsible for grandchildrenTwo or more races 17 100.0% Not responsible for grandchildrenWhite alone, not Hispanic / Latino 11 35.1% Responsible for grandchildren21 64.9% Not responsible for grandchildrenHispanic or Latino 4 100.0% Responsible for grandchildrenGrandparents (60 years and over) White / Caucasian 30 14.3% Responsible for grandchildren178 85.7% Not responsible for grandchildrenBlack or African American 128 100.0% Not responsible for grandchildrenAsian 85 10.0% Responsible for grandchildren771 90.0% Not responsible for grandchildrenTwo or more races 129 100.0% Not responsible for grandchildrenWhite alone, not Hispanic / Latino 24 13.7% Responsible for grandchildren149 86.3% Not responsible for grandchildrenHispanic or Latino 14 9.6% Responsible for grandchildren131 90.4% Not responsible for grandchildren