Races in Chantilly, Virginia (VA) Detailed Stats
Data:
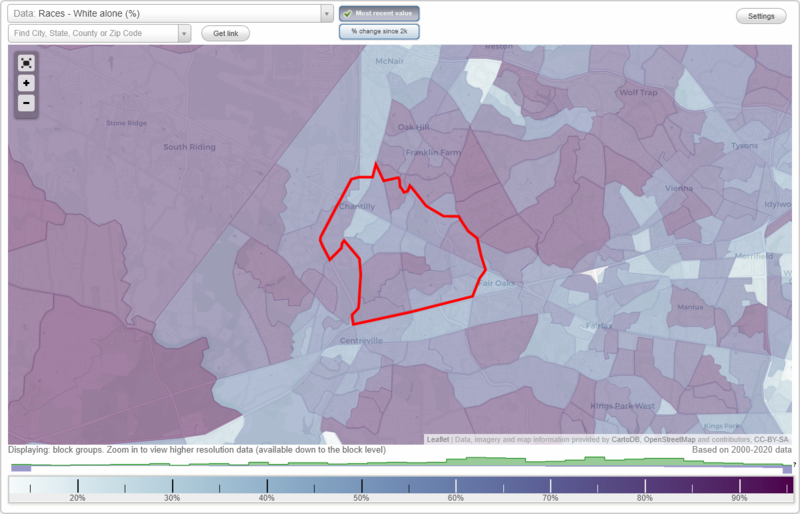
Races - White alone (%)
Races - White alone (% change since 2000)
Races - Black alone (%)
Races - Black alone (% change since 2000)
Races - American Indian alone (%)
Races - American Indian alone (% change since 2000)
Races - Asian alone (%)
Races - Asian alone (% change since 2000)
Races - Hispanic (%)
Races - Hispanic (% change since 2000)
Races - Native Hawaiian and Other Pacific Islander alone (%)
Races - Native Hawaiian and Other Pacific Islander alone (% change since 2000)
Races - Two or more races(%)
Races - Two or more races(% change since 2000)
Races - Other race alone (%)
Races - Other race alone (% change since 2000)
Racial diversity
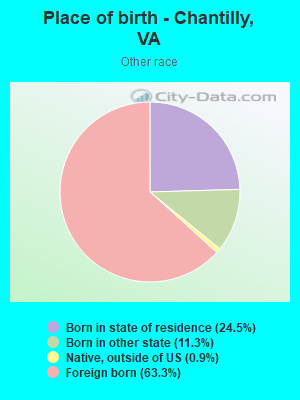
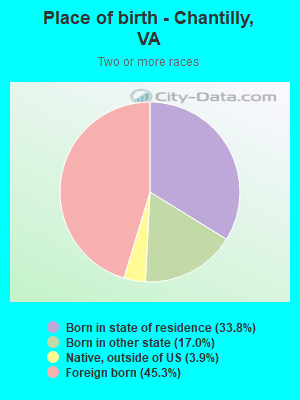
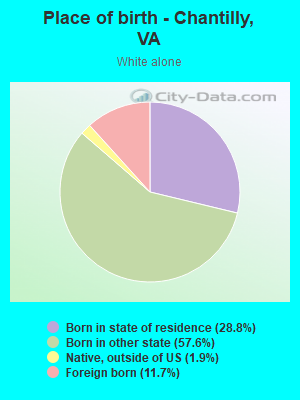
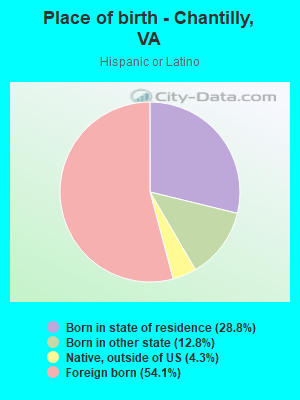
Place of birth - Born in state of residence (%)
Place of birth - Born in state of residence (%) - White
Place of birth - Born in state of residence (%) - Black or African American
Place of birth - Born in state of residence (%) - Asian
Place of birth - Born in state of residence (%) - Hispanic or Latino
Place of birth - Born in state of residence (%) - American Indian and Alaska Native
Place of birth - Born in state of residence (%) - Multirace
Place of birth - Born in state of residence (%) - Other Race
Place of birth - Born in other state (%)
Place of birth - Born in other state (%) - White
Place of birth - Born in other state (%) - Black or African American
Place of birth - Born in other state (%) - Asian
Place of birth - Born in other state (%) - Hispanic or Latino
Place of birth - Born in other state (%) - American Indian and Alaska Native
Place of birth - Born in other state (%) - Multirace
Place of birth - Born in other state (%) - Other Race
Place of birth - Native, outside of US (%)
Place of birth - Native, outside of US (%) - White
Place of birth - Native, outside of US (%) - Black or African American
Place of birth - Native, outside of US (%) - Asian
Place of birth - Native, outside of US (%) - Hispanic or Latino
Place of birth - Native, outside of US (%) - American Indian and Alaska Native
Place of birth - Native, outside of US (%) - Multirace
Place of birth - Native, outside of US (%) - Other Race
Place of birth - Foreign born (%)
Place of birth - Foreign born (%) - White
Place of birth - Foreign born (%) - Black or African American
Place of birth - Foreign born (%) - Asian
Place of birth - Foreign born (%) - Hispanic or Latino
Place of birth - Foreign born (%) - American Indian and Alaska Native
Place of birth - Foreign born (%) - Multirace
Place of birth - Foreign born (%) - Other Race
Residents speaking English at home (%)
Residents speaking English at home - Born in the United States (%)
Residents speaking English at home - Native, born elsewhere (%)
Residents speaking English at home - Foreign born (%)
Residents speaking Spanish at home (%)
Residents speaking Spanish at home - Born in the United States (%)
Residents speaking Spanish at home - Native, born elsewhere (%)
Residents speaking Spanish at home - Foreign born (%)
Residents speaking other language at home (%)
Residents speaking other language at home - Born in the United States (%)
Residents speaking other language at home - Native, born elsewhere (%)
Residents speaking other language at home - Foreign born (%)
Marital status - Never married (%)
Marital status - Now married (%)
Marital status - Separated (%)
Marital status - Widowed (%)
Marital status - Divorced (%)
Ancestries Reported - Arab (%)
Ancestries Reported - Czech (%)
Ancestries Reported - Danish (%)
Ancestries Reported - Dutch (%)
Ancestries Reported - English (%)
Ancestries Reported - French (%)
Ancestries Reported - French Canadian (%)
Ancestries Reported - German (%)
Ancestries Reported - Greek (%)
Ancestries Reported - Hungarian (%)
Ancestries Reported - Irish (%)
Ancestries Reported - Italian (%)
Ancestries Reported - Lithuanian (%)
Ancestries Reported - Norwegian (%)
Ancestries Reported - Polish (%)
Ancestries Reported - Portuguese (%)
Ancestries Reported - Russian (%)
Ancestries Reported - Scotch-Irish (%)
Ancestries Reported - Scottish (%)
Ancestries Reported - Slovak (%)
Ancestries Reported - Subsaharan African (%)
Ancestries Reported - Swedish (%)
Ancestries Reported - Swiss (%)
Ancestries Reported - Ukrainian (%)
Ancestries Reported - United States (%)
Ancestries Reported - Welsh (%)
Ancestries Reported - West Indian (%)
Ancestries Reported - Other (%)
Geographical mobility - Same house 1 year ago (%)
Geographical mobility - Same house 1 year ago (%) - White
Geographical mobility - Same house 1 year ago (%) - Black or African American
Geographical mobility - Same house 1 year ago (%) - Asian
Geographical mobility - Same house 1 year ago (%) - Hispanic or Latino
Geographical mobility - Same house 1 year ago (%) - American Indian and Alaska Native
Geographical mobility - Same house 1 year ago (%) - Multirace
Geographical mobility - Same house 1 year ago (%) - Other Race
Geographical mobility - Moved within same county (%)
Geographical mobility - Moved within same county (%) - White
Geographical mobility - Moved within same county (%) - Black or African American
Geographical mobility - Moved within same county (%) - Asian
Geographical mobility - Moved within same county (%) - Hispanic or Latino
Geographical mobility - Moved within same county (%) - American Indian and Alaska Native
Geographical mobility - Moved within same county (%) - Multirace
Geographical mobility - Moved within same county (%) - Other Race
Geographical mobility - Moved from different county within same state (%)
Geographical mobility - Moved from different county within same state (%) - White
Geographical mobility - Moved from different county within same state (%) - Black or African American
Geographical mobility - Moved from different county within same state (%) - Asian
Geographical mobility - Moved from different county within same state (%) - Hispanic or Latino
Geographical mobility - Moved from different county within same state (%) - American Indian and Alaska Native
Geographical mobility - Moved from different county within same state (%) - Multirace
Geographical mobility - Moved from different county within same state (%) - Other Race
Geographical mobility - Moved from different state (%)
Geographical mobility - Moved from different state (%) - White
Geographical mobility - Moved from different state (%) - Black or African American
Geographical mobility - Moved from different state (%) - Asian
Geographical mobility - Moved from different state (%) - Hispanic or Latino
Geographical mobility - Moved from different state (%) - American Indian and Alaska Native
Geographical mobility - Moved from different state (%) - Multirace
Geographical mobility - Moved from different state (%) - Other Race
Geographical mobility - Moved from abroad (%)
Geographical mobility - Moved from abroad (%) - White
Geographical mobility - Moved from abroad (%) - Black or African American
Geographical mobility - Moved from abroad (%) - Asian
Geographical mobility - Moved from abroad (%) - Hispanic or Latino
Geographical mobility - Moved from abroad (%) - American Indian and Alaska Native
Geographical mobility - Moved from abroad (%) - Multirace
Geographical mobility - Moved from abroad (%) - Other Race
Place of birth for the foreign-born population - Ireland (%)
Place of birth for the foreign-born population - Denmark (%)
Place of birth for the foreign-born population - Norway (%)
Place of birth for the foreign-born population - Sweden (%)
Place of birth for the foreign-born population - United Kingdom (%)
Place of birth for the foreign-born population - England (%)
Place of birth for the foreign-born population - Scotland (%)
Place of birth for the foreign-born population - Other Northern Europe (%)
Place of birth for the foreign-born population - Austria (%)
Place of birth for the foreign-born population - Belgium (%)
Place of birth for the foreign-born population - France (%)
Place of birth for the foreign-born population - Germany (%)
Place of birth for the foreign-born population - Netherlands (%)
Place of birth for the foreign-born population - Switzerland (%)
Place of birth for the foreign-born population - Other Western Europe (%)
Place of birth for the foreign-born population - Greece (%)
Place of birth for the foreign-born population - Italy (%)
Place of birth for the foreign-born population - Portugal (%)
Place of birth for the foreign-born population - Spain (%)
Place of birth for the foreign-born population - Other Southern Europe (%)
Place of birth for the foreign-born population - Albania (%)
Place of birth for the foreign-born population - Belarus (%)
Place of birth for the foreign-born population - Bosnia and Herzegovina (%)
Place of birth for the foreign-born population - Bulgaria (%)
Place of birth for the foreign-born population - Croatia (%)
Place of birth for the foreign-born population - Czechoslovakia (%)
Place of birth for the foreign-born population - Hungary (%)
Place of birth for the foreign-born population - Latvia (%)
Place of birth for the foreign-born population - Lithuania (%)
Place of birth for the foreign-born population - North Macedonia (Macedonia) (%)
Place of birth for the foreign-born population - Moldova (%)
Place of birth for the foreign-born population - Poland (%)
Place of birth for the foreign-born population - Romania (%)
Place of birth for the foreign-born population - Russia (%)
Place of birth for the foreign-born population - Serbia (%)
Place of birth for the foreign-born population - Ukraine (%)
Place of birth for the foreign-born population - Other Eastern Europe (%)
Place of birth for the foreign-born population - China (%)
Place of birth for the foreign-born population - Hong Kong (%)
Place of birth for the foreign-born population - Taiwan (%)
Place of birth for the foreign-born population - Japan (%)
Place of birth for the foreign-born population - Korea (%)
Place of birth for the foreign-born population - Other Eastern Asia (%)
Place of birth for the foreign-born population - Afghanistan (%)
Place of birth for the foreign-born population - Bangladesh (%)
Place of birth for the foreign-born population - India (%)
Place of birth for the foreign-born population - Iran (%)
Place of birth for the foreign-born population - Kazakhstan (%)
Place of birth for the foreign-born population - Nepal (%)
Place of birth for the foreign-born population - Pakistan (%)
Place of birth for the foreign-born population - Sri Lanka (%)
Place of birth for the foreign-born population - Uzbekistan (%)
Place of birth for the foreign-born population - Other South Central Asia (%)
Place of birth for the foreign-born population - Burma (%)
Place of birth for the foreign-born population - Cambodia (%)
Place of birth for the foreign-born population - Indonesia (%)
Place of birth for the foreign-born population - Laos (%)
Place of birth for the foreign-born population - Malaysia (%)
Place of birth for the foreign-born population - Philippines (%)
Place of birth for the foreign-born population - Singapore (%)
Place of birth for the foreign-born population - Thailand (%)
Place of birth for the foreign-born population - Vietnam (%)
Place of birth for the foreign-born population - Other South Eastern Asia (%)
Place of birth for the foreign-born population - Armenia (%)
Place of birth for the foreign-born population - Iraq (%)
Place of birth for the foreign-born population - Israel (%)
Place of birth for the foreign-born population - Jordan (%)
Place of birth for the foreign-born population - Kuwait (%)
Place of birth for the foreign-born population - Lebanon (%)
Place of birth for the foreign-born population - Saudi Arabia (%)
Place of birth for the foreign-born population - Syria (%)
Place of birth for the foreign-born population - Turkey (%)
Place of birth for the foreign-born population - Yemen (%)
Place of birth for the foreign-born population - Other Western Asia (%)
Place of birth for the foreign-born population - Eritrea (%)
Place of birth for the foreign-born population - Ethiopia (%)
Place of birth for the foreign-born population - Kenya (%)
Place of birth for the foreign-born population - Somalia (%)
Place of birth for the foreign-born population - Uganda (%)
Place of birth for the foreign-born population - Zimbabwe (%)
Place of birth for the foreign-born population - Other Eastern Africa (%)
Place of birth for the foreign-born population - Cameroon (%)
Place of birth for the foreign-born population - Congo (%)
Place of birth for the foreign-born population - Democratic Republic of Congo (Zaire) (%)
Place of birth for the foreign-born population - Other Middle Africa (%)
Place of birth for the foreign-born population - Egypt (%)
Place of birth for the foreign-born population - Morocco (%)
Place of birth for the foreign-born population - Sudan (%)
Place of birth for the foreign-born population - Other Northern Africa (%)
Place of birth for the foreign-born population - South Africa (%)
Place of birth for the foreign-born population - Other Southern Africa (%)
Place of birth for the foreign-born population - Cabo Verde (%)
Place of birth for the foreign-born population - Ghana (%)
Place of birth for the foreign-born population - Liberia (%)
Place of birth for the foreign-born population - Nigeria (%)
Place of birth for the foreign-born population - Senegal (%)
Place of birth for the foreign-born population - Sierra Leone (%)
Place of birth for the foreign-born population - Other Western Africa (%)
Place of birth for the foreign-born population - Australia (%)
Place of birth for the foreign-born population - New Zealand (%)
Place of birth for the foreign-born population - Fiji (%)
Place of birth for the foreign-born population - Micronesia (%)
Place of birth for the foreign-born population - Bahamas (%)
Place of birth for the foreign-born population - Barbados (%)
Place of birth for the foreign-born population - Cuba (%)
Place of birth for the foreign-born population - Dominica (%)
Place of birth for the foreign-born population - Dominican Republic (%)
Place of birth for the foreign-born population - Grenada (%)
Place of birth for the foreign-born population - Haiti (%)
Place of birth for the foreign-born population - Jamaica (%)
Place of birth for the foreign-born population - St. Vincent and the Grenadines (%)
Place of birth for the foreign-born population - Trinidad and Tobago (%)
Place of birth for the foreign-born population - West Indies (%)
Place of birth for the foreign-born population - Other Caribbean (%)
Place of birth for the foreign-born population - Belize (%)
Place of birth for the foreign-born population - Costa Rica (%)
Place of birth for the foreign-born population - El Salvador (%)
Place of birth for the foreign-born population - Guatemala (%)
Place of birth for the foreign-born population - Honduras (%)
Place of birth for the foreign-born population - Mexico (%)
Place of birth for the foreign-born population - Nicaragua (%)
Place of birth for the foreign-born population - Panama (%)
Place of birth for the foreign-born population - Other Central America (%)
Place of birth for the foreign-born population - Argentina (%)
Place of birth for the foreign-born population - Bolivia (%)
Place of birth for the foreign-born population - Brazil (%)
Place of birth for the foreign-born population - Chile (%)
Place of birth for the foreign-born population - Colombia (%)
Place of birth for the foreign-born population - Ecuador (%)
Place of birth for the foreign-born population - Guyana (%)
Place of birth for the foreign-born population - Peru (%)
Place of birth for the foreign-born population - Uruguay (%)
Place of birth for the foreign-born population - Venezuela (%)
Place of birth for the foreign-born population - Other South America (%)
Place of birth for the foreign-born population - Canada (%)
Place of birth for the foreign-born population - Other Northern America (%)
Place of birth for the foreign-born population - Other (%)
Latest news about races in Chantilly, VA collected exclusively by city-data.com from local newspapers, TV, and radio stations
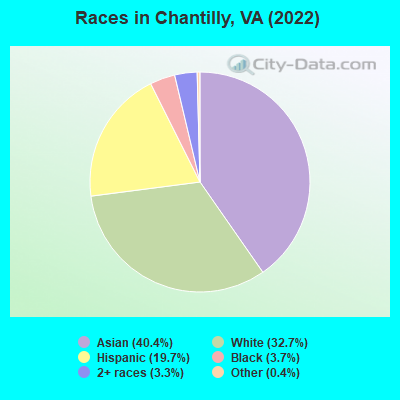
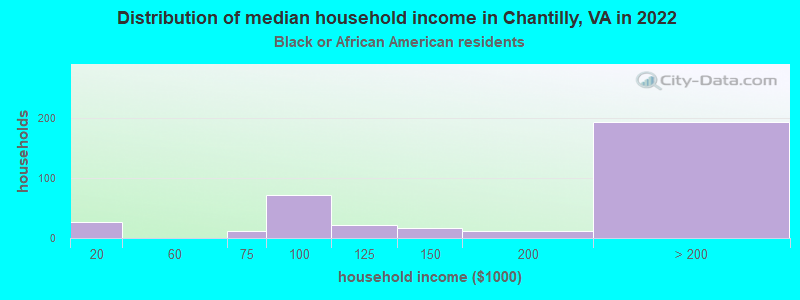
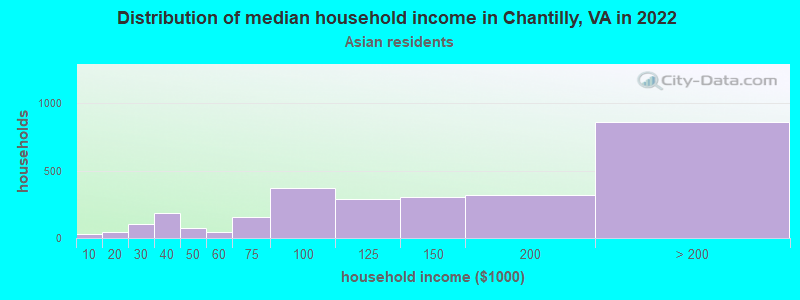
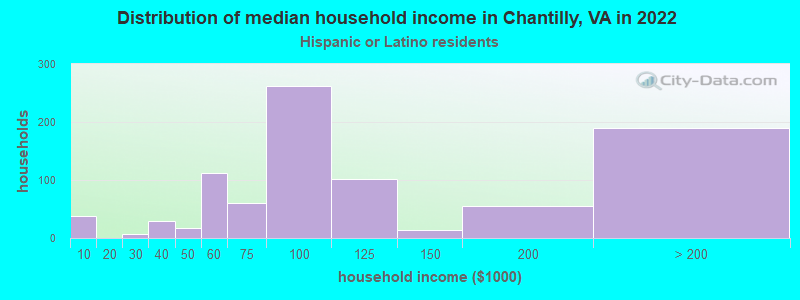
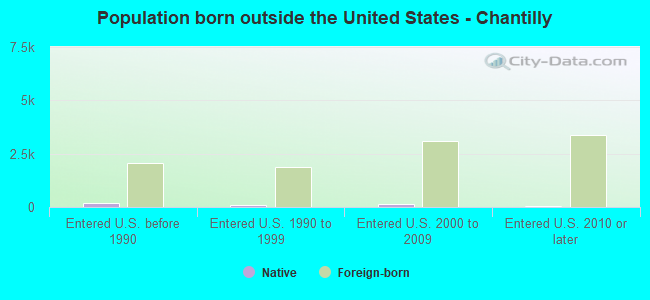
According to 2022 data, the most numerous races in Chantilly, VA are White alone (7,513 residents), Black alone (847 residents), and Hispanic (4,535 residents). 46.0% of Chantilly residents speak English at home. 45.2% of Chantilly, VA residents are foreign-born (31.6% born in Asia, 10.9% born in Latin America), which is 73.4% greater than the foreign-born rate of 12.0% across the entire state of Virginia.
Race distribution in Chantilly
2000 2022
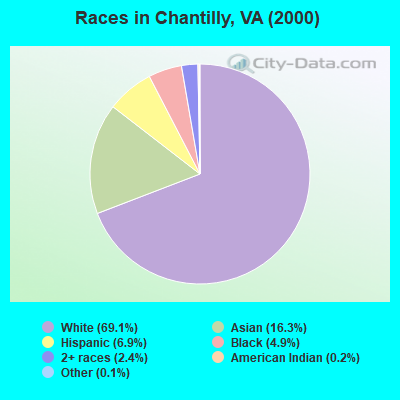
4,965,637 70.2% White alone 1,376,378 19.4% Black alone 329,540 4.7% Hispanic 259,277 3.7% Asian alone 114,022 1.6% Two or more races 18,596 0.3% American Indian alone 11,685 0.2% Other race alone 3,380 0.05% Native Hawaiian and Other
5,095,130 58.7% White alone 1,594,785 18.4% Black alone 905,750 10.4% Hispanic 602,881 6.9% Asian alone 406,047 4.7% Two or more races 60,419 0.7% Other race alone 11,738 0.1% American Indian alone 6,869 0.08% Native Hawaiian and Other
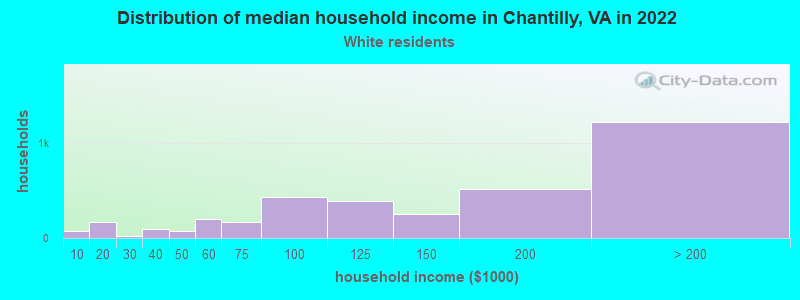
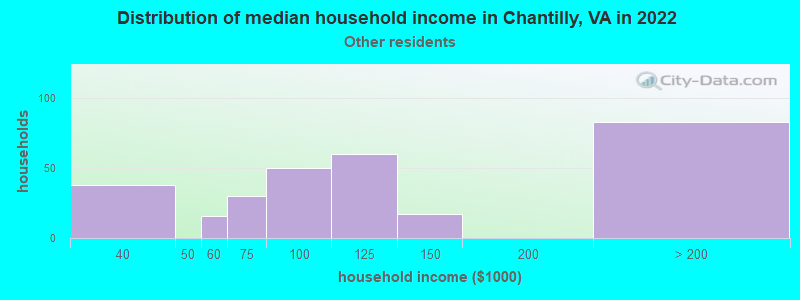
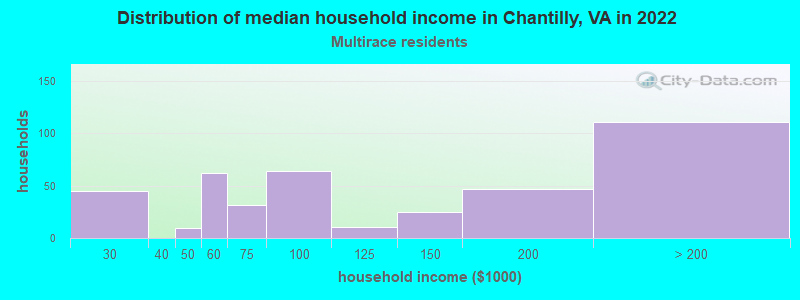
Income and house value in Chantilly Median household income in 2022 $151,972 White non-Hispanic householdersover $200,000 Black householders$136,252 Asian householders$107,878 Some other race householders$96,188 Two or more races householders$91,514 Hispanic or Latino race householdersMedian 2022 house value $681,584 White Non-Hispanic householders$640,369 Black or African American householders$273,741 American Indian or Alaska Native householders $604,076 Asian householders$493,656 Some other race householders$588,082 Two or more races householders$525,029 Hispanic or Latino householders
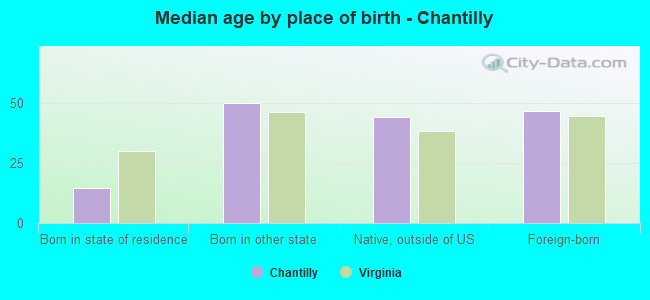
Median age by race in Chantilly
44.4 Median age for White residents43.0 45.8 38.6 Median age for Black or African American residents33.8 41.7 -754,182,753.4 Median age for American Indian / Alaska Native residents-964,539,006.1 -669,005,847.3 42.2 Median age for Asian residents41.7 42.3 -666,666,666.0 Median age for Native Hawaiian / Pacific Islander residents-558,791,801.0 -584,518,166.9 37.0 Median age for Other race residents41.6 19.3 21.9 Median age for Two or more races residents22.3 21.5 49.6 Median age for White alone residents47.1 50.7 25.1 Median age for Hispanic or Latino residents26.4 24.8
Owner/renter occupied households by race in Chantilly
House owners and renters - White residents 2,919 82.1% Owner occupied635 17.9% Renter occupiedHouse owners and renters - Black or African American residents 162 51.5% Owner occupied152 48.5% Renter occupiedHouse owners and renters - Asian residents 2,304 85.2% Owner occupied400 14.8% Renter occupiedHouse owners and renters - Other race residents 144 51.4% Owner occupied136 48.6% Renter occupiedHouse owners and renters - Two or more races residents 289 68.2% Owner occupied135 31.8% Renter occupiedHouse owners and renters - White alone residents 2,873 88.2% Owner occupied383 11.8% Renter occupiedHouse owners and renters - Hispanic or Latino residents 394 44.1% Owner occupied498 55.9% Renter occupied
Language usage in Chantilly
English speakers - Total 46.0% of residents of Chantilly speak English at home.
14.5% of residents speak Spanish at home 1,437 45.2% Speak English very well1,744 54.8% Speak English less than very well39.2% of residents speak other language at home 5,334 62.1% Speak English very well3,255 37.9% Speak English less than very well
English speakers - Born in the United States 87.3% of residents of Chantilly speak English at home.
4.7% of residents speak Spanish at home 202 69.9% Speak English very well87 30.1% Speak English less than very well7.9% of residents speak other language at home 447 92.7% Speak English very well35 7.3% Speak English less than very well
English speakers - Native, born elsewhere 59.4% of residents of Chantilly speak English at home.
28.4% of residents speak Spanish at home 81 59.1% Speak English very well56 40.9% Speak English less than very well11.2% of residents speak other language at home 54 100.0% Speak English very well
English speakers - Foreign-born 7.8% of residents of Chantilly speak English at home.
22.3% of residents speak Spanish at home 769 33.3% Speak English very well1,538 66.7% Speak English less than very well69.0% of residents speak other language at home 4,085 57.3% Speak English very well3,043 42.7% Speak English less than very well
White (Caucasian) - Speak only English Native:
93.1% (6,540)Foreign-born:
13.6% (183)
White (Caucasian) - Speak another language Native:
6.8% (474)Foreign-born:
82.0% (1,104)
Black or African American - Speak only English Native:
84.0% (538)Foreign-born:
5.7% (10)
Black or African American - Speak another language Native:
17.0% (109)Foreign-born:
90.0% (165)
Asian - Speak only English Native:
45.3% (1,006)Foreign-born:
7.2% (487)
Asian - Speak another language Native:
55.1% (1,224)Foreign-born:
92.0% (6,211)
Other race - Speak only English Native:
67.1% (273)Foreign-born:
3.3% (29)
Other race - Speak another language Native:
40.1% (163)Foreign-born:
95.6% (831)
Two or more races - Speak only English Native:
72.2% (984)Foreign-born:
8.1% (92)
Two or more races - Speak another language Native:
27.9% (379)Foreign-born:
91.9% (1,046)
White alone - Speak only English Native:
97.4% (6,265)Foreign-born:
22.7% (199)
White alone - Speak another language Native:
2.9% (189)Foreign-born:
76.5% (671)
Hispanic or Latino - Speak only English Native:
53.6% (925)Foreign-born:
2.8% (66)
Hispanic or Latino - Speak another language Native:
47.6% (820)Foreign-born:
97.2% (2,317)
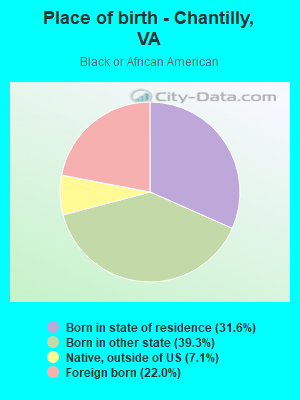
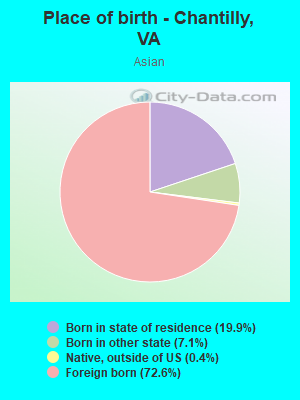
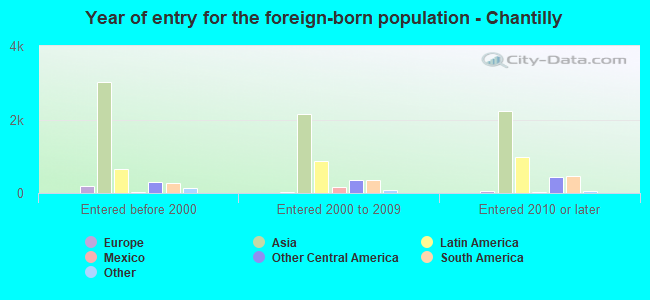
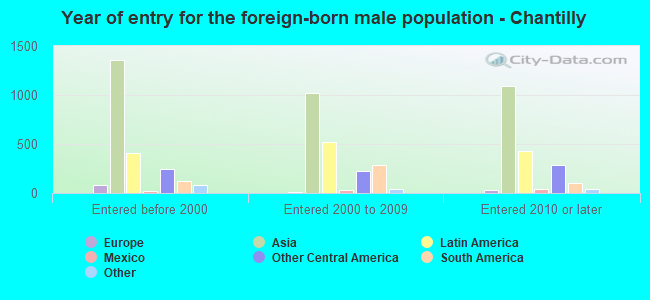
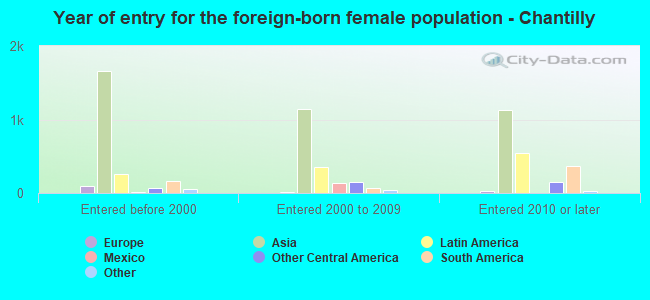
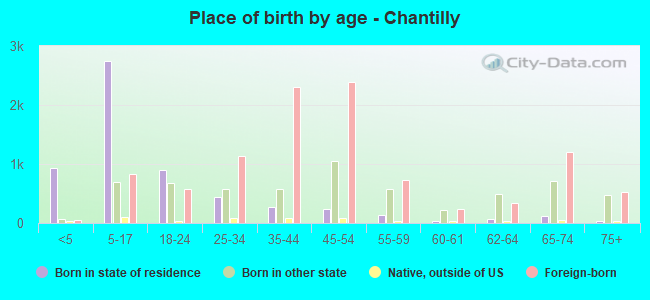
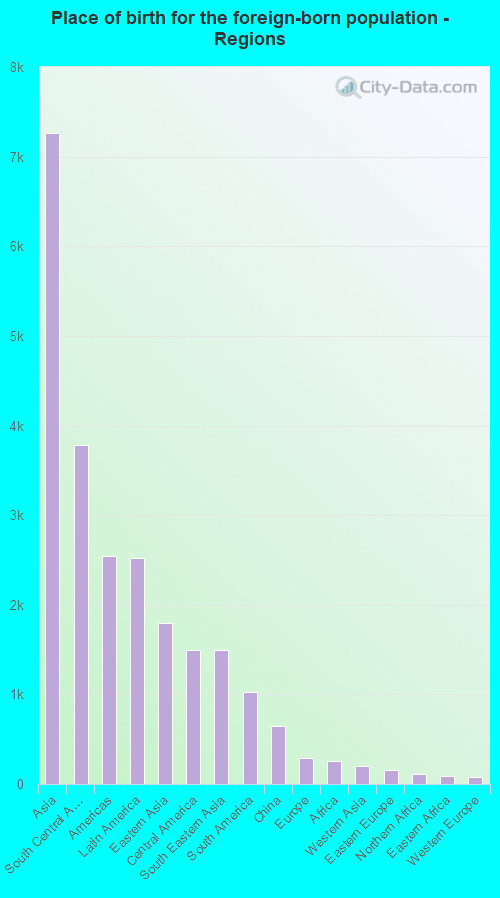
Foreign-born residents in Chantilly 10,374 residents are foreign born (31.6% Asia , 10.9% Latin America ).
This city:
45.2%Virginia:
12.6%
Marital status for residents in Chantilly Marital status - White (Caucasian) population 15 years and over
Males 31.8% Never married59.3% Now married0.8% Separated2.0% Widowed6.1% DivorcedFemales 26.7% Never married53.8% Now married2.0% Separated7.1% Widowed10.5% DivorcedWomen who gave birth in the past 12 months Now married:
100.0% (49)Unmarried:
0.0% (0)
Women who did not give birth in the past 12 months Now married:
50.3% (979)Unmarried:
49.7% (968)
Marital status - Black or African American population 15 years and over
Males 60.1% Never married39.6% Now married0.0% Separated0.0% Widowed0.3% DivorcedFemales 48.3% Never married46.9% Now married0.0% Separated0.0% Widowed4.8% DivorcedWomen who gave birth in the past 12 months Now married:
100.0% (9)Unmarried:
0.0% (0)
Women who did not give birth in the past 12 months Now married:
23.6% (44)Unmarried:
76.4% (144)
Marital status - Asian population 15 years and over
Males 26.3% Never married69.9% Now married0.4% Separated0.9% Widowed2.5% DivorcedFemales 21.1% Never married68.7% Now married1.9% Separated2.8% Widowed5.5% DivorcedWomen who gave birth in the past 12 months Now married:
100.0% (144)Unmarried:
0.0% (0)
Women who did not give birth in the past 12 months Now married:
63.1% (1,496)Unmarried:
36.9% (876)
Marital status - Other race population 15 years and over
Males 40.2% Never married59.8% Now married0.0% Separated0.0% Widowed0.0% DivorcedFemales 49.2% Never married44.8% Now married0.0% Separated4.7% Widowed1.3% DivorcedWomen who gave birth in the past 12 months Now married:
100.0% (27)Unmarried:
0.0% (0)
Women who did not give birth in the past 12 months Now married:
27.3% (112)Unmarried:
72.7% (297)
Marital status - Two or more races population 15 years and over
Males 59.4% Never married40.6% Now married0.0% Separated0.0% Widowed0.0% DivorcedFemales 51.3% Never married48.3% Now married0.0% Separated0.4% Widowed0.0% DivorcedWomen who gave birth in the past 12 months Now married:
48.1% (17)Unmarried:
51.9% (19)
Women who did not give birth in the past 12 months Now married:
39.6% (215)Unmarried:
60.4% (329)
Marital status - White alone, not Hispanic / Latino population 15 years and over
Males 29.7% Never married62.0% Now married0.9% Separated1.9% Widowed5.5% DivorcedFemales 24.7% Never married58.0% Now married0.1% Separated7.1% Widowed10.1% DivorcedWomen who gave birth in the past 12 months Now married:
100.0% (42)Unmarried:
0.0% (0)
Women who did not give birth in the past 12 months Now married:
52.4% (762)Unmarried:
47.6% (691)
Marital status - Hispanic or Latino population 15 years and over
Males 48.1% Never married47.3% Now married0.0% Separated0.9% Widowed3.7% DivorcedFemales 40.8% Never married42.4% Now married5.1% Separated5.0% Widowed6.7% DivorcedWomen who gave birth in the past 12 months Now married:
70.8% (34)Unmarried:
29.2% (14)
Women who did not give birth in the past 12 months Now married:
42.6% (541)Unmarried:
57.4% (730)
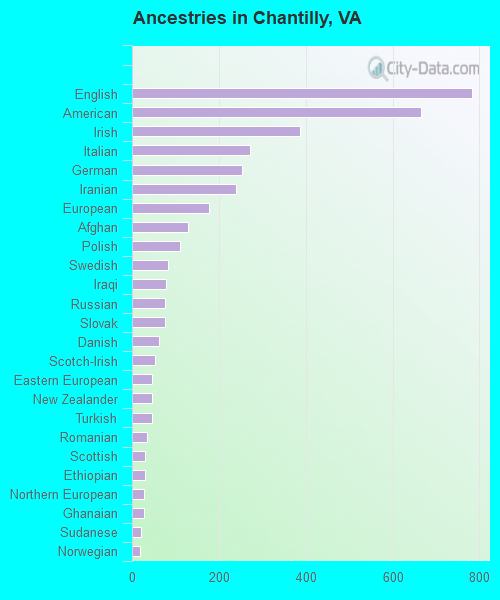
Ancestries in Chantilly
783 5.3% English666 4.5% American388 2.6% Irish272 1.8% Italian253 1.7% German240 1.6% Iranian178 1.2% European129 0.9% Afghan110 0.7% Polish82 0.6% Swedish78 0.5% Iraqi76 0.5% Russian75 0.5% Slovak62 0.4% Danish54 0.4% Scotch-Irish45 0.3% Eastern European45 0.3% New Zealander45 0.3% Turkish35 0.2% Romanian30 0.2% Scottish30 0.2% Ethiopian27 0.2% Northern European27 0.2% Ghanaian21 0.1% Sudanese19 0.1% Norwegian18 0.1% Cajun17 0.1% Canadian17 0.1% Czech15 0.1% Nigerian11 0.07% Egyptian11 0.07% Greek10 0.07% African9 0.06% Israeli8 0.05% Moroccan7 0.05% Bulgarian7 0.05% Dutch7 0.05% French6 0.04% Lebanese
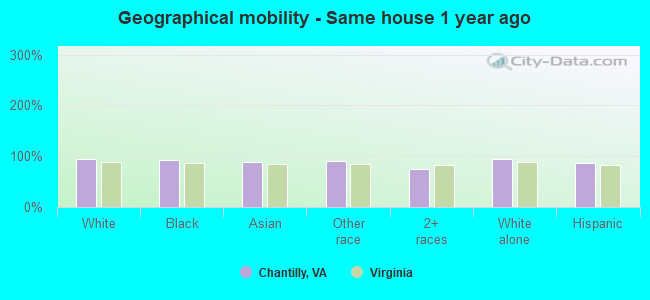
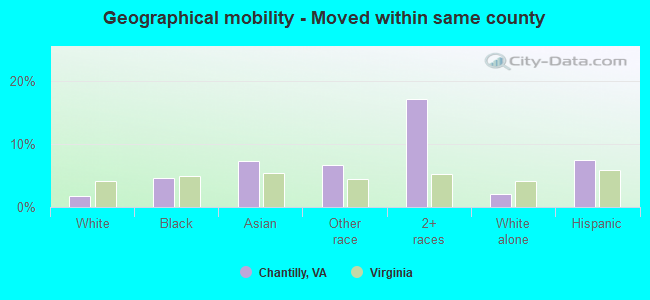
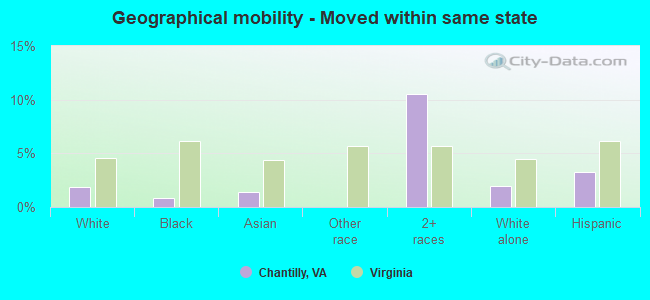
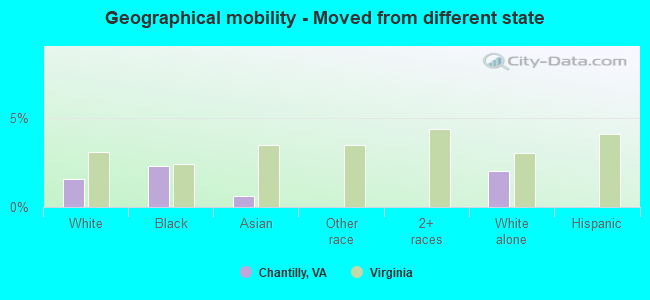
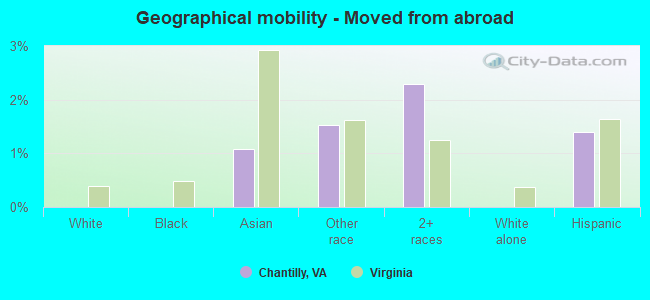
Geographical mobility in Chantilly Same house 1 year ago 8,435 94.8% White (Caucasian)759 91.7% Black or African American8,220 89.3% Asian1,249 90.8% Other race1,948 74.2% Two or more races7,033 93.9% White alone, not Hispanic / Latino3,953 87.0% Hispanic or LatinoMoved within same county 153 1.7% White / Caucasian38 4.6% Black or African American674 7.3% Asian93 6.7% Other race449 17.1% Two or more races149 2.0% White alone, not Hispanic / Latino340 7.5% Hispanic or LatinoMoved within same state 162 1.8% White / Caucasian7 0.9% Black or African American132 1.4% Asian277 10.5% Two or more races143 1.9% White alone, not Hispanic / Latino147 3.2% Hispanic or LatinoMoved from different state 141 1.6% White / Caucasian19 2.3% Black or African American58 0.6% Asian150 2.0% White alone, not Hispanic / LatinoMoved from abroad 99 1.1% Asian21 1.5% Other race60 2.3% Two or more races63 1.4% Hispanic or Latino
Children Nativity (place of birth) in Chantilly
Children under 6 years - Living with two parents Both parents native 335 97.3% Native9 2.7% Foreign-bornBoth parents foreign-born 493 100.0% NativeOne native, one foreign-born parent 165 100.0% NativeChildren under 6 years - Living with one parent Native parent 56 100.0% NativeForeign-born parent 131 82.3% Native28 17.7% Foreign-bornChildren 6 to 17 years - Living with two parents Both parents native 1,076 97.7% Native25 2.3% Foreign-bornBoth parents foreign-born 1,269 74.3% Native440 25.7% Foreign-bornOne native, one foreign-born parent 524 100.0% NativeChildren 6 to 17 years - Living with one parent Native parent 22 83.4% Native4 16.6% Foreign-bornForeign-born parent 429 65.7% Native224 34.3% Foreign-born
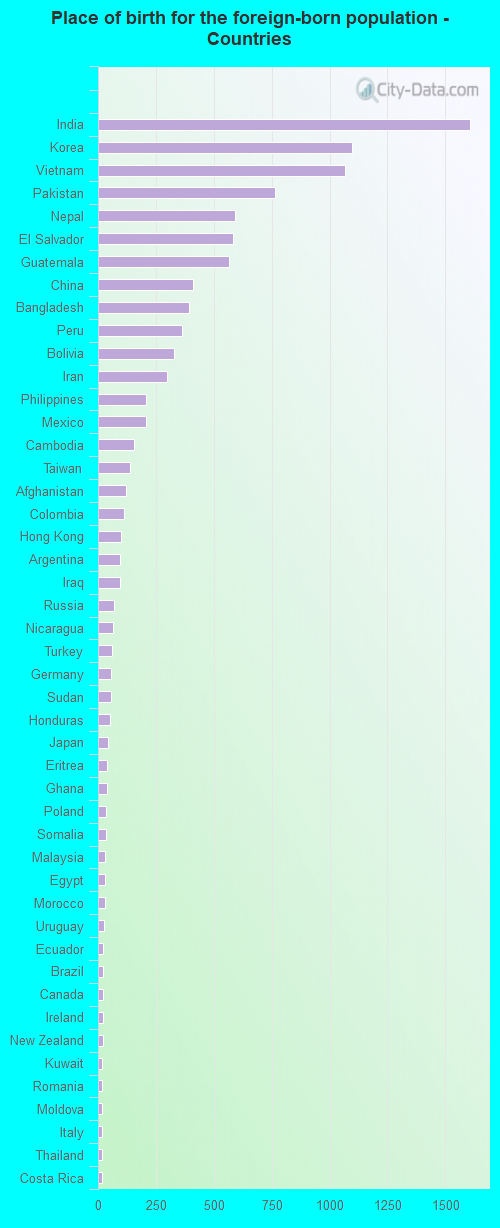
Place of birth for residents in Chantilly 7,260 Asia3,778 South Central Asia2,541 Americas2,519 Latin America1,793 Eastern Asia1,492 Central America1,490 South Eastern Asia1,026 South America650 China289 Europe253 Africa198 Western Asia154 Eastern Europe115 Northern Africa89 Eastern Africa75 Western Europe48 Western Africa33 Northern Europe28 Oceania28 Australia and New Zealand Subregion25 Southern Europe21 Northern America1,608 India1,097 Korea1,067 Vietnam766 Pakistan590 Nepal583 El Salvador565 Guatemala411 China394 Bangladesh362 Peru329 Bolivia299 Iran207 Philippines206 Mexico155 Cambodia138 Taiwan119 Afghanistan113 Colombia100 Hong Kong97 Argentina96 Iraq67 Russia66 Nicaragua59 Turkey54 Germany54 Sudan53 Honduras45 Japan41 Eritrea38 Ghana36 Poland33 Somalia30 Malaysia30 Egypt29 Morocco24 Uruguay23 Ecuador22 Brazil21 Canada21 Ireland20 New Zealand18 Kuwait17 Romania17 Moldova16 Italy16 Thailand16 Costa Rica13 France13 Kenya13 Bulgaria12 Israel12 Indonesia11 United Kingdom9 Nigeria9 Jordan9 Venezuela8 Spain7 Australia6 Netherlands
Grandparents responsible for own grandchildren in Chantilly
Grandparents (30 to 59 years) White / Caucasian 37 100.0% Not responsible for grandchildrenAsian 50 100.0% Not responsible for grandchildrenOther race 16 100.0% Not responsible for grandchildrenWhite alone, not Hispanic / Latino 11 100.0% Not responsible for grandchildrenHispanic or Latino 52 100.0% Not responsible for grandchildrenGrandparents (60 years and over) White / Caucasian 18 40.7% Responsible for grandchildren26 59.3% Not responsible for grandchildrenAsian 21 7.4% Responsible for grandchildren258 92.6% Not responsible for grandchildrenOther race 24 100.0% Not responsible for grandchildrenWhite alone, not Hispanic / Latino 19 40.3% Responsible for grandchildren29 59.7% Not responsible for grandchildrenHispanic or Latino 81 100.0% Not responsible for grandchildren