Races in Charlotte, North Carolina (NC) Detailed Stats
Data:
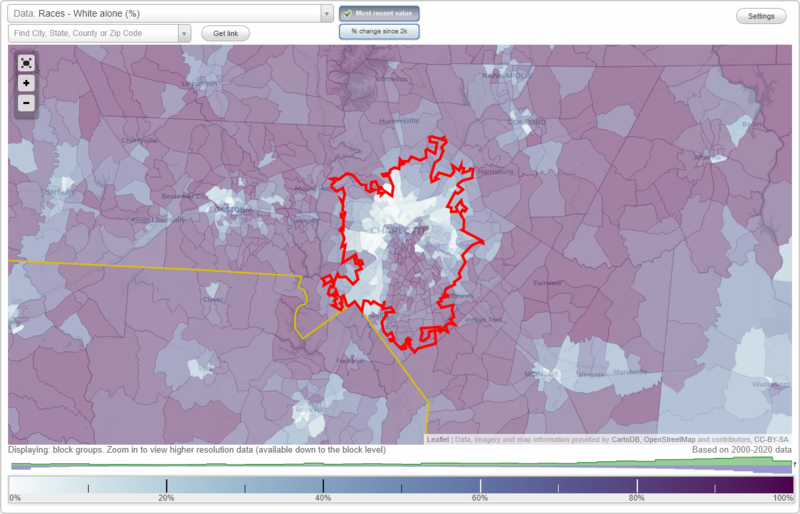
Races - White alone (%)
Races - White alone (% change since 2000)
Races - Black alone (%)
Races - Black alone (% change since 2000)
Races - American Indian alone (%)
Races - American Indian alone (% change since 2000)
Races - Asian alone (%)
Races - Asian alone (% change since 2000)
Races - Hispanic (%)
Races - Hispanic (% change since 2000)
Races - Native Hawaiian and Other Pacific Islander alone (%)
Races - Native Hawaiian and Other Pacific Islander alone (% change since 2000)
Races - Two or more races(%)
Races - Two or more races(% change since 2000)
Races - Other race alone (%)
Races - Other race alone (% change since 2000)
Racial diversity
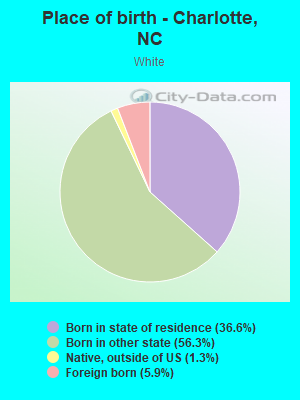
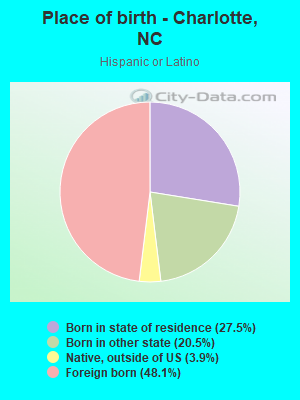
Place of birth - Born in state of residence (%)
Place of birth - Born in state of residence (%) - White
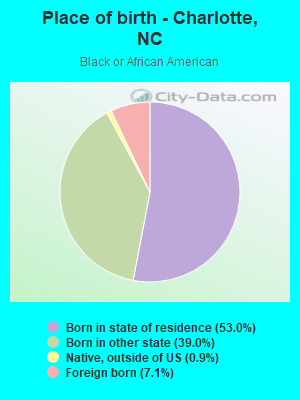
Place of birth - Born in state of residence (%) - Black or African American
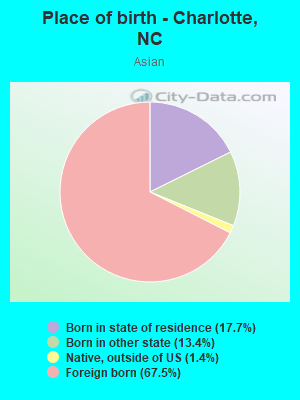
Place of birth - Born in state of residence (%) - Asian
Place of birth - Born in state of residence (%) - Hispanic or Latino
Place of birth - Born in state of residence (%) - American Indian and Alaska Native
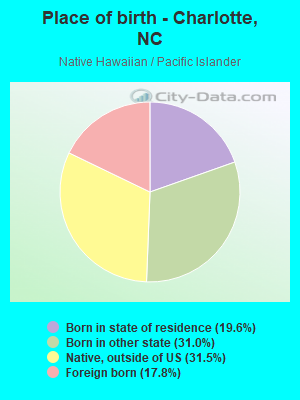
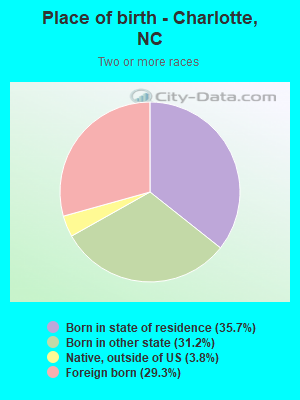
Place of birth - Born in state of residence (%) - Multirace
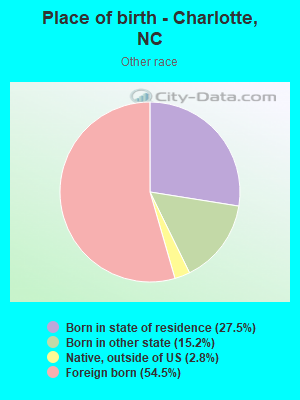
Place of birth - Born in state of residence (%) - Other Race
Place of birth - Born in other state (%)
Place of birth - Born in other state (%) - White
Place of birth - Born in other state (%) - Black or African American
Place of birth - Born in other state (%) - Asian
Place of birth - Born in other state (%) - Hispanic or Latino
Place of birth - Born in other state (%) - American Indian and Alaska Native
Place of birth - Born in other state (%) - Multirace
Place of birth - Born in other state (%) - Other Race
Place of birth - Native, outside of US (%)
Place of birth - Native, outside of US (%) - White
Place of birth - Native, outside of US (%) - Black or African American
Place of birth - Native, outside of US (%) - Asian
Place of birth - Native, outside of US (%) - Hispanic or Latino
Place of birth - Native, outside of US (%) - American Indian and Alaska Native
Place of birth - Native, outside of US (%) - Multirace
Place of birth - Native, outside of US (%) - Other Race
Place of birth - Foreign born (%)
Place of birth - Foreign born (%) - White
Place of birth - Foreign born (%) - Black or African American
Place of birth - Foreign born (%) - Asian
Place of birth - Foreign born (%) - Hispanic or Latino
Place of birth - Foreign born (%) - American Indian and Alaska Native
Place of birth - Foreign born (%) - Multirace
Place of birth - Foreign born (%) - Other Race
Residents speaking English at home (%)
Residents speaking English at home - Born in the United States (%)
Residents speaking English at home - Native, born elsewhere (%)
Residents speaking English at home - Foreign born (%)
Residents speaking Spanish at home (%)
Residents speaking Spanish at home - Born in the United States (%)
Residents speaking Spanish at home - Native, born elsewhere (%)
Residents speaking Spanish at home - Foreign born (%)
Residents speaking other language at home (%)
Residents speaking other language at home - Born in the United States (%)
Residents speaking other language at home - Native, born elsewhere (%)
Residents speaking other language at home - Foreign born (%)
Marital status - Never married (%)
Marital status - Now married (%)
Marital status - Separated (%)
Marital status - Widowed (%)
Marital status - Divorced (%)
Ancestries Reported - Arab (%)
Ancestries Reported - Czech (%)
Ancestries Reported - Danish (%)
Ancestries Reported - Dutch (%)
Ancestries Reported - English (%)
Ancestries Reported - French (%)
Ancestries Reported - French Canadian (%)
Ancestries Reported - German (%)
Ancestries Reported - Greek (%)
Ancestries Reported - Hungarian (%)
Ancestries Reported - Irish (%)
Ancestries Reported - Italian (%)
Ancestries Reported - Lithuanian (%)
Ancestries Reported - Norwegian (%)
Ancestries Reported - Polish (%)
Ancestries Reported - Portuguese (%)
Ancestries Reported - Russian (%)
Ancestries Reported - Scotch-Irish (%)
Ancestries Reported - Scottish (%)
Ancestries Reported - Slovak (%)
Ancestries Reported - Subsaharan African (%)
Ancestries Reported - Swedish (%)
Ancestries Reported - Swiss (%)
Ancestries Reported - Ukrainian (%)
Ancestries Reported - United States (%)
Ancestries Reported - Welsh (%)
Ancestries Reported - West Indian (%)
Ancestries Reported - Other (%)
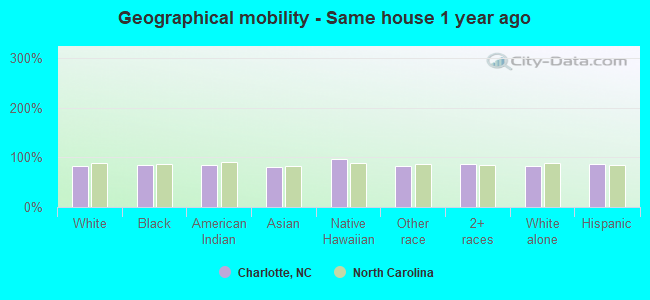
Geographical mobility - Same house 1 year ago (%)
Geographical mobility - Same house 1 year ago (%) - White
Geographical mobility - Same house 1 year ago (%) - Black or African American
Geographical mobility - Same house 1 year ago (%) - Asian
Geographical mobility - Same house 1 year ago (%) - Hispanic or Latino
Geographical mobility - Same house 1 year ago (%) - American Indian and Alaska Native
Geographical mobility - Same house 1 year ago (%) - Multirace
Geographical mobility - Same house 1 year ago (%) - Other Race
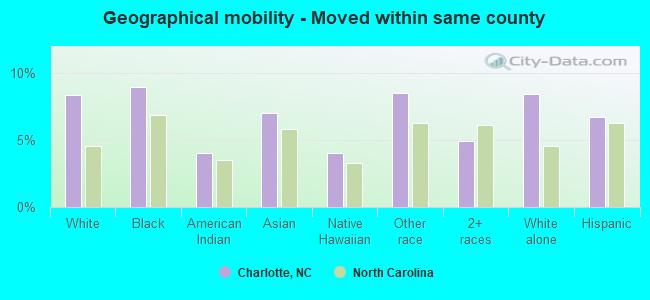
Geographical mobility - Moved within same county (%)
Geographical mobility - Moved within same county (%) - White
Geographical mobility - Moved within same county (%) - Black or African American
Geographical mobility - Moved within same county (%) - Asian
Geographical mobility - Moved within same county (%) - Hispanic or Latino
Geographical mobility - Moved within same county (%) - American Indian and Alaska Native
Geographical mobility - Moved within same county (%) - Multirace
Geographical mobility - Moved within same county (%) - Other Race
Geographical mobility - Moved from different county within same state (%)
Geographical mobility - Moved from different county within same state (%) - White
Geographical mobility - Moved from different county within same state (%) - Black or African American
Geographical mobility - Moved from different county within same state (%) - Asian
Geographical mobility - Moved from different county within same state (%) - Hispanic or Latino
Geographical mobility - Moved from different county within same state (%) - American Indian and Alaska Native
Geographical mobility - Moved from different county within same state (%) - Multirace
Geographical mobility - Moved from different county within same state (%) - Other Race
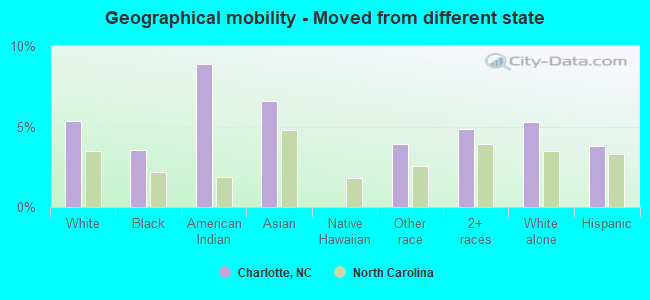
Geographical mobility - Moved from different state (%)
Geographical mobility - Moved from different state (%) - White
Geographical mobility - Moved from different state (%) - Black or African American
Geographical mobility - Moved from different state (%) - Asian
Geographical mobility - Moved from different state (%) - Hispanic or Latino
Geographical mobility - Moved from different state (%) - American Indian and Alaska Native
Geographical mobility - Moved from different state (%) - Multirace
Geographical mobility - Moved from different state (%) - Other Race
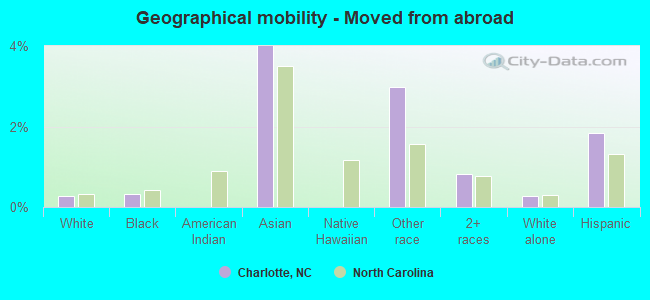
Geographical mobility - Moved from abroad (%)
Geographical mobility - Moved from abroad (%) - White
Geographical mobility - Moved from abroad (%) - Black or African American
Geographical mobility - Moved from abroad (%) - Asian
Geographical mobility - Moved from abroad (%) - Hispanic or Latino
Geographical mobility - Moved from abroad (%) - American Indian and Alaska Native
Geographical mobility - Moved from abroad (%) - Multirace
Geographical mobility - Moved from abroad (%) - Other Race
Place of birth for the foreign-born population - Ireland (%)
Place of birth for the foreign-born population - Denmark (%)
Place of birth for the foreign-born population - Norway (%)
Place of birth for the foreign-born population - Sweden (%)
Place of birth for the foreign-born population - United Kingdom (%)
Place of birth for the foreign-born population - England (%)
Place of birth for the foreign-born population - Scotland (%)
Place of birth for the foreign-born population - Other Northern Europe (%)
Place of birth for the foreign-born population - Austria (%)
Place of birth for the foreign-born population - Belgium (%)
Place of birth for the foreign-born population - France (%)
Place of birth for the foreign-born population - Germany (%)
Place of birth for the foreign-born population - Netherlands (%)
Place of birth for the foreign-born population - Switzerland (%)
Place of birth for the foreign-born population - Other Western Europe (%)
Place of birth for the foreign-born population - Greece (%)
Place of birth for the foreign-born population - Italy (%)
Place of birth for the foreign-born population - Portugal (%)
Place of birth for the foreign-born population - Spain (%)
Place of birth for the foreign-born population - Other Southern Europe (%)
Place of birth for the foreign-born population - Albania (%)
Place of birth for the foreign-born population - Belarus (%)
Place of birth for the foreign-born population - Bosnia and Herzegovina (%)
Place of birth for the foreign-born population - Bulgaria (%)
Place of birth for the foreign-born population - Croatia (%)
Place of birth for the foreign-born population - Czechoslovakia (%)
Place of birth for the foreign-born population - Hungary (%)
Place of birth for the foreign-born population - Latvia (%)
Place of birth for the foreign-born population - Lithuania (%)
Place of birth for the foreign-born population - North Macedonia (Macedonia) (%)
Place of birth for the foreign-born population - Moldova (%)
Place of birth for the foreign-born population - Poland (%)
Place of birth for the foreign-born population - Romania (%)
Place of birth for the foreign-born population - Russia (%)
Place of birth for the foreign-born population - Serbia (%)
Place of birth for the foreign-born population - Ukraine (%)
Place of birth for the foreign-born population - Other Eastern Europe (%)
Place of birth for the foreign-born population - China (%)
Place of birth for the foreign-born population - Hong Kong (%)
Place of birth for the foreign-born population - Taiwan (%)
Place of birth for the foreign-born population - Japan (%)
Place of birth for the foreign-born population - Korea (%)
Place of birth for the foreign-born population - Other Eastern Asia (%)
Place of birth for the foreign-born population - Afghanistan (%)
Place of birth for the foreign-born population - Bangladesh (%)
Place of birth for the foreign-born population - India (%)
Place of birth for the foreign-born population - Iran (%)
Place of birth for the foreign-born population - Kazakhstan (%)
Place of birth for the foreign-born population - Nepal (%)
Place of birth for the foreign-born population - Pakistan (%)
Place of birth for the foreign-born population - Sri Lanka (%)
Place of birth for the foreign-born population - Uzbekistan (%)
Place of birth for the foreign-born population - Other South Central Asia (%)
Place of birth for the foreign-born population - Burma (%)
Place of birth for the foreign-born population - Cambodia (%)
Place of birth for the foreign-born population - Indonesia (%)
Place of birth for the foreign-born population - Laos (%)
Place of birth for the foreign-born population - Malaysia (%)
Place of birth for the foreign-born population - Philippines (%)
Place of birth for the foreign-born population - Singapore (%)
Place of birth for the foreign-born population - Thailand (%)
Place of birth for the foreign-born population - Vietnam (%)
Place of birth for the foreign-born population - Other South Eastern Asia (%)
Place of birth for the foreign-born population - Armenia (%)
Place of birth for the foreign-born population - Iraq (%)
Place of birth for the foreign-born population - Israel (%)
Place of birth for the foreign-born population - Jordan (%)
Place of birth for the foreign-born population - Kuwait (%)
Place of birth for the foreign-born population - Lebanon (%)
Place of birth for the foreign-born population - Saudi Arabia (%)
Place of birth for the foreign-born population - Syria (%)
Place of birth for the foreign-born population - Turkey (%)
Place of birth for the foreign-born population - Yemen (%)
Place of birth for the foreign-born population - Other Western Asia (%)
Place of birth for the foreign-born population - Eritrea (%)
Place of birth for the foreign-born population - Ethiopia (%)
Place of birth for the foreign-born population - Kenya (%)
Place of birth for the foreign-born population - Somalia (%)
Place of birth for the foreign-born population - Uganda (%)
Place of birth for the foreign-born population - Zimbabwe (%)
Place of birth for the foreign-born population - Other Eastern Africa (%)
Place of birth for the foreign-born population - Cameroon (%)
Place of birth for the foreign-born population - Congo (%)
Place of birth for the foreign-born population - Democratic Republic of Congo (Zaire) (%)
Place of birth for the foreign-born population - Other Middle Africa (%)
Place of birth for the foreign-born population - Egypt (%)
Place of birth for the foreign-born population - Morocco (%)
Place of birth for the foreign-born population - Sudan (%)
Place of birth for the foreign-born population - Other Northern Africa (%)
Place of birth for the foreign-born population - South Africa (%)
Place of birth for the foreign-born population - Other Southern Africa (%)
Place of birth for the foreign-born population - Cabo Verde (%)
Place of birth for the foreign-born population - Ghana (%)
Place of birth for the foreign-born population - Liberia (%)
Place of birth for the foreign-born population - Nigeria (%)
Place of birth for the foreign-born population - Senegal (%)
Place of birth for the foreign-born population - Sierra Leone (%)
Place of birth for the foreign-born population - Other Western Africa (%)
Place of birth for the foreign-born population - Australia (%)
Place of birth for the foreign-born population - New Zealand (%)
Place of birth for the foreign-born population - Fiji (%)
Place of birth for the foreign-born population - Micronesia (%)
Place of birth for the foreign-born population - Bahamas (%)
Place of birth for the foreign-born population - Barbados (%)
Place of birth for the foreign-born population - Cuba (%)
Place of birth for the foreign-born population - Dominica (%)
Place of birth for the foreign-born population - Dominican Republic (%)
Place of birth for the foreign-born population - Grenada (%)
Place of birth for the foreign-born population - Haiti (%)
Place of birth for the foreign-born population - Jamaica (%)
Place of birth for the foreign-born population - St. Vincent and the Grenadines (%)
Place of birth for the foreign-born population - Trinidad and Tobago (%)
Place of birth for the foreign-born population - West Indies (%)
Place of birth for the foreign-born population - Other Caribbean (%)
Place of birth for the foreign-born population - Belize (%)
Place of birth for the foreign-born population - Costa Rica (%)
Place of birth for the foreign-born population - El Salvador (%)
Place of birth for the foreign-born population - Guatemala (%)
Place of birth for the foreign-born population - Honduras (%)
Place of birth for the foreign-born population - Mexico (%)
Place of birth for the foreign-born population - Nicaragua (%)
Place of birth for the foreign-born population - Panama (%)
Place of birth for the foreign-born population - Other Central America (%)
Place of birth for the foreign-born population - Argentina (%)
Place of birth for the foreign-born population - Bolivia (%)
Place of birth for the foreign-born population - Brazil (%)
Place of birth for the foreign-born population - Chile (%)
Place of birth for the foreign-born population - Colombia (%)
Place of birth for the foreign-born population - Ecuador (%)
Place of birth for the foreign-born population - Guyana (%)
Place of birth for the foreign-born population - Peru (%)
Place of birth for the foreign-born population - Uruguay (%)
Place of birth for the foreign-born population - Venezuela (%)
Place of birth for the foreign-born population - Other South America (%)
Place of birth for the foreign-born population - Canada (%)
Place of birth for the foreign-born population - Other Northern America (%)
Place of birth for the foreign-born population - Other (%)
Latest news about races in Charlotte, NC collected exclusively by city-data.com from local newspapers, TV, and radio stations
According to 2022 data, the most numerous races in Charlotte, NC are White alone (357,266 residents), Black alone (305,127 residents), and Hispanic (142,205 residents). 78.1% of Charlotte residents speak English at home. 17.9% of Charlotte, NC residents are foreign-born (8.4% born in Latin America, 5.2% born in Asia, 2.0% born in Africa), which is 55.3% greater than the foreign-born rate of 8.0% across the entire state of North Carolina.
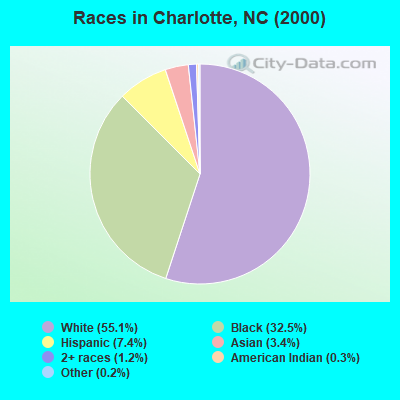
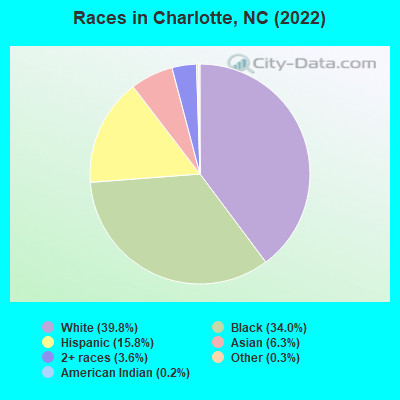
Race distribution in Charlotte
2000 2022
297,845 55.1% White alone 175,661 32.5% Black alone 39,800 7.4% Hispanic 18,264 3.4% Asian alone 6,546 1.2% Two or more races 1,589 0.3% American Indian alone 885 0.2% Other race alone 238 0.04% Native Hawaiian and Other
357,266 39.8% White alone 305,127 34.0% Black alone 142,205 15.8% Hispanic 56,408 6.3% Asian alone 32,100 3.6% Two or more races 2,681 0.3% Other race alone 1,571 0.2% American Indian alone 362 0.04% Native Hawaiian and Other
2000 2022
5,647,155 70.2% White alone 1,723,301 21.4% Black alone 378,963 4.7% Hispanic 112,416 1.4% Asian alone 95,333 1.2% American Indian alone 79,965 1.0% Two or more races 9,015 0.1% Other race alone 3,165 0.04% Native Hawaiian and Other
6,497,519 60.7% White alone 2,155,650 20.1% Black alone 1,114,799 10.4% Hispanic 438,061 4.1% Two or more races 341,052 3.2% Asian alone 91,758 0.9% American Indian alone 50,180 0.5% Other race alone 9,954 0.09% Native Hawaiian and Other
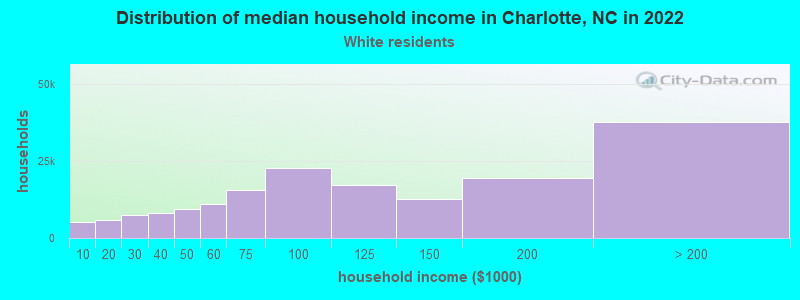
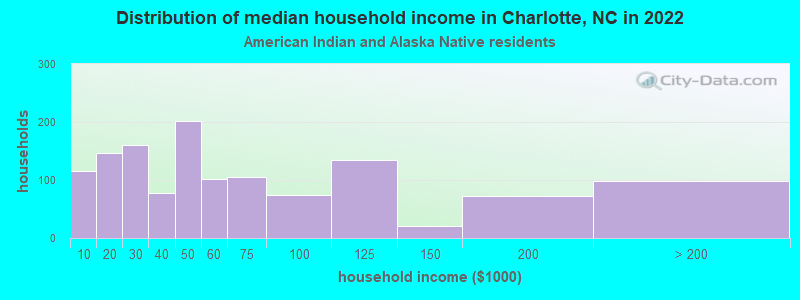
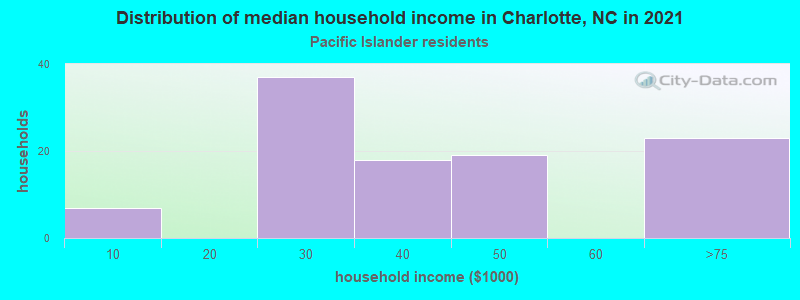
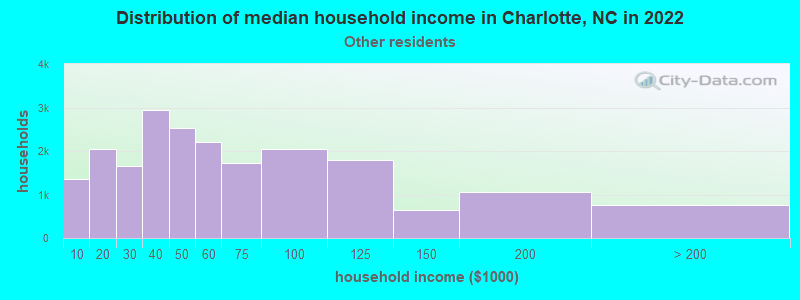
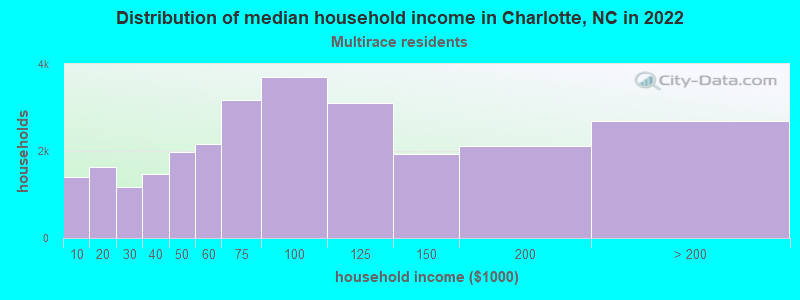
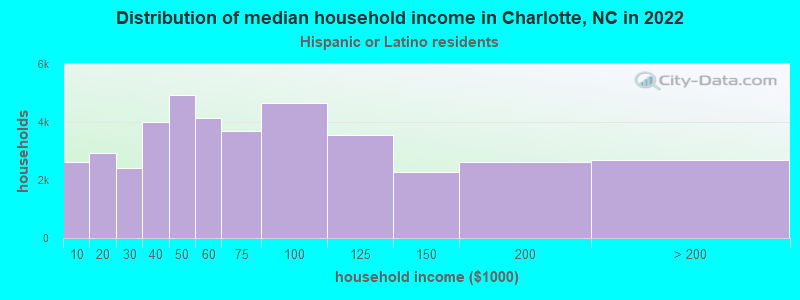
Income and house value in Charlotte Median household income in 2022 $101,253 White non-Hispanic householders$52,578 Black householders$54,850 American Indian and Alaska Native householders$103,806 Asian householders$49,679 Some other race householders$76,544 Two or more races householders$57,701 Hispanic or Latino race householdersMedian 2022 house value $449,524 White Non-Hispanic householders$267,720 Black or African American householders$335,164 American Indian or Alaska Native householders $358,329 Asian householders$267,720 Native Hawaiian and other Pacific Islander householders$308,480 Some other race householders$341,615 Two or more races householders$344,840 Hispanic or Latino householders
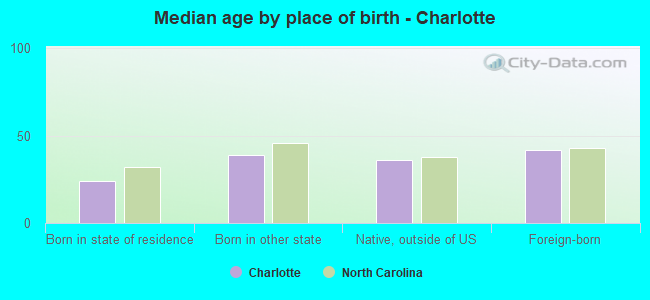
Median age by race in Charlotte
38.4 Median age for White residents38.0 39.0 34.3 Median age for Black or African American residents32.3 35.9 30.1 Median age for American Indian / Alaska Native residents29.1 32.4 34.3 Median age for Asian residents33.9 34.5 37.0 Median age for Native Hawaiian / Pacific Islander residents-666,666,666.0 -666,666,666.0 26.2 Median age for Other race residents27.5 24.8 26.7 Median age for Two or more races residents25.7 27.6 38.6 Median age for White alone residents38.2 39.1 26.7 Median age for Hispanic or Latino residents26.1 27.2
Owner/renter occupied households by race in Charlotte
House owners and renters - White residents 107,453 62.5% Owner occupied64,528 37.5% Renter occupiedHouse owners and renters - Black or African American residents 52,580 38.5% Owner occupied84,130 61.5% Renter occupiedHouse owners and renters - American Indian / Alaska Native residents 895 48.0% Owner occupied968 52.0% Renter occupiedHouse owners and renters - Asian residents 10,698 53.4% Owner occupied9,353 46.6% Renter occupiedHouse owners and renters - Native Hawaiian / Pacific Islander residents 105 63.1% Owner occupied61 36.9% Renter occupiedHouse owners and renters - Other race residents 7,307 35.2% Owner occupied13,463 64.8% Renter occupiedHouse owners and renters - Two or more races residents 13,106 49.4% Owner occupied13,430 50.6% Renter occupiedHouse owners and renters - White alone residents 106,121 62.9% Owner occupied62,554 37.1% Renter occupiedHouse owners and renters - Hispanic or Latino residents 17,426 43.0% Owner occupied23,086 57.0% Renter occupied
Language usage in Charlotte
English speakers - Total 78.1% of residents of Charlotte speak English at home.
13.0% of residents speak Spanish at home 50,775 46.4% Speak English very well58,571 53.6% Speak English less than very well8.9% of residents speak other language at home 50,315 67.3% Speak English very well24,495 32.7% Speak English less than very well
English speakers - Born in the United States 93.2% of residents of Charlotte speak English at home.
4.5% of residents speak Spanish at home 13,161 79.6% Speak English very well3,382 20.4% Speak English less than very well2.3% of residents speak other language at home 7,694 92.5% Speak English very well624 7.5% Speak English less than very well
English speakers - Native, born elsewhere 56.5% of residents of Charlotte speak English at home.
32.7% of residents speak Spanish at home 2,919 66.3% Speak English very well1,481 33.7% Speak English less than very well10.8% of residents speak other language at home 1,447 100.0% Speak English very well
English speakers - Foreign-born 17.8% of residents of Charlotte speak English at home.
43.8% of residents speak Spanish at home 16,539 25.5% Speak English very well48,322 74.5% Speak English less than very well38.3% of residents speak other language at home 33,856 59.7% Speak English very well22,864 40.3% Speak English less than very well
White (Caucasian) - Speak only English Native:
96.4% (314,473)Foreign-born:
32.4% (6,814)
White (Caucasian) - Speak another language Native:
3.6% (11,621)Foreign-born:
67.6% (14,248)
Black or African American - Speak only English Native:
97.5% (263,498)Foreign-born:
50.1% (10,968)
Black or African American - Speak another language Native:
2.5% (6,627)Foreign-born:
49.9% (10,936)
American Indian / Alaska Native - Speak only English Native:
73.5% (1,861)Foreign-born:
5.6% (156)
American Indian / Alaska Native - Speak another language Native:
26.5% (671)Foreign-born:
94.4% (2,609)
Asian - Speak only English Native:
54.8% (8,466)Foreign-born:
14.6% (5,592)
Asian - Speak another language Native:
45.2% (6,982)Foreign-born:
85.4% (32,587)
Native Hawaiian / Pacific Islander - Speak another language Native:
35.2% (104)Foreign-born:
71.9% (51)
Other race - Speak only English Native:
20.8% (5,745)Foreign-born:
2.8% (1,108)
Other race - Speak another language Native:
79.2% (21,839)Foreign-born:
97.2% (37,886)
Two or more races - Speak only English Native:
71.2% (36,375)Foreign-born:
7.0% (1,755)
Two or more races - Speak another language Native:
28.8% (14,709)Foreign-born:
93.0% (23,315)
White alone - Speak only English Native:
96.9% (311,581)Foreign-born:
34.3% (6,760)
White alone - Speak another language Native:
3.1% (10,121)Foreign-born:
65.7% (12,975)
Hispanic or Latino - Speak only English Native:
37.9% (23,114)Foreign-born:
3.1% (2,041)
Hispanic or Latino - Speak another language Native:
62.1% (37,900)Foreign-born:
96.9% (64,054)
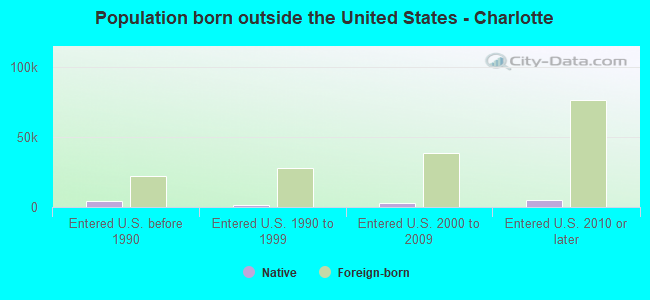
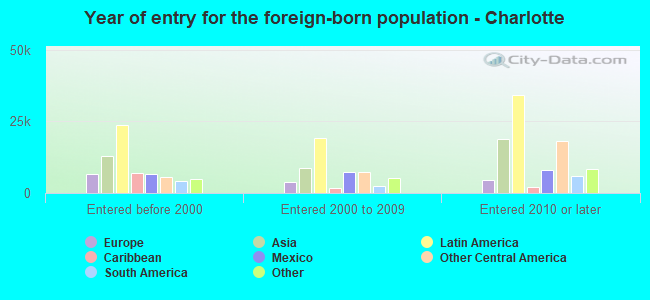
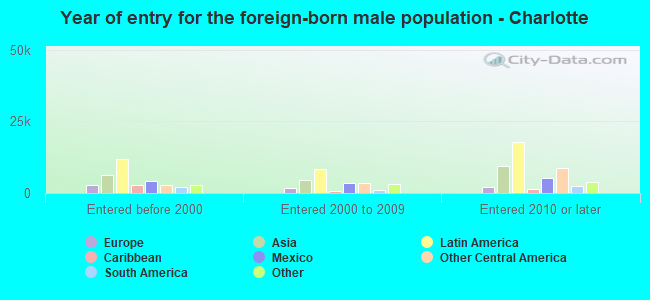
Foreign-born residents in Charlotte 160,974 residents are foreign born (8.4% Latin America , 5.2% Asia , 2.0% Africa ).
This city:
17.9%North Carolina:
8.3%
Marital status for residents in Charlotte Marital status - White (Caucasian) population 15 years and over
Males 39.2% Never married49.5% Now married0.8% Separated2.0% Widowed8.4% DivorcedFemales 36.5% Never married46.7% Now married1.0% Separated6.1% Widowed9.7% DivorcedWomen who gave birth in the past 12 months Now married:
81.3% (3,867)Unmarried:
18.7% (891)
Women who did not give birth in the past 12 months Now married:
38.1% (35,449)Unmarried:
61.9% (57,591)
Marital status - Black or African American population 15 years and over
Males 52.6% Never married33.2% Now married2.0% Separated2.0% Widowed10.2% DivorcedFemales 51.1% Never married25.5% Now married3.6% Separated5.9% Widowed13.9% DivorcedWomen who gave birth in the past 12 months Now married:
50.0% (1,588)Unmarried:
50.0% (1,585)
Women who did not give birth in the past 12 months Now married:
25.2% (22,695)Unmarried:
74.8% (67,393)
Marital status - American Indian / Alaska Native population 15 years and over
Males 47.0% Never married45.0% Now married1.4% Separated0.0% Widowed6.6% DivorcedFemales 29.1% Never married49.4% Now married0.1% Separated8.7% Widowed12.7% DivorcedWomen who gave birth in the past 12 months Now married:
86.1% (33)Unmarried:
13.9% (5)
Women who did not give birth in the past 12 months Now married:
45.1% (394)Unmarried:
54.9% (479)
Marital status - Asian population 15 years and over
Males 36.0% Never married61.4% Now married0.3% Separated0.0% Widowed2.3% DivorcedFemales 26.4% Never married60.2% Now married0.2% Separated3.3% Widowed9.9% DivorcedWomen who gave birth in the past 12 months Now married:
100.0% (736)Unmarried:
0.0% (0)
Women who did not give birth in the past 12 months Now married:
55.6% (9,461)Unmarried:
44.4% (7,555)
Marital status - Native Hawaiian / Pacific Islander population 15 years and over
Males 68.8% Never married31.2% Now married0.0% Separated0.0% Widowed0.0% DivorcedFemales 34.9% Never married43.2% Now married0.0% Separated21.9% Widowed0.0% DivorcedWomen who did not give birth in the past 12 months Now married:
52.8% (69)Unmarried:
47.2% (62)
Marital status - Other race population 15 years and over
Males 52.0% Never married40.0% Now married2.8% Separated0.7% Widowed4.5% DivorcedFemales 41.7% Never married40.1% Now married5.5% Separated4.4% Widowed8.3% DivorcedWomen who gave birth in the past 12 months Now married:
79.6% (907)Unmarried:
20.4% (232)
Women who did not give birth in the past 12 months Now married:
45.9% (9,051)Unmarried:
54.1% (10,679)
Marital status - Two or more races population 15 years and over
Males 53.8% Never married33.8% Now married0.2% Separated1.3% Widowed10.9% DivorcedFemales 43.7% Never married35.8% Now married3.6% Separated3.2% Widowed13.6% DivorcedWomen who gave birth in the past 12 months Now married:
79.9% (861)Unmarried:
20.1% (217)
Women who did not give birth in the past 12 months Now married:
34.8% (7,004)Unmarried:
65.2% (13,105)
Marital status - White alone, not Hispanic / Latino population 15 years and over
Males 39.0% Never married49.6% Now married0.9% Separated2.0% Widowed8.4% DivorcedFemales 36.4% Never married46.7% Now married1.0% Separated6.1% Widowed9.8% DivorcedWomen who gave birth in the past 12 months Now married:
81.7% (3,827)Unmarried:
18.3% (855)
Women who did not give birth in the past 12 months Now married:
37.9% (34,629)Unmarried:
62.1% (56,644)
Marital status - Hispanic or Latino population 15 years and over
Males 51.0% Never married38.8% Now married1.5% Separated1.2% Widowed7.5% DivorcedFemales 41.8% Never married40.6% Now married4.6% Separated3.4% Widowed9.6% DivorcedWomen who gave birth in the past 12 months Now married:
83.8% (1,624)Unmarried:
16.2% (313)
Women who did not give birth in the past 12 months Now married:
42.3% (15,570)Unmarried:
57.7% (21,208)
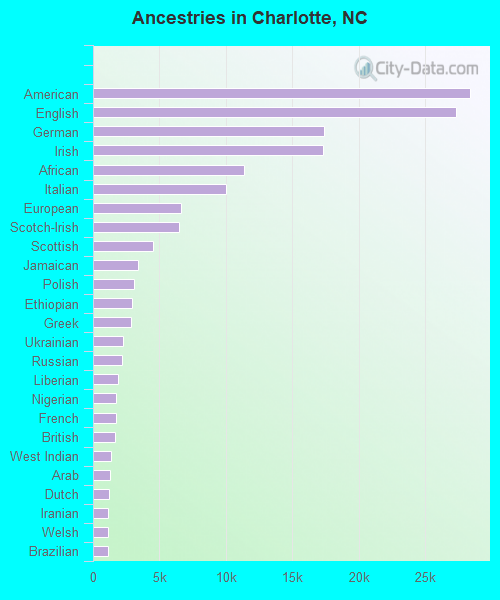
Ancestries in Charlotte
28,396 5.2% American27,322 5.0% English17,365 3.2% German17,346 3.2% Irish11,364 2.1% African9,995 1.8% Italian6,597 1.2% European6,510 1.2% Scotch-Irish4,546 0.8% Scottish3,369 0.6% Jamaican3,091 0.6% Polish2,958 0.5% Ethiopian2,827 0.5% Greek2,245 0.4% Ukrainian2,148 0.4% Russian1,855 0.3% Liberian1,719 0.3% Nigerian1,717 0.3% French1,652 0.3% British1,351 0.2% West Indian1,293 0.2% Arab1,184 0.2% Dutch1,136 0.2% Iranian1,098 0.2% Welsh1,096 0.2% Brazilian1,080 0.2% Romanian1,006 0.2% Haitian979 0.2% Lebanese866 0.2% Norwegian835 0.2% Ghanaian747 0.1% Eastern European737 0.1% French Canadian671 0.1% Swedish573 0.1% Moroccan536 0.10% Somali495 0.09% Yugoslavian439 0.08% Trinidadian and Tobagonian426 0.08% Scandinavian422 0.08% Portuguese382 0.07% Hungarian370 0.07% Slovak367 0.07% Egyptian357 0.06% Guyanese352 0.06% Swiss345 0.06% Turkish337 0.06% Canadian334 0.06% Armenian333 0.06% Czech288 0.05% Danish287 0.05% Senegalese264 0.05% Zimbabwean260 0.05% Belgian254 0.05% Cape Verdean253 0.05% Finnish241 0.04% Northern European238 0.04% South African235 0.04% Austrian221 0.04% Afghan215 0.04% Slavic215 0.04% Sudanese208 0.04% Lithuanian206 0.04% Palestinian205 0.04% Bulgarian180 0.03% Barbadian171 0.03% Macedonian168 0.03% Jordanian156 0.03% Croatian153 0.03% Sierra Leonean132 0.02% Albanian131 0.02% Kenyan130 0.02% Iraqi127 0.02% Syrian119 0.02% Czechoslovakian108 0.02% Israeli106 0.02% Serbian103 0.02% Slovene94 0.02% British West Indian87 0.02% Australian83 0.02% German Russian53 0.01% Estonian45 0.01% Latvian41 0.01% Belizean41 0.01% Dutch West Indian32 0.01% Maltese
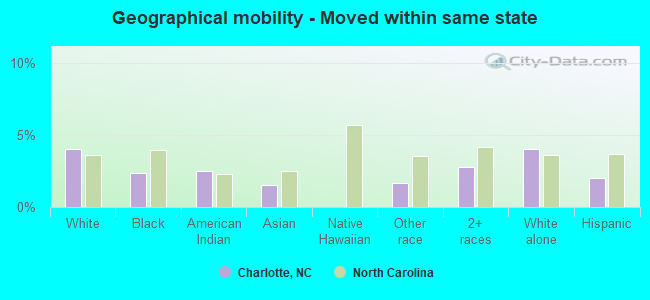
Geographical mobility in Charlotte Same house 1 year ago 294,897 82.0% White (Caucasian)258,699 84.7% Black or African American4,575 84.5% American Indian / Alaska Native46,220 80.8% Asian389 96.6% Native Hawaiian / Pacific Islander61,549 82.9% Other race72,542 86.6% Two or more races290,038 82.0% White alone, not Hispanic / Latino119,474 85.7% Hispanic or LatinoMoved within same county 29,967 8.3% White / Caucasian27,389 9.0% Black or African American219 4.0% American Indian / Alaska Native4,014 7.0% Asian16 4.0% Native Hawaiian / Pacific Islander6,318 8.5% Other race4,093 4.9% Two or more races29,702 8.4% White alone, not Hispanic / Latino9,317 6.7% Hispanic or LatinoMoved within same state 14,573 4.1% White / Caucasian7,299 2.4% Black or African American137 2.5% American Indian / Alaska Native886 1.5% Asian1,245 1.7% Other race2,330 2.8% Two or more races14,262 4.0% White alone, not Hispanic / Latino2,853 2.0% Hispanic or LatinoMoved from different state 19,177 5.3% White / Caucasian10,879 3.6% Black or African American481 8.9% American Indian / Alaska Native3,750 6.6% Asian2,906 3.9% Other race4,071 4.9% Two or more races18,570 5.3% White alone, not Hispanic / Latino5,241 3.8% Hispanic or LatinoMoved from abroad 1,026 0.3% White1,021 0.3% Black or African American2,308 4.0% Asian2,204 3.0% Other race696 0.8% Two or more races943 0.3% White alone, not Hispanic / Latino2,547 1.8% Hispanic or Latino
Children Nativity (place of birth) in Charlotte
Children under 6 years - Living with two parents Both parents native 23,818 100.0% NativeBoth parents foreign-born 8,215 81.1% Native1,916 18.9% Foreign-bornOne native, one foreign-born parent 7,089 100.0% NativeChildren under 6 years - Living with one parent Native parent 16,177 100.0% NativeForeign-born parent 5,569 80.4% Native1,356 19.6% Foreign-bornChildren 6 to 17 years - Living with two parents Both parents native 44,511 99.7% Native151 0.3% Foreign-bornBoth parents foreign-born 18,272 71.7% Native7,210 28.3% Foreign-bornOne native, one foreign-born parent 5,375 97.2% Native154 2.8% Foreign-bornChildren 6 to 17 years - Living with one parent Native parent 35,410 100.0% NativeForeign-born parent 11,339 57.8% Native8,287 42.2% Foreign-born
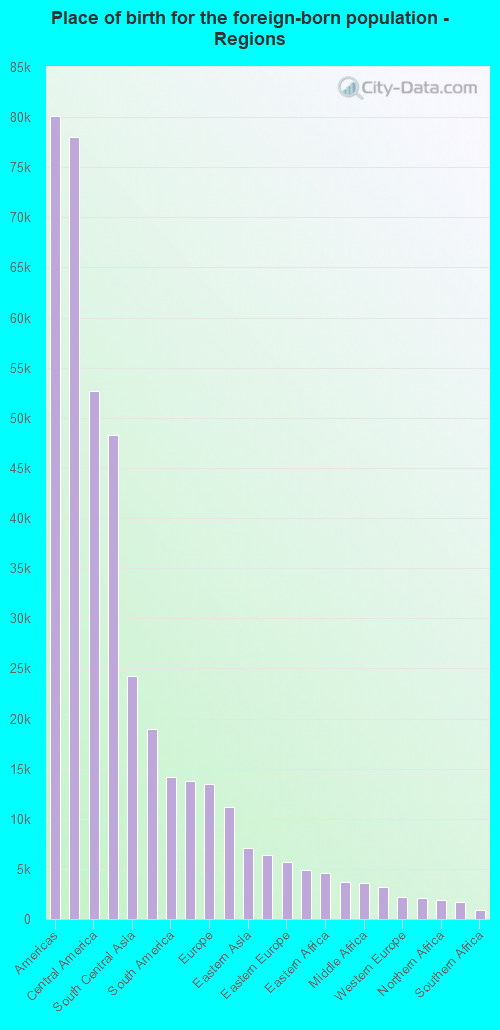
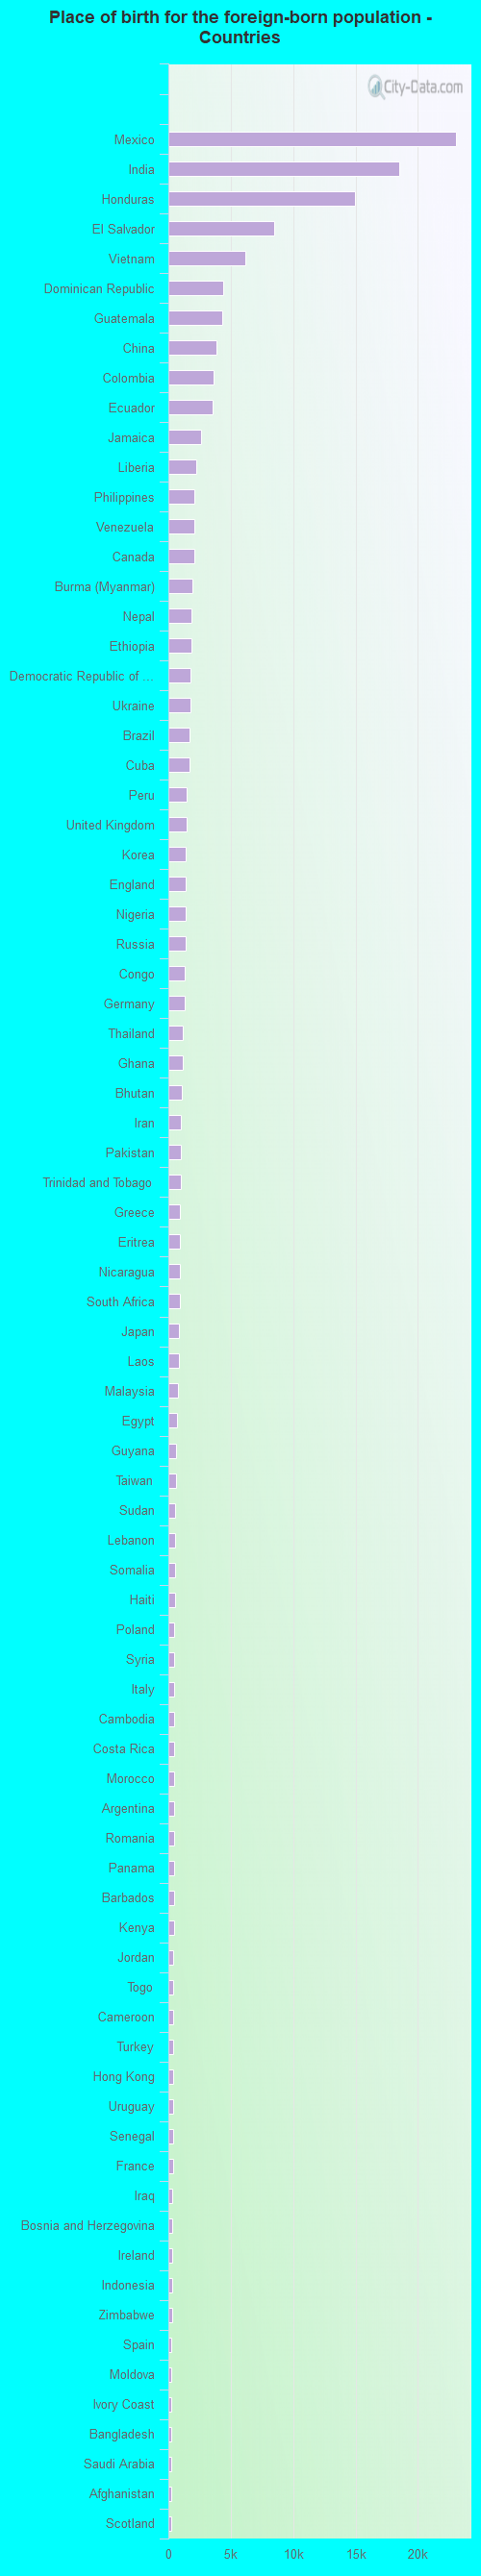
Place of birth for residents in Charlotte 80,133 Americas78,027 Latin America52,716 Central America48,302 Asia24,205 South Central Asia18,907 Africa14,184 South America13,737 South Eastern Asia13,440 Europe11,126 Caribbean7,122 Eastern Asia6,399 Western Africa5,726 Eastern Europe4,876 China4,576 Eastern Africa3,691 Northern Europe3,579 Middle Africa3,194 Western Asia2,200 Western Europe2,105 Northern America1,864 Northern Africa1,743 Southern Europe906 Southern Africa192 Oceania143 Australia and New Zealand Subregion23,051 Mexico18,513 India14,965 Honduras8,490 El Salvador6,153 Vietnam4,394 Dominican Republic4,327 Guatemala3,891 China3,656 Colombia3,541 Ecuador2,586 Jamaica2,203 Liberia2,060 Philippines2,052 Venezuela2,045 Canada1,920 Burma (Myanmar)1,871 Nepal1,865 Ethiopia1,807 Democratic Republic of Congo (Zaire)1,740 Ukraine1,713 Brazil1,688 Cuba1,502 Peru1,456 United Kingdom1,411 Korea1,403 England1,382 Nigeria1,349 Russia1,327 Congo1,304 Germany1,170 Thailand1,136 Ghana1,055 Bhutan1,033 Iran1,023 Pakistan1,001 Trinidad and Tobago944 Greece942 Eritrea914 Nicaragua903 South Africa834 Japan827 Laos768 Malaysia665 Egypt587 Guyana579 Taiwan570 Sudan558 Lebanon543 Somalia537 Haiti495 Poland475 Syria473 Italy468 Cambodia461 Costa Rica460 Morocco455 Argentina455 Romania452 Panama436 Barbados428 Kenya422 Jordan408 Togo408 Cameroon408 Turkey405 Hong Kong405 Uruguay403 Senegal386 France329 Iraq321 Bosnia and Herzegovina276 Ireland272 Indonesia271 Zimbabwe267 Spain241 Moldova239 Ivory Coast224 Bangladesh223 Saudi Arabia218 Afghanistan218 Scotland202 Kuwait179 Chile177 United Arab Emirates172 Bulgaria152 Austria151 Sierra Leone151 Netherlands151 Belarus147 Algeria145 Israel137 Belgium136 Azerbaijan122 Croatia111 Australia105 Sweden103 Sri Lanka102 Albania101 Cabo Verde96 Dominica94 Uganda91 Kazakhstan88 Czechoslovakia88 Singapore87 Hungary83 Denmark70 Latvia68 Switzerland63 Lithuania62 Tanzania62 Uzbekistan60 Georgia55 St. Lucia55 Bahamas52 Portugal52 Norway48 Fiji43 Serbia35 Belize31 New Zealand25 St. Vincent and the Grenadines22 Grenada16 Bolivia15 West Indies11 Armenia
Grandparents responsible for own grandchildren in Charlotte
Grandparents (30 to 59 years) White / Caucasian 346 59.3% Responsible for grandchildren237 40.7% Not responsible for grandchildrenBlack or African American 1,936 66.6% Responsible for grandchildren971 33.4% Not responsible for grandchildrenAmerican Indian / Alaska Native 51 100.0% Responsible for grandchildrenAsian 204 35.2% Responsible for grandchildren375 64.8% Not responsible for grandchildrenOther race 599 46.4% Responsible for grandchildren692 53.6% Not responsible for grandchildrenTwo or more races 593 62.8% Responsible for grandchildren351 37.2% Not responsible for grandchildrenWhite alone, not Hispanic / Latino 346 59.3% Responsible for grandchildren237 40.7% Not responsible for grandchildrenHispanic or Latino 624 54.3% Responsible for grandchildren525 45.7% Not responsible for grandchildrenGrandparents (60 years and over) White / Caucasian 276 15.3% Responsible for grandchildren1,525 84.7% Not responsible for grandchildrenBlack or African American 1,519 42.9% Responsible for grandchildren2,020 57.1% Not responsible for grandchildrenAmerican Indian / Alaska Native 14 22.5% Responsible for grandchildren49 77.5% Not responsible for grandchildrenAsian 46 6.0% Responsible for grandchildren724 94.0% Not responsible for grandchildrenOther race 36 8.3% Responsible for grandchildren404 91.7% Not responsible for grandchildrenTwo or more races 256 27.4% Responsible for grandchildren678 72.6% Not responsible for grandchildrenWhite alone, not Hispanic / Latino 276 16.3% Responsible for grandchildren1,414 83.7% Not responsible for grandchildrenHispanic or Latino 179 12.6% Responsible for grandchildren1,241 87.4% Not responsible for grandchildren
Zip codes: 28078 , 28105 , 28134 , 28202 , 28203 , 28204 , 28205 , 28206 , 28207 , 28208 , 28209 , 28210 , 28211 , 28212 , 28213 , 28214 , 28215 , 28216 , 28217 , 28226 , 28227 , 28244, 28262 , 28269 , 28270 , 28273 , 28277 , 28278 , 28280, 28282.