Races in Cherokee Village, Arkansas (AR) Detailed Stats
Ancestries, Foreign-born residents, place of birth

Data:
1.0% of Cherokee Village, AR residents are foreign-born , which is 304.2% less than the foreign-born rate of 4.0% across the entire state of Arkansas.
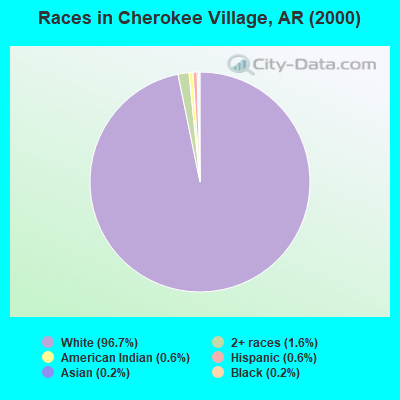
Race distribution in Cherokee Village

- 4,49596.7%White alone
- 731.6%Two or more races
- 290.6%Hispanic
- 300.6%American Indian alone
- 80.2%Black alone
- 110.2%Asian alone
- 10.02%Native Hawaiian and Other
Pacific Islander alone
- 10.02%Other race alone
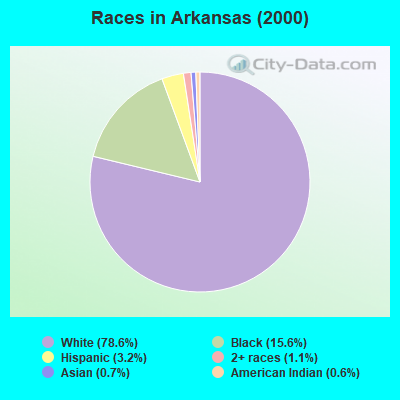
2000
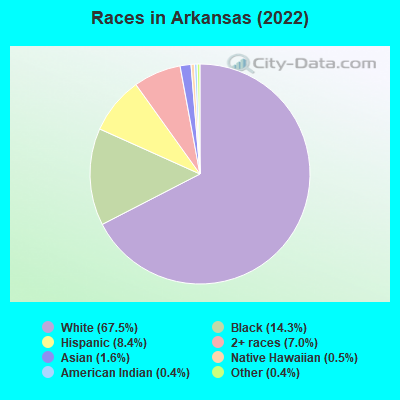
2022
-
- 2,100,13578.6%White alone
- 416,61515.6%Black alone
- 86,8663.2%Hispanic
- 30,3641.1%Two or more races
- 19,8920.7%Asian alone
- 16,7020.6%American Indian alone
- 1,4940.06%Native Hawaiian and Other
Pacific Islander alone
- 1,3320.05%Other race alone
-
- 2,054,92267.5%White alone
- 435,63714.3%Black alone
- 255,4168.4%Hispanic
- 213,6847.0%Two or more races
- 47,5921.6%Asian alone
- 14,1760.5%Native Hawaiian and Other
Pacific Islander alone
- 12,6800.4%American Indian alone
- 11,5300.4%Other race alone
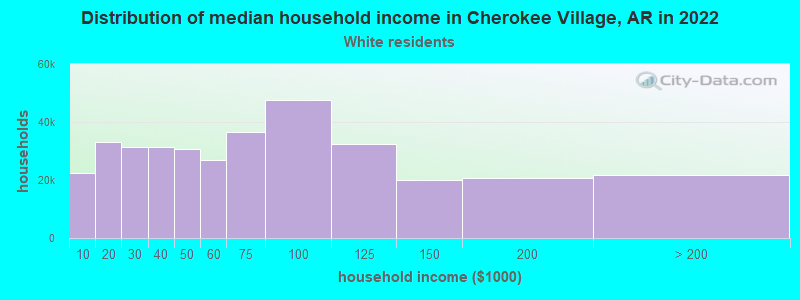
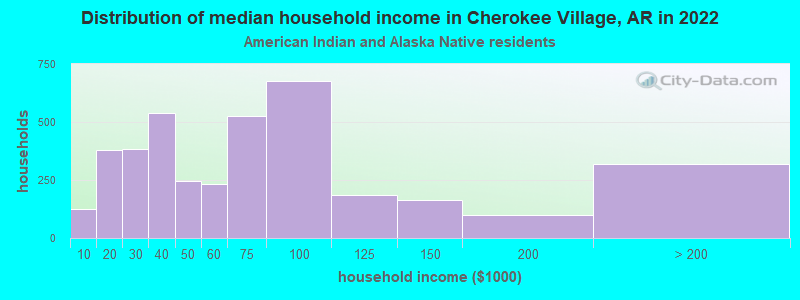
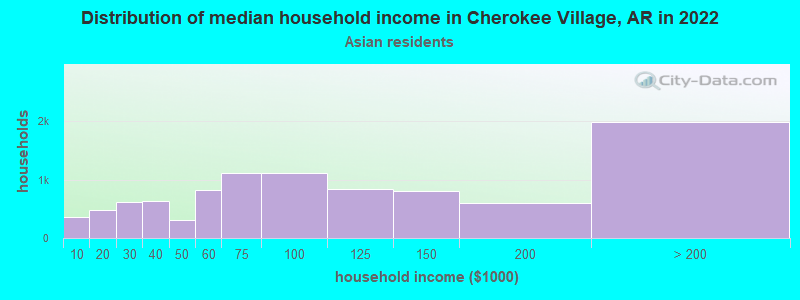
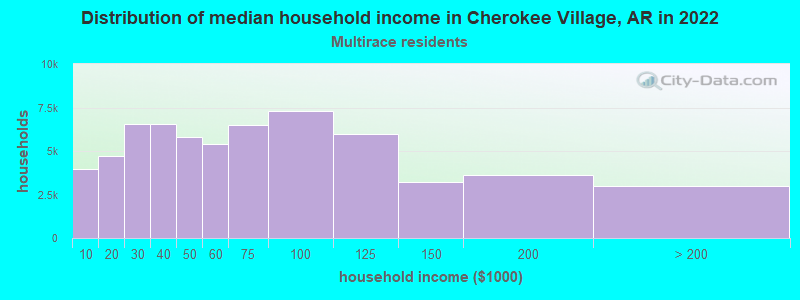
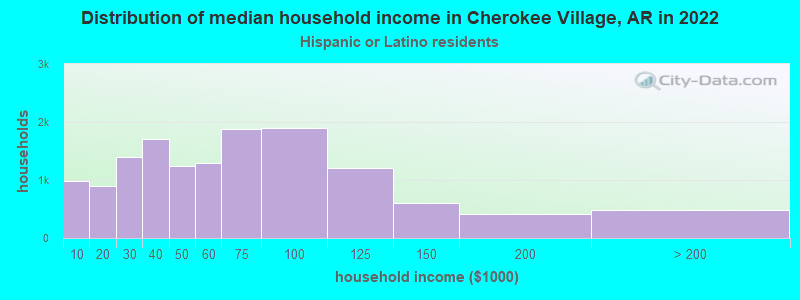
Income and house value in Cherokee Village
- Median household income in 2022
- $48,803White non-Hispanic householders
- $30,835American Indian and Alaska Native householders
- $50,252Asian householders
- $70,333Two or more races householders
- $21,967Hispanic or Latino race householders
- Median 2022 house value
- $156,591White Non-Hispanic householders
- $253,427American Indian or Alaska Native householders
- $140,585Two or more races householders
- $77,362Hispanic or Latino householders
Foreign-born residents in Cherokee Village
46 residents are foreign born
| This city: | 1.0% |
| Arkansas: | 2.8% |
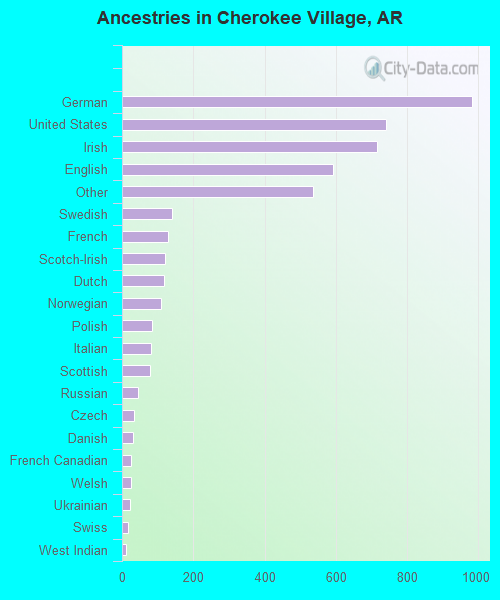
Ancestries in Cherokee Village

- 98121.2%German
- 74116.0%United States
- 71515.4%Irish
- 59212.8%English
- 53711.6%Other
- 1413.0%Swedish
- 1282.8%French
- 1202.6%Scotch-Irish
- 1172.5%Dutch
- 1092.4%Norwegian
- 831.8%Polish
- 821.8%Italian
- 781.7%Scottish
- 451.0%Russian
- 330.7%Czech
- 310.7%Danish
- 260.6%French Canadian
- 250.5%Welsh
- 220.5%Ukrainian
- 180.4%Swiss
- 100.2%West Indian