Races in Chittenden, Vermont (VT) Detailed Stats
Ancestries, Foreign-born residents, place of birth

Recent posts about races in Chittenden, Vermont on our local forum with over 2,400,000 registered users:
 | Southern Vermont Retirement Advice! Thank you! (22 replies) |
| Mountain Family considering moving from CO to VT (52 replies) |
| What's it like being a Republican living in Vermont? (47 replies) |
| If you moved to VT from another place, let us know what your experience was here (161 replies) |
| Vermont property taxes: beyond ridiculous! (422 replies) |
| CNBC - Vermont, best state to live in (69 replies) |
Latest news about races in Chittenden, VT collected exclusively by city-data.com from local newspapers, TV, and radio stations
2.5% of Chittenden, VT residents are foreign-born (2.1% born in Europe), which is 63.0% less than the foreign-born rate of 4.0% across the entire state of Vermont.
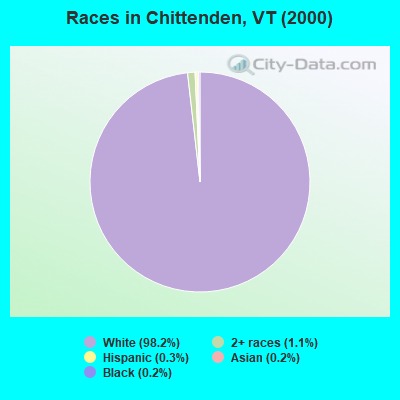
Race distribution in Chittenden

- 1,16198.2%White alone
- 131.1%Two or more races
- 30.3%Hispanic
- 20.2%Asian alone
- 20.2%Black alone
- 10.08%Native Hawaiian and Other
Pacific Islander alone
2000
2022
-
- 585,43196.2%White alone
- 6,8091.1%Two or more races
- 5,5040.9%Hispanic
- 5,1600.8%Asian alone
- 2,9210.5%Black alone
- 2,3250.4%American Indian alone
- 5570.09%Other race alone
- 1200.02%Native Hawaiian and Other
Pacific Islander alone

-
- 583,54690.2%White alone
- 27,3404.2%Two or more races
- 14,7702.3%Hispanic
- 11,5121.8%Asian alone
- 6,2641.0%Black alone
- 2,5210.4%Other race alone
- 1,0520.2%American Indian alone
- 590.01%Native Hawaiian and Other
Pacific Islander alone

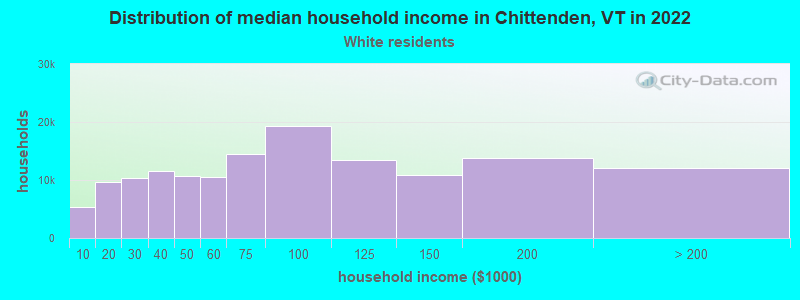
Income and house value in Chittenden
- Median household income in 2022
- $81,242White non-Hispanic householders
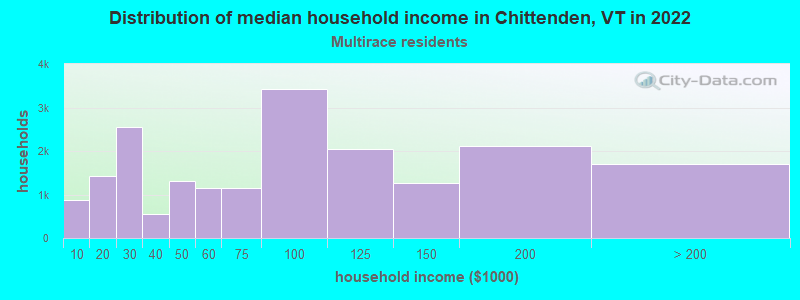
- $94,041Two or more races householders
- Median 2022 house value
- $292,734White Non-Hispanic householders
- $199,059Two or more races householders
Household income for White non-Hispanic householders
Household income for Two or more races householders
Foreign-born residents in Chittenden
29 residents are foreign born (2.1% Europe).
| This city: | 2.5% |
| Vermont: | 3.8% |
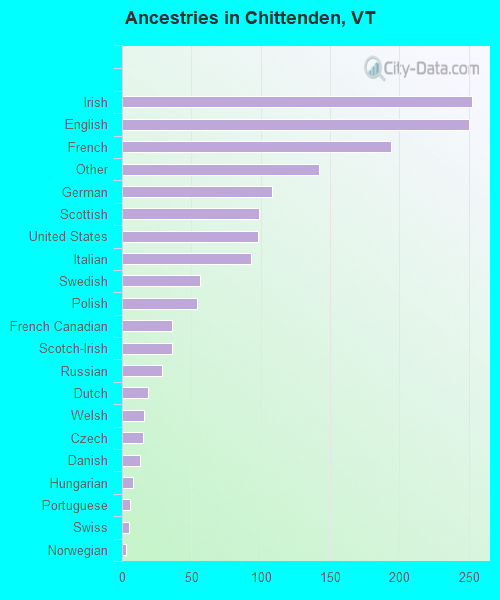
Ancestries in Chittenden

- 25216.4%Irish
- 25016.3%English
- 19412.6%French
- 1429.3%Other
- 1087.0%German
- 996.5%Scottish
- 986.4%United States
- 936.1%Italian
- 563.7%Swedish
- 543.5%Polish
- 362.3%French Canadian
- 362.3%Scotch-Irish
- 291.9%Russian
- 191.2%Dutch
- 161.0%Welsh
- 151.0%Czech
- 130.8%Danish
- 80.5%Hungarian
- 60.4%Portuguese
- 50.3%Swiss
- 30.2%Norwegian
- 20.1%Slovak
Zip codes: 05737.