Races in Claremont, California (CA) Detailed Stats
Data:
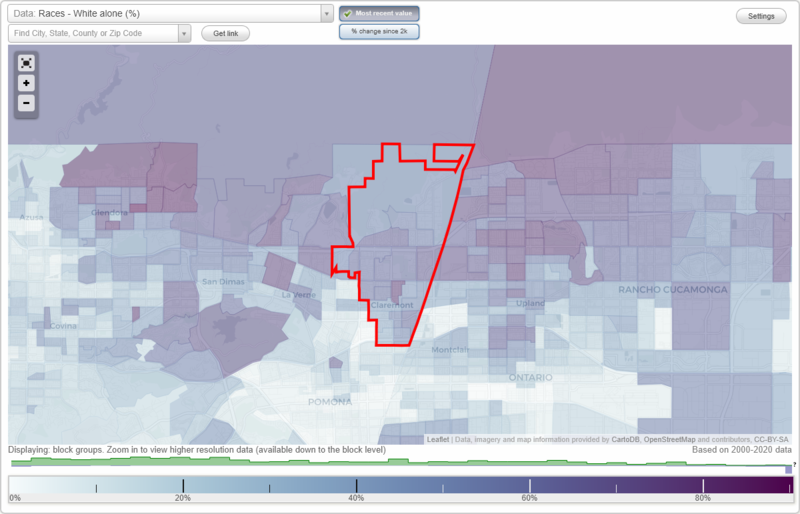
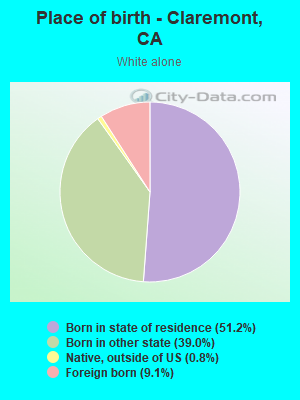
Races - White alone (%)
Races - White alone (% change since 2000)
Races - Black alone (%)
Races - Black alone (% change since 2000)
Races - American Indian alone (%)
Races - American Indian alone (% change since 2000)
Races - Asian alone (%)
Races - Asian alone (% change since 2000)
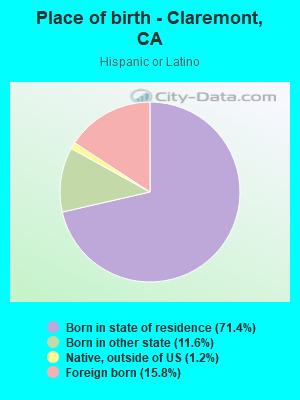
Races - Hispanic (%)
Races - Hispanic (% change since 2000)
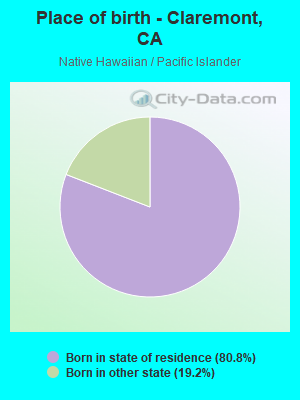
Races - Native Hawaiian and Other Pacific Islander alone (%)
Races - Native Hawaiian and Other Pacific Islander alone (% change since 2000)
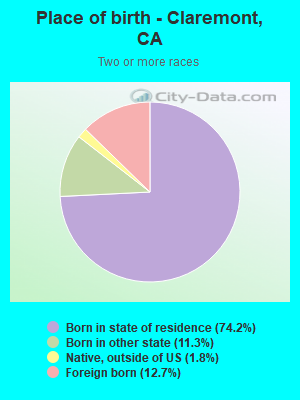
Races - Two or more races(%)
Races - Two or more races(% change since 2000)
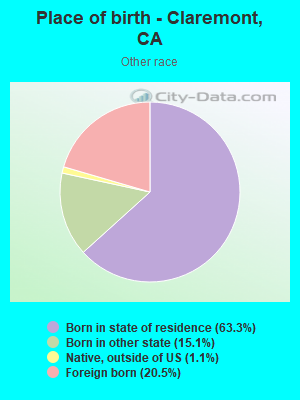
Races - Other race alone (%)
Races - Other race alone (% change since 2000)
Racial diversity
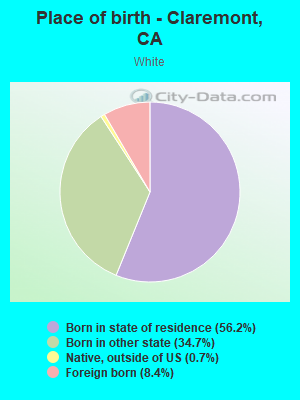
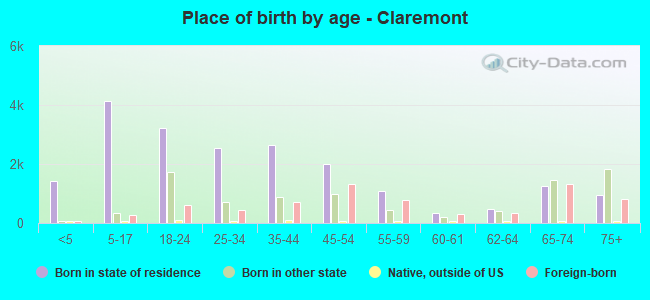
Place of birth - Born in state of residence (%)
Place of birth - Born in state of residence (%) - White
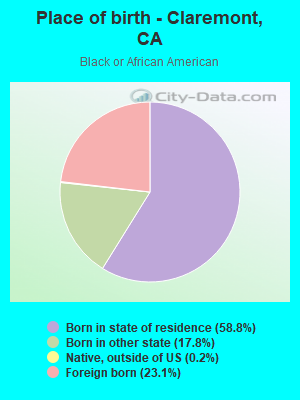
Place of birth - Born in state of residence (%) - Black or African American
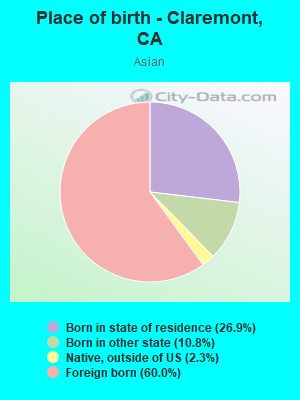
Place of birth - Born in state of residence (%) - Asian
Place of birth - Born in state of residence (%) - Hispanic or Latino
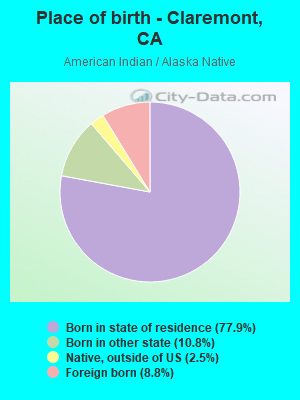
Place of birth - Born in state of residence (%) - American Indian and Alaska Native
Place of birth - Born in state of residence (%) - Multirace
Place of birth - Born in state of residence (%) - Other Race
Place of birth - Born in other state (%)
Place of birth - Born in other state (%) - White
Place of birth - Born in other state (%) - Black or African American
Place of birth - Born in other state (%) - Asian
Place of birth - Born in other state (%) - Hispanic or Latino
Place of birth - Born in other state (%) - American Indian and Alaska Native
Place of birth - Born in other state (%) - Multirace
Place of birth - Born in other state (%) - Other Race
Place of birth - Native, outside of US (%)
Place of birth - Native, outside of US (%) - White
Place of birth - Native, outside of US (%) - Black or African American
Place of birth - Native, outside of US (%) - Asian
Place of birth - Native, outside of US (%) - Hispanic or Latino
Place of birth - Native, outside of US (%) - American Indian and Alaska Native
Place of birth - Native, outside of US (%) - Multirace
Place of birth - Native, outside of US (%) - Other Race
Place of birth - Foreign born (%)
Place of birth - Foreign born (%) - White
Place of birth - Foreign born (%) - Black or African American
Place of birth - Foreign born (%) - Asian
Place of birth - Foreign born (%) - Hispanic or Latino
Place of birth - Foreign born (%) - American Indian and Alaska Native
Place of birth - Foreign born (%) - Multirace
Place of birth - Foreign born (%) - Other Race
Residents speaking English at home (%)
Residents speaking English at home - Born in the United States (%)
Residents speaking English at home - Native, born elsewhere (%)
Residents speaking English at home - Foreign born (%)
Residents speaking Spanish at home (%)
Residents speaking Spanish at home - Born in the United States (%)
Residents speaking Spanish at home - Native, born elsewhere (%)
Residents speaking Spanish at home - Foreign born (%)
Residents speaking other language at home (%)
Residents speaking other language at home - Born in the United States (%)
Residents speaking other language at home - Native, born elsewhere (%)
Residents speaking other language at home - Foreign born (%)
Marital status - Never married (%)
Marital status - Now married (%)
Marital status - Separated (%)
Marital status - Widowed (%)
Marital status - Divorced (%)
Ancestries Reported - Arab (%)
Ancestries Reported - Czech (%)
Ancestries Reported - Danish (%)
Ancestries Reported - Dutch (%)
Ancestries Reported - English (%)
Ancestries Reported - French (%)
Ancestries Reported - French Canadian (%)
Ancestries Reported - German (%)
Ancestries Reported - Greek (%)
Ancestries Reported - Hungarian (%)
Ancestries Reported - Irish (%)
Ancestries Reported - Italian (%)
Ancestries Reported - Lithuanian (%)
Ancestries Reported - Norwegian (%)
Ancestries Reported - Polish (%)
Ancestries Reported - Portuguese (%)
Ancestries Reported - Russian (%)
Ancestries Reported - Scotch-Irish (%)
Ancestries Reported - Scottish (%)
Ancestries Reported - Slovak (%)
Ancestries Reported - Subsaharan African (%)
Ancestries Reported - Swedish (%)
Ancestries Reported - Swiss (%)
Ancestries Reported - Ukrainian (%)
Ancestries Reported - United States (%)
Ancestries Reported - Welsh (%)
Ancestries Reported - West Indian (%)
Ancestries Reported - Other (%)
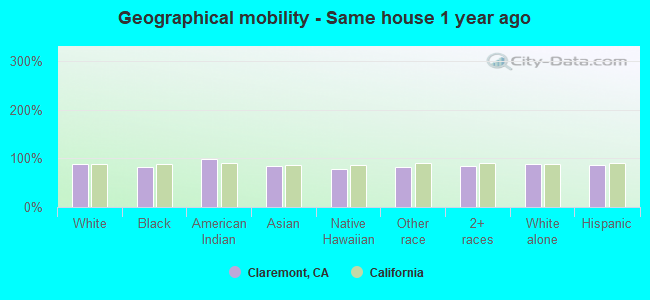
Geographical mobility - Same house 1 year ago (%)
Geographical mobility - Same house 1 year ago (%) - White
Geographical mobility - Same house 1 year ago (%) - Black or African American
Geographical mobility - Same house 1 year ago (%) - Asian
Geographical mobility - Same house 1 year ago (%) - Hispanic or Latino
Geographical mobility - Same house 1 year ago (%) - American Indian and Alaska Native
Geographical mobility - Same house 1 year ago (%) - Multirace
Geographical mobility - Same house 1 year ago (%) - Other Race
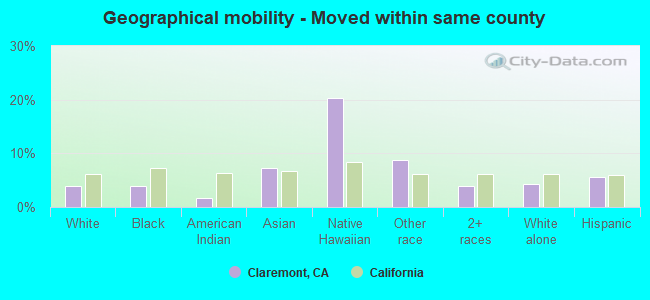
Geographical mobility - Moved within same county (%)
Geographical mobility - Moved within same county (%) - White
Geographical mobility - Moved within same county (%) - Black or African American
Geographical mobility - Moved within same county (%) - Asian
Geographical mobility - Moved within same county (%) - Hispanic or Latino
Geographical mobility - Moved within same county (%) - American Indian and Alaska Native
Geographical mobility - Moved within same county (%) - Multirace
Geographical mobility - Moved within same county (%) - Other Race
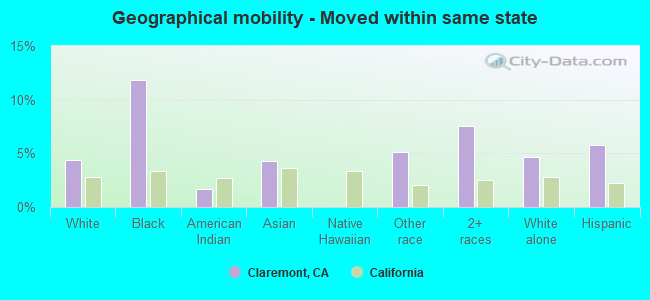
Geographical mobility - Moved from different county within same state (%)
Geographical mobility - Moved from different county within same state (%) - White
Geographical mobility - Moved from different county within same state (%) - Black or African American
Geographical mobility - Moved from different county within same state (%) - Asian
Geographical mobility - Moved from different county within same state (%) - Hispanic or Latino
Geographical mobility - Moved from different county within same state (%) - American Indian and Alaska Native
Geographical mobility - Moved from different county within same state (%) - Multirace
Geographical mobility - Moved from different county within same state (%) - Other Race
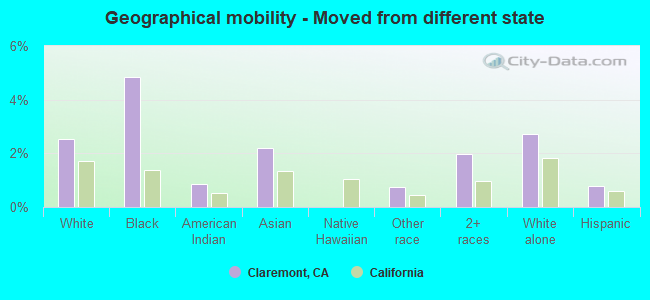
Geographical mobility - Moved from different state (%)
Geographical mobility - Moved from different state (%) - White
Geographical mobility - Moved from different state (%) - Black or African American
Geographical mobility - Moved from different state (%) - Asian
Geographical mobility - Moved from different state (%) - Hispanic or Latino
Geographical mobility - Moved from different state (%) - American Indian and Alaska Native
Geographical mobility - Moved from different state (%) - Multirace
Geographical mobility - Moved from different state (%) - Other Race
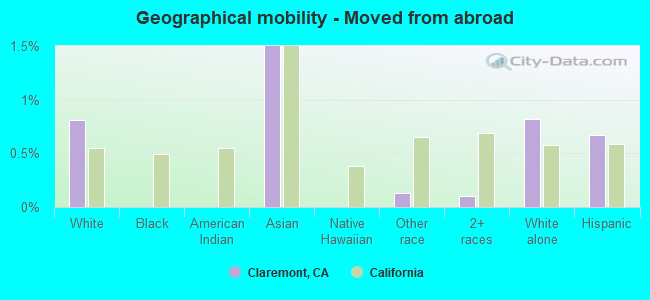
Geographical mobility - Moved from abroad (%)
Geographical mobility - Moved from abroad (%) - White
Geographical mobility - Moved from abroad (%) - Black or African American
Geographical mobility - Moved from abroad (%) - Asian
Geographical mobility - Moved from abroad (%) - Hispanic or Latino
Geographical mobility - Moved from abroad (%) - American Indian and Alaska Native
Geographical mobility - Moved from abroad (%) - Multirace
Geographical mobility - Moved from abroad (%) - Other Race
Place of birth for the foreign-born population - Ireland (%)
Place of birth for the foreign-born population - Denmark (%)
Place of birth for the foreign-born population - Norway (%)
Place of birth for the foreign-born population - Sweden (%)
Place of birth for the foreign-born population - United Kingdom (%)
Place of birth for the foreign-born population - England (%)
Place of birth for the foreign-born population - Scotland (%)
Place of birth for the foreign-born population - Other Northern Europe (%)
Place of birth for the foreign-born population - Austria (%)
Place of birth for the foreign-born population - Belgium (%)
Place of birth for the foreign-born population - France (%)
Place of birth for the foreign-born population - Germany (%)
Place of birth for the foreign-born population - Netherlands (%)
Place of birth for the foreign-born population - Switzerland (%)
Place of birth for the foreign-born population - Other Western Europe (%)
Place of birth for the foreign-born population - Greece (%)
Place of birth for the foreign-born population - Italy (%)
Place of birth for the foreign-born population - Portugal (%)
Place of birth for the foreign-born population - Spain (%)
Place of birth for the foreign-born population - Other Southern Europe (%)
Place of birth for the foreign-born population - Albania (%)
Place of birth for the foreign-born population - Belarus (%)
Place of birth for the foreign-born population - Bosnia and Herzegovina (%)
Place of birth for the foreign-born population - Bulgaria (%)
Place of birth for the foreign-born population - Croatia (%)
Place of birth for the foreign-born population - Czechoslovakia (%)
Place of birth for the foreign-born population - Hungary (%)
Place of birth for the foreign-born population - Latvia (%)
Place of birth for the foreign-born population - Lithuania (%)
Place of birth for the foreign-born population - North Macedonia (Macedonia) (%)
Place of birth for the foreign-born population - Moldova (%)
Place of birth for the foreign-born population - Poland (%)
Place of birth for the foreign-born population - Romania (%)
Place of birth for the foreign-born population - Russia (%)
Place of birth for the foreign-born population - Serbia (%)
Place of birth for the foreign-born population - Ukraine (%)
Place of birth for the foreign-born population - Other Eastern Europe (%)
Place of birth for the foreign-born population - China (%)
Place of birth for the foreign-born population - Hong Kong (%)
Place of birth for the foreign-born population - Taiwan (%)
Place of birth for the foreign-born population - Japan (%)
Place of birth for the foreign-born population - Korea (%)
Place of birth for the foreign-born population - Other Eastern Asia (%)
Place of birth for the foreign-born population - Afghanistan (%)
Place of birth for the foreign-born population - Bangladesh (%)
Place of birth for the foreign-born population - India (%)
Place of birth for the foreign-born population - Iran (%)
Place of birth for the foreign-born population - Kazakhstan (%)
Place of birth for the foreign-born population - Nepal (%)
Place of birth for the foreign-born population - Pakistan (%)
Place of birth for the foreign-born population - Sri Lanka (%)
Place of birth for the foreign-born population - Uzbekistan (%)
Place of birth for the foreign-born population - Other South Central Asia (%)
Place of birth for the foreign-born population - Burma (%)
Place of birth for the foreign-born population - Cambodia (%)
Place of birth for the foreign-born population - Indonesia (%)
Place of birth for the foreign-born population - Laos (%)
Place of birth for the foreign-born population - Malaysia (%)
Place of birth for the foreign-born population - Philippines (%)
Place of birth for the foreign-born population - Singapore (%)
Place of birth for the foreign-born population - Thailand (%)
Place of birth for the foreign-born population - Vietnam (%)
Place of birth for the foreign-born population - Other South Eastern Asia (%)
Place of birth for the foreign-born population - Armenia (%)
Place of birth for the foreign-born population - Iraq (%)
Place of birth for the foreign-born population - Israel (%)
Place of birth for the foreign-born population - Jordan (%)
Place of birth for the foreign-born population - Kuwait (%)
Place of birth for the foreign-born population - Lebanon (%)
Place of birth for the foreign-born population - Saudi Arabia (%)
Place of birth for the foreign-born population - Syria (%)
Place of birth for the foreign-born population - Turkey (%)
Place of birth for the foreign-born population - Yemen (%)
Place of birth for the foreign-born population - Other Western Asia (%)
Place of birth for the foreign-born population - Eritrea (%)
Place of birth for the foreign-born population - Ethiopia (%)
Place of birth for the foreign-born population - Kenya (%)
Place of birth for the foreign-born population - Somalia (%)
Place of birth for the foreign-born population - Uganda (%)
Place of birth for the foreign-born population - Zimbabwe (%)
Place of birth for the foreign-born population - Other Eastern Africa (%)
Place of birth for the foreign-born population - Cameroon (%)
Place of birth for the foreign-born population - Congo (%)
Place of birth for the foreign-born population - Democratic Republic of Congo (Zaire) (%)
Place of birth for the foreign-born population - Other Middle Africa (%)
Place of birth for the foreign-born population - Egypt (%)
Place of birth for the foreign-born population - Morocco (%)
Place of birth for the foreign-born population - Sudan (%)
Place of birth for the foreign-born population - Other Northern Africa (%)
Place of birth for the foreign-born population - South Africa (%)
Place of birth for the foreign-born population - Other Southern Africa (%)
Place of birth for the foreign-born population - Cabo Verde (%)
Place of birth for the foreign-born population - Ghana (%)
Place of birth for the foreign-born population - Liberia (%)
Place of birth for the foreign-born population - Nigeria (%)
Place of birth for the foreign-born population - Senegal (%)
Place of birth for the foreign-born population - Sierra Leone (%)
Place of birth for the foreign-born population - Other Western Africa (%)
Place of birth for the foreign-born population - Australia (%)
Place of birth for the foreign-born population - New Zealand (%)
Place of birth for the foreign-born population - Fiji (%)
Place of birth for the foreign-born population - Micronesia (%)
Place of birth for the foreign-born population - Bahamas (%)
Place of birth for the foreign-born population - Barbados (%)
Place of birth for the foreign-born population - Cuba (%)
Place of birth for the foreign-born population - Dominica (%)
Place of birth for the foreign-born population - Dominican Republic (%)
Place of birth for the foreign-born population - Grenada (%)
Place of birth for the foreign-born population - Haiti (%)
Place of birth for the foreign-born population - Jamaica (%)
Place of birth for the foreign-born population - St. Vincent and the Grenadines (%)
Place of birth for the foreign-born population - Trinidad and Tobago (%)
Place of birth for the foreign-born population - West Indies (%)
Place of birth for the foreign-born population - Other Caribbean (%)
Place of birth for the foreign-born population - Belize (%)
Place of birth for the foreign-born population - Costa Rica (%)
Place of birth for the foreign-born population - El Salvador (%)
Place of birth for the foreign-born population - Guatemala (%)
Place of birth for the foreign-born population - Honduras (%)
Place of birth for the foreign-born population - Mexico (%)
Place of birth for the foreign-born population - Nicaragua (%)
Place of birth for the foreign-born population - Panama (%)
Place of birth for the foreign-born population - Other Central America (%)
Place of birth for the foreign-born population - Argentina (%)
Place of birth for the foreign-born population - Bolivia (%)
Place of birth for the foreign-born population - Brazil (%)
Place of birth for the foreign-born population - Chile (%)
Place of birth for the foreign-born population - Colombia (%)
Place of birth for the foreign-born population - Ecuador (%)
Place of birth for the foreign-born population - Guyana (%)
Place of birth for the foreign-born population - Peru (%)
Place of birth for the foreign-born population - Uruguay (%)
Place of birth for the foreign-born population - Venezuela (%)
Place of birth for the foreign-born population - Other South America (%)
Place of birth for the foreign-born population - Canada (%)
Place of birth for the foreign-born population - Other Northern America (%)
Place of birth for the foreign-born population - Other (%)
Latest news about races in Claremont, CA collected exclusively by city-data.com from local newspapers, TV, and radio stations
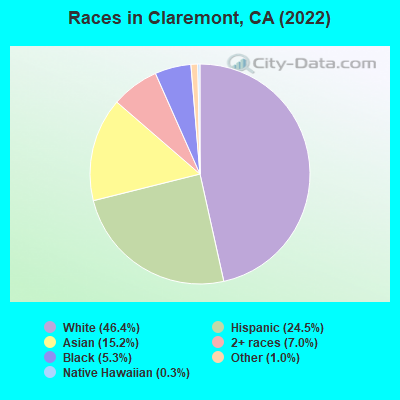
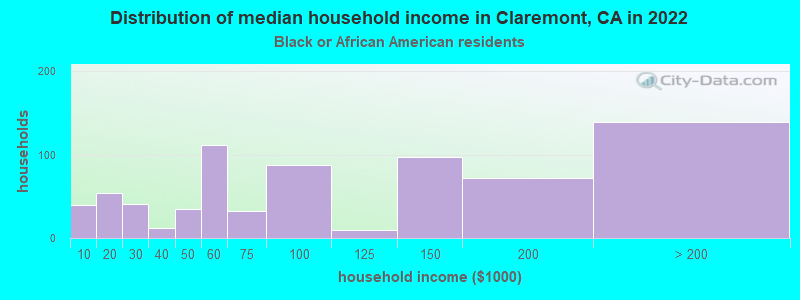
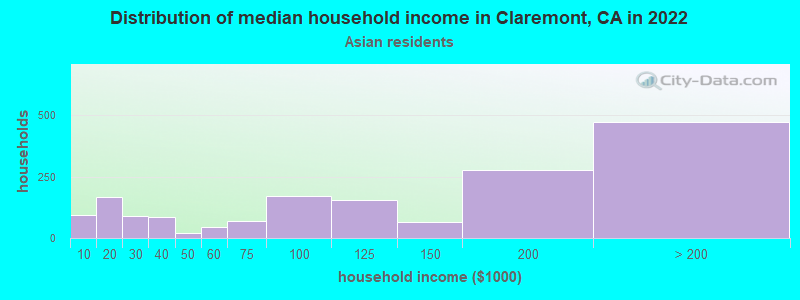
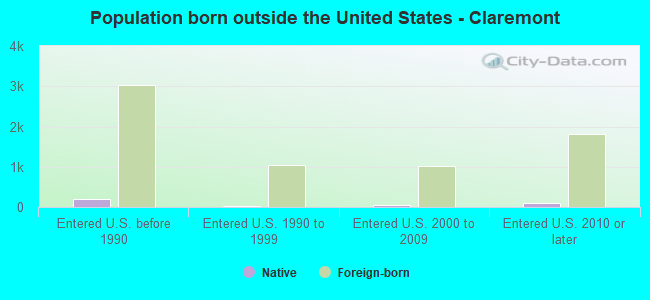
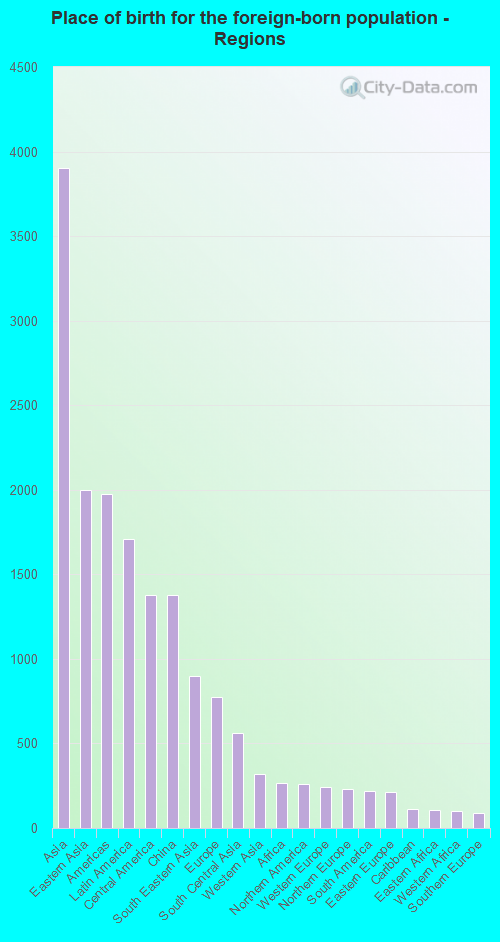
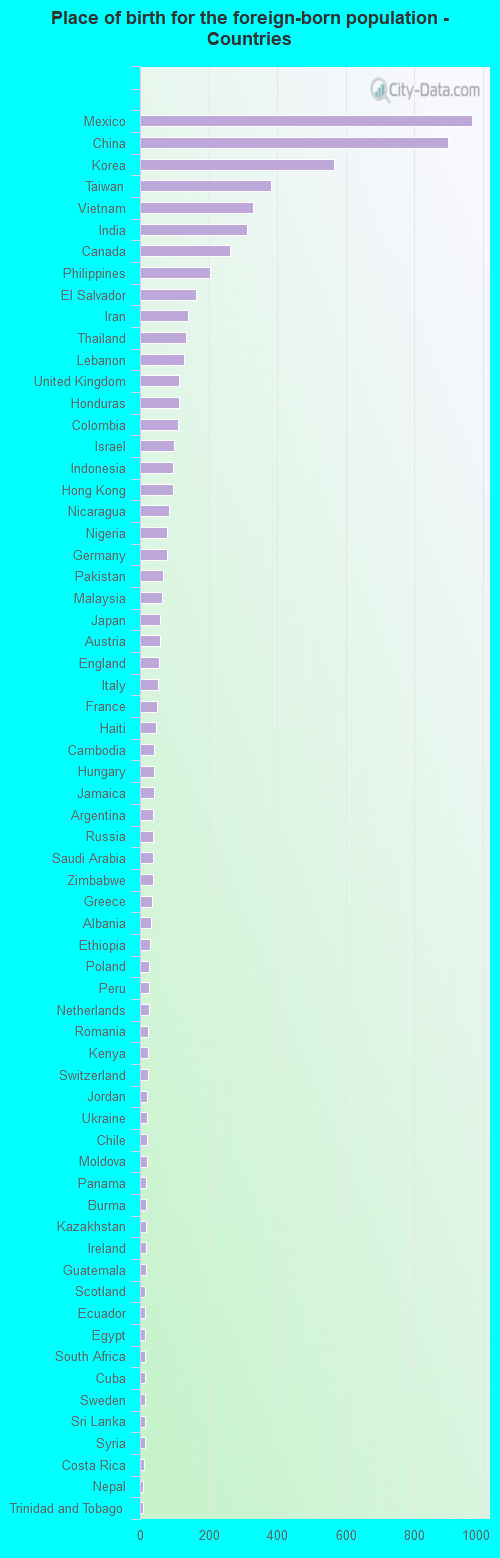
According to 2022 data, the most numerous races in Claremont, CA are Hispanic (9,319 residents), White alone (16,460 residents), and Asian alone (5,335 residents). 72.6% of Claremont residents speak English at home. 19.2% of Claremont, CA residents are foreign-born (10.7% born in Asia, 4.7% born in Latin America, 2.1% born in Europe), which is 35.2% less than the foreign-born rate of 26.0% across the entire state of California.
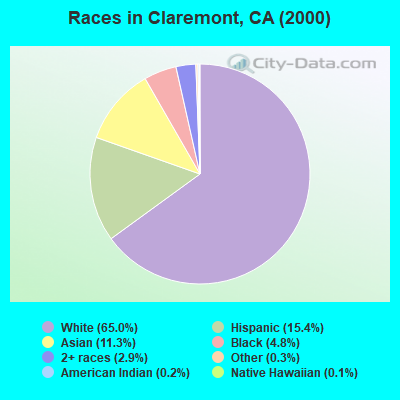
Race distribution in Claremont
2000 2022
15,816,790 46.7% White alone 10,966,556 32.4% Hispanic 3,648,860 10.8% Asian alone 2,181,926 6.4% Black alone 903,115 2.7% Two or more races 178,984 0.5% American Indian alone 103,736 0.3% Native Hawaiian and Other 71,681 0.2% Other race alone
15,732,184 40.3% Hispanic 13,160,426 33.7% White alone 5,957,867 15.3% Asian alone 2,025,218 5.2% Black alone 1,663,222 4.3% Two or more races 251,618 0.6% Other race alone 135,777 0.3% Native Hawaiian and Other 103,030 0.3% American Indian alone
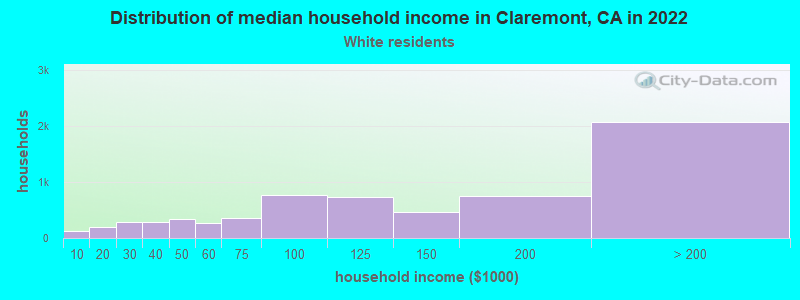
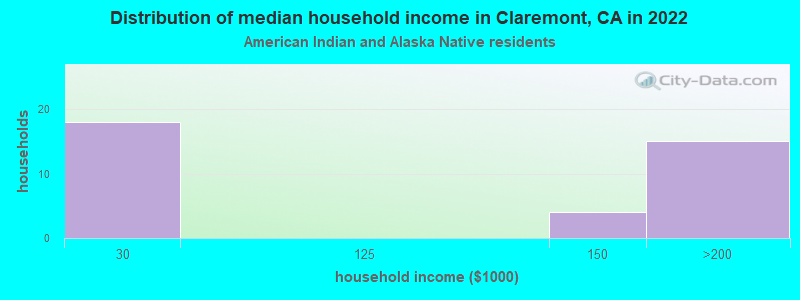
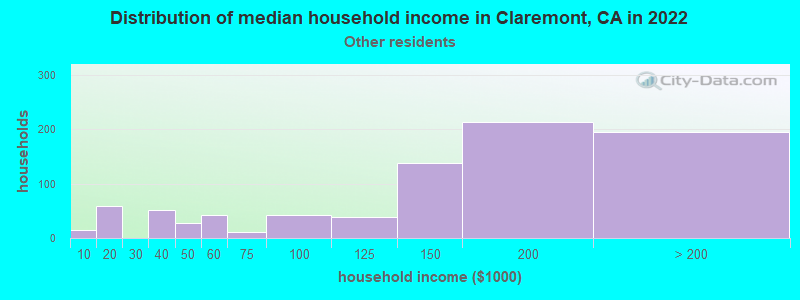
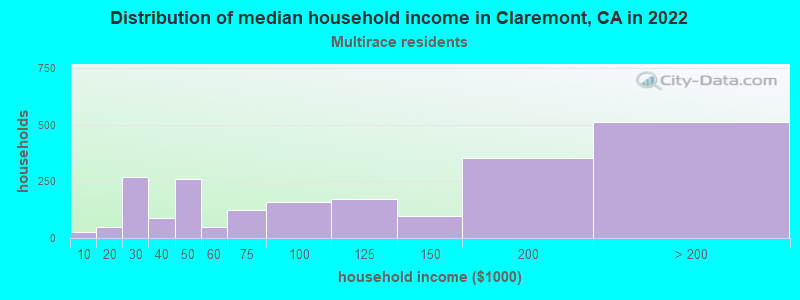
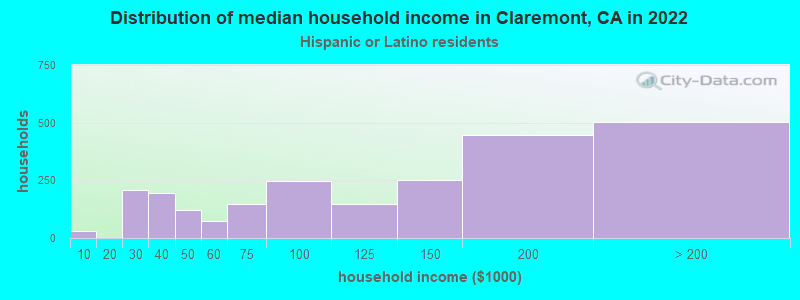
Income and house value in Claremont Median household income in 2022 $133,405 White non-Hispanic householders$86,338 Black householders$95,174 American Indian and Alaska Native householders$136,980 Asian householders$3,544 Native Hawaiian and other Pacific Islander householders$178,239 Some other race householders$107,857 Two or more races householders$125,890 Hispanic or Latino race householdersMedian 2022 house value $910,981 White Non-Hispanic householders$752,972 Black or African American householdersover $1,000,000 American Indian or Alaska Native householders $992,685 Asian householders$770,969 Some other race householders$995,565 Two or more races householders$774,568 Hispanic or Latino householders
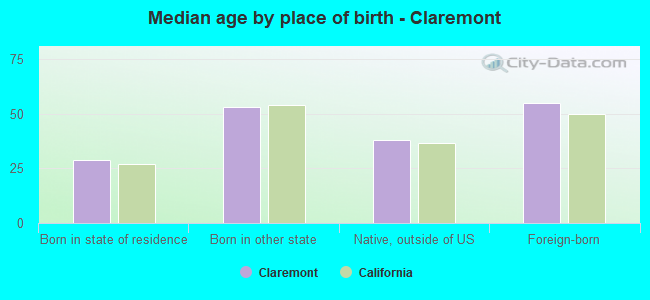
Median age by race in Claremont
46.9 Median age for White residents44.4 48.8 35.5 Median age for Black or African American residents34.5 39.6 45.9 Median age for American Indian / Alaska Native residents46.1 31.6 39.5 Median age for Asian residents39.3 40.0 24.0 Median age for Native Hawaiian / Pacific Islander residents35.4 Median age for Other race residents35.9 35.3 26.2 Median age for Two or more races residents22.7 30.8 49.2 Median age for White alone residents48.0 50.0 32.8 Median age for Hispanic or Latino residents30.7 36.0
Owner/renter occupied households by race in Claremont
House owners and renters - White residents 4,945 66.7% Owner occupied2,466 33.3% Renter occupiedHouse owners and renters - Black or African American residents 257 49.2% Owner occupied265 50.8% Renter occupiedHouse owners and renters - American Indian / Alaska Native residents 79 65.2% Owner occupied42 34.8% Renter occupiedHouse owners and renters - Asian residents 1,213 76.2% Owner occupied379 23.8% Renter occupiedHouse owners and renters - Native Hawaiian / Pacific Islander residents 4 100.0% Renter occupiedHouse owners and renters - Other race residents 382 44.8% Owner occupied471 55.2% Renter occupiedHouse owners and renters - Two or more races residents 1,138 66.8% Owner occupied565 33.2% Renter occupiedHouse owners and renters - White alone residents 4,310 64.6% Owner occupied2,359 35.4% Renter occupiedHouse owners and renters - Hispanic or Latino residents 1,512 61.9% Owner occupied929 38.1% Renter occupied
Language usage in Claremont
English speakers - Total 72.6% of residents of Claremont speak English at home.
12.7% of residents speak Spanish at home 3,416 77.4% Speak English very well995 22.6% Speak English less than very well15.2% of residents speak other language at home 3,733 70.8% Speak English very well1,538 29.2% Speak English less than very well
English speakers - Born in the United States 90.5% of residents of Claremont speak English at home.
5.1% of residents speak Spanish at home 434 96.0% Speak English very well18 4.0% Speak English less than very well4.5% of residents speak other language at home 392 96.6% Speak English very well14 3.4% Speak English less than very well
English speakers - Native, born elsewhere 71.1% of residents of Claremont speak English at home.
16.3% of residents speak Spanish at home 32 48.5% Speak English very well34 51.5% Speak English less than very well12.3% of residents speak other language at home 39 78.0% Speak English very well11 22.0% Speak English less than very well
English speakers - Foreign-born 26.2% of residents of Claremont speak English at home.
20.4% of residents speak Spanish at home 835 60.6% Speak English very well544 39.4% Speak English less than very well56.6% of residents speak other language at home 2,353 61.6% Speak English very well1,467 38.4% Speak English less than very well
White (Caucasian) - Speak only English Native:
92.2% (15,664)Foreign-born:
43.2% (703)
White (Caucasian) - Speak another language Native:
9.1% (1,542)Foreign-born:
63.5% (1,033)
Black or African American - Speak only English Native:
93.2% (1,260)Foreign-born:
41.1% (182)
Black or African American - Speak another language Native:
7.3% (98)Foreign-born:
57.3% (254)
American Indian / Alaska Native - Speak only English Native:
69.1% (300)Foreign-born:
100.0% (42)
Asian - Speak only English Native:
61.8% (1,294)Foreign-born:
16.8% (541)
Asian - Speak another language Native:
38.5% (805)Foreign-born:
83.8% (2,706)
Other race - Speak only English Native:
65.2% (1,644)Foreign-born:
16.3% (108)
Other race - Speak another language Native:
39.9% (1,005)Foreign-born:
86.6% (573)
Two or more races - Speak only English Native:
66.7% (3,809)Foreign-born:
16.6% (151)
Two or more races - Speak another language Native:
28.3% (1,618)Foreign-born:
76.7% (698)
White alone - Speak only English Native:
95.7% (13,798)Foreign-born:
46.3% (702)
White alone - Speak another language Native:
4.3% (618)Foreign-born:
52.5% (796)
Hispanic or Latino - Speak only English Native:
65.5% (4,964)Foreign-born:
15.6% (227)
Hispanic or Latino - Speak another language Native:
36.7% (2,779)Foreign-born:
86.6% (1,261)
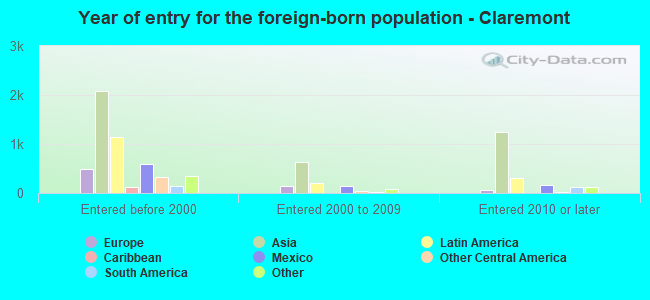
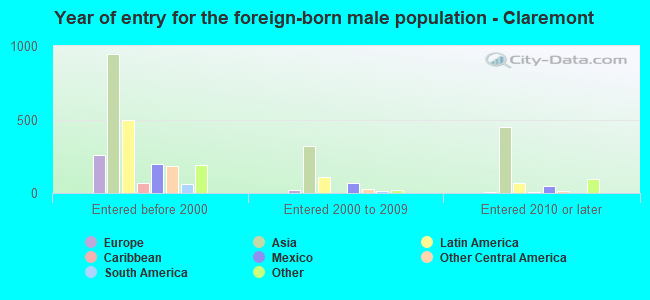
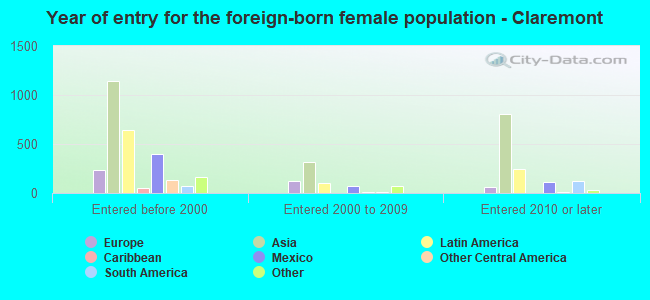
Foreign-born residents in Claremont 6,923 residents are foreign born (10.7% Asia , 4.7% Latin America , 2.1% Europe ).
This city:
19.2%California:
100.0%
Marital status for residents in Claremont Marital status - White (Caucasian) population 15 years and over
Males 37.4% Never married50.9% Now married1.4% Separated2.1% Widowed8.3% DivorcedFemales 33.1% Never married46.5% Now married1.7% Separated9.2% Widowed9.5% DivorcedWomen who gave birth in the past 12 months Now married:
86.6% (76)Unmarried:
13.4% (12)
Women who did not give birth in the past 12 months Now married:
37.7% (1,462)Unmarried:
62.3% (2,412)
Marital status - Black or African American population 15 years and over
Males 51.1% Never married35.5% Now married2.8% Separated5.5% Widowed5.1% DivorcedFemales 46.9% Never married29.5% Now married1.4% Separated6.4% Widowed15.9% DivorcedWomen who did not give birth in the past 12 months Now married:
16.0% (60)Unmarried:
84.0% (315)
Marital status - American Indian / Alaska Native population 15 years and over
Males 19.6% Never married52.0% Now married11.5% Separated0.0% Widowed16.9% DivorcedFemales 43.0% Never married33.3% Now married5.5% Separated0.0% Widowed18.2% DivorcedWomen who did not give birth in the past 12 months Now married:
27.6% (39)Unmarried:
72.4% (103)
Marital status - Asian population 15 years and over
Males 43.4% Never married53.1% Now married0.0% Separated1.5% Widowed2.0% DivorcedFemales 41.2% Never married41.4% Now married0.8% Separated7.1% Widowed9.5% DivorcedWomen who gave birth in the past 12 months Now married:
100.0% (6)Unmarried:
0.0% (0)
Women who did not give birth in the past 12 months Now married:
33.4% (577)Unmarried:
66.6% (1,151)
Marital status - Native Hawaiian / Pacific Islander population 15 years and over
Males 100.0% Never married0.0% Now married0.0% Separated0.0% Widowed0.0% DivorcedFemales 100.0% Never married0.0% Now married0.0% Separated0.0% Widowed0.0% DivorcedWomen who did not give birth in the past 12 months Now married:
0.0% (0)Unmarried:
100.0% (4)
Marital status - Other race population 15 years and over
Males 36.0% Never married63.7% Now married0.0% Separated0.3% Widowed0.0% DivorcedFemales 41.8% Never married51.1% Now married0.9% Separated1.9% Widowed4.3% DivorcedWomen who gave birth in the past 12 months Now married:
0.0% (0)Unmarried:
100.0% (87)
Women who did not give birth in the past 12 months Now married:
49.0% (529)Unmarried:
51.0% (551)
Marital status - Two or more races population 15 years and over
Males 63.5% Never married33.2% Now married0.0% Separated0.0% Widowed3.3% DivorcedFemales 49.3% Never married26.2% Now married0.0% Separated10.8% Widowed13.8% DivorcedWomen who gave birth in the past 12 months Now married:
100.0% (85)Unmarried:
0.0% (0)
Women who did not give birth in the past 12 months Now married:
26.0% (562)Unmarried:
74.0% (1,597)
Marital status - White alone, not Hispanic / Latino population 15 years and over
Males 35.3% Never married52.7% Now married1.5% Separated2.6% Widowed7.9% DivorcedFemales 30.4% Never married48.2% Now married2.1% Separated10.0% Widowed9.3% DivorcedWomen who gave birth in the past 12 months Now married:
100.0% (51)Unmarried:
0.0% (0)
Women who did not give birth in the past 12 months Now married:
40.3% (1,367)Unmarried:
59.7% (2,021)
Marital status - Hispanic or Latino population 15 years and over
Males 45.3% Never married48.0% Now married0.6% Separated0.1% Widowed6.1% DivorcedFemales 44.7% Never married41.9% Now married0.6% Separated4.4% Widowed8.4% DivorcedWomen who gave birth in the past 12 months Now married:
29.9% (41)Unmarried:
70.1% (96)
Women who did not give birth in the past 12 months Now married:
35.6% (861)Unmarried:
64.4% (1,554)
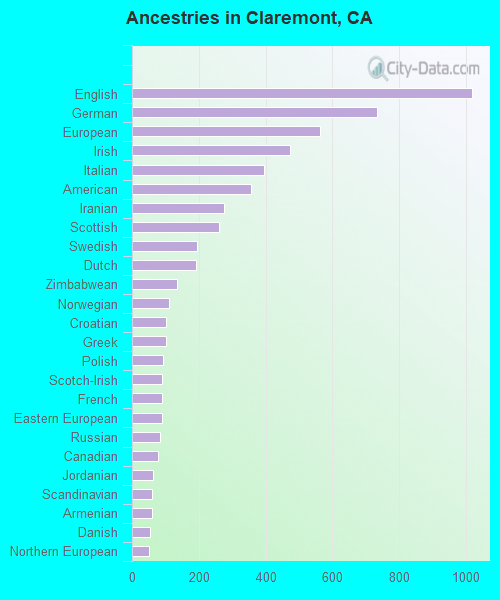
Ancestries in Claremont
885 5.0% English687 3.9% German668 3.8% European548 3.1% American462 2.6% Irish459 2.6% Italian217 1.2% Lebanese198 1.1% Northern European195 1.1% Polish186 1.1% Scottish173 1.0% Swedish164 0.9% Eastern European161 0.9% Dutch148 0.8% Nigerian115 0.7% Russian109 0.6% Iranian101 0.6% Palestinian91 0.5% Ethiopian89 0.5% Jordanian85 0.5% French84 0.5% Greek82 0.5% Canadian79 0.4% Hungarian79 0.4% Scotch-Irish76 0.4% Swiss70 0.4% African64 0.4% Norwegian57 0.3% Arab51 0.3% Welsh51 0.3% Jamaican49 0.3% Pennsylvania German47 0.3% French Canadian45 0.3% Armenian40 0.2% Romanian40 0.2% Albanian37 0.2% Croatian34 0.2% Zimbabwean30 0.2% British25 0.1% Slovak24 0.1% Scandinavian24 0.1% Haitian16 0.09% Basque15 0.09% Czech14 0.08% Lithuanian12 0.07% Turkish11 0.06% Portuguese10 0.06% Egyptian10 0.06% South African10 0.06% Trinidadian and Tobagonian9 0.05% Czechoslovakian8 0.05% Ukrainian7 0.04% Syrian6 0.03% Danish6 0.03% Brazilian4 0.02% Yugoslavian3 0.02% Kenyan3 0.02% Serbian2 0.01% Guyanese2 0.01% Bulgarian
Geographical mobility in Claremont Same house 1 year ago 16,651 88.4% White (Caucasian)1,506 81.6% Black or African American501 98.1% American Indian / Alaska Native4,525 83.9% Asian14 77.8% Native Hawaiian / Pacific Islander2,637 82.1% Other race5,967 85.1% Two or more races14,685 87.8% White alone, not Hispanic / Latino8,023 87.3% Hispanic or LatinoMoved within same county 742 3.9% White / Caucasian73 3.9% Black or African American8 1.6% American Indian / Alaska Native391 7.3% Asian4 20.3% Native Hawaiian / Pacific Islander280 8.7% Other race272 3.9% Two or more races702 4.2% White alone, not Hispanic / Latino510 5.5% Hispanic or LatinoMoved within same state 817 4.3% White / Caucasian217 11.8% Black or African American8 1.6% American Indian / Alaska Native229 4.3% Asian164 5.1% Other race526 7.5% Two or more races782 4.7% White alone, not Hispanic / Latino531 5.8% Hispanic or LatinoMoved from different state 474 2.5% White / Caucasian89 4.8% Black or African American4 0.9% American Indian / Alaska Native119 2.2% Asian23 0.7% Other race139 2.0% Two or more races455 2.7% White alone, not Hispanic / Latino71 0.8% Hispanic or LatinoMoved from abroad 152 0.8% White92 1.7% Asian4 0.1% Other race7 0.1% Two or more races137 0.8% White alone, not Hispanic / Latino62 0.7% Hispanic or Latino
Children Nativity (place of birth) in Claremont
Children under 6 years - Living with two parents Both parents native 858 100.0% Native0 0.0% Foreign-bornBoth parents foreign-born 38 69.8% Native17 30.2% Foreign-bornOne native, one foreign-born parent 338 100.0% NativeChildren under 6 years - Living with one parent Native parent 412 100.0% NativeForeign-born parent 19 100.0% NativeChildren 6 to 17 years - Living with two parents Both parents native 1,916 100.0% NativeBoth parents foreign-born 416 77.1% Native123 22.9% Foreign-bornOne native, one foreign-born parent 709 100.0% NativeChildren 6 to 17 years - Living with one parent Native parent 665 100.0% NativeForeign-born parent 267 56.4% Native206 43.6% Foreign-born
Place of birth for residents in Claremont
Grandparents responsible for own grandchildren in Claremont
Grandparents (30 to 59 years) White / Caucasian 19 79.2% Responsible for grandchildren5 20.8% Not responsible for grandchildrenAsian 8 100.0% Not responsible for grandchildrenOther race 92 100.0% Responsible for grandchildrenWhite alone, not Hispanic / Latino 13 73.3% Responsible for grandchildren5 26.7% Not responsible for grandchildrenHispanic or Latino 85 100.0% Responsible for grandchildrenGrandparents (60 years and over) White / Caucasian 35 11.7% Responsible for grandchildren263 88.3% Not responsible for grandchildrenAsian 104 100.0% Not responsible for grandchildrenOther race 24 100.0% Responsible for grandchildrenWhite alone, not Hispanic / Latino 43 19.3% Responsible for grandchildren178 80.7% Not responsible for grandchildrenHispanic or Latino 21 10.8% Responsible for grandchildren172 89.2% Not responsible for grandchildren