Races in Coalinga, California (CA) Detailed Stats
Data:
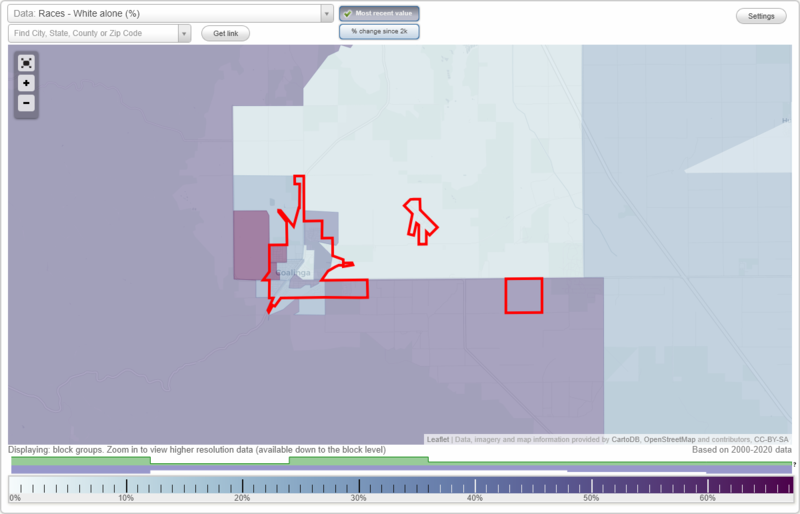
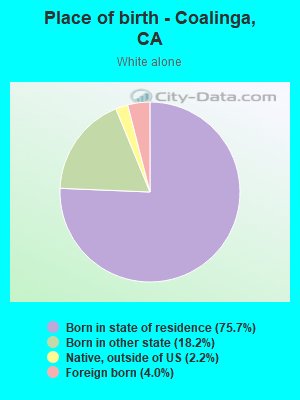
Races - White alone (%)
Races - White alone (% change since 2000)
Races - Black alone (%)
Races - Black alone (% change since 2000)
Races - American Indian alone (%)
Races - American Indian alone (% change since 2000)
Races - Asian alone (%)
Races - Asian alone (% change since 2000)
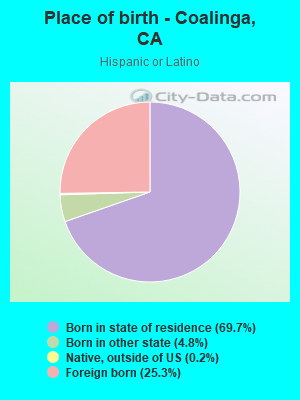
Races - Hispanic (%)
Races - Hispanic (% change since 2000)
Races - Native Hawaiian and Other Pacific Islander alone (%)
Races - Native Hawaiian and Other Pacific Islander alone (% change since 2000)
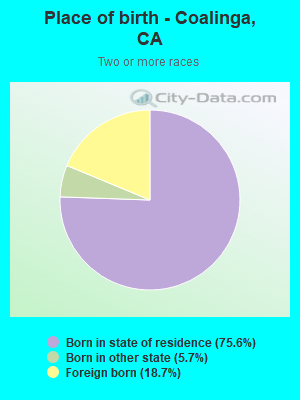
Races - Two or more races(%)
Races - Two or more races(% change since 2000)
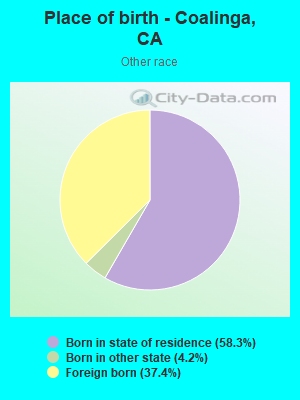
Races - Other race alone (%)
Races - Other race alone (% change since 2000)
Racial diversity
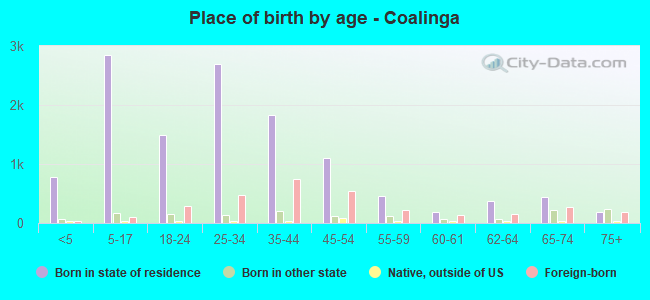
Place of birth - Born in state of residence (%)
Place of birth - Born in state of residence (%) - White
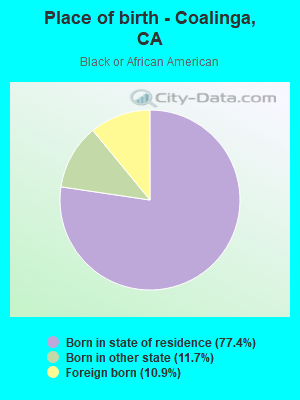
Place of birth - Born in state of residence (%) - Black or African American
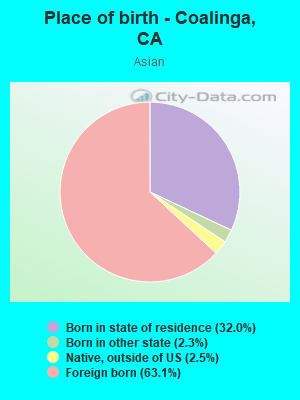
Place of birth - Born in state of residence (%) - Asian
Place of birth - Born in state of residence (%) - Hispanic or Latino
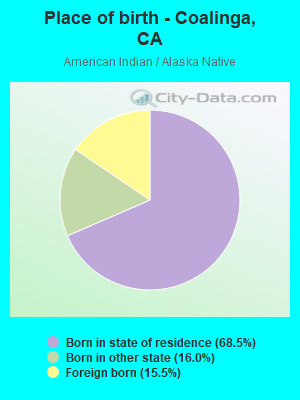
Place of birth - Born in state of residence (%) - American Indian and Alaska Native
Place of birth - Born in state of residence (%) - Multirace
Place of birth - Born in state of residence (%) - Other Race
Place of birth - Born in other state (%)
Place of birth - Born in other state (%) - White
Place of birth - Born in other state (%) - Black or African American
Place of birth - Born in other state (%) - Asian
Place of birth - Born in other state (%) - Hispanic or Latino
Place of birth - Born in other state (%) - American Indian and Alaska Native
Place of birth - Born in other state (%) - Multirace
Place of birth - Born in other state (%) - Other Race
Place of birth - Native, outside of US (%)
Place of birth - Native, outside of US (%) - White
Place of birth - Native, outside of US (%) - Black or African American
Place of birth - Native, outside of US (%) - Asian
Place of birth - Native, outside of US (%) - Hispanic or Latino
Place of birth - Native, outside of US (%) - American Indian and Alaska Native
Place of birth - Native, outside of US (%) - Multirace
Place of birth - Native, outside of US (%) - Other Race
Place of birth - Foreign born (%)
Place of birth - Foreign born (%) - White
Place of birth - Foreign born (%) - Black or African American
Place of birth - Foreign born (%) - Asian
Place of birth - Foreign born (%) - Hispanic or Latino
Place of birth - Foreign born (%) - American Indian and Alaska Native
Place of birth - Foreign born (%) - Multirace
Place of birth - Foreign born (%) - Other Race
Residents speaking English at home (%)
Residents speaking English at home - Born in the United States (%)
Residents speaking English at home - Native, born elsewhere (%)
Residents speaking English at home - Foreign born (%)
Residents speaking Spanish at home (%)
Residents speaking Spanish at home - Born in the United States (%)
Residents speaking Spanish at home - Native, born elsewhere (%)
Residents speaking Spanish at home - Foreign born (%)
Residents speaking other language at home (%)
Residents speaking other language at home - Born in the United States (%)
Residents speaking other language at home - Native, born elsewhere (%)
Residents speaking other language at home - Foreign born (%)
Marital status - Never married (%)
Marital status - Now married (%)
Marital status - Separated (%)
Marital status - Widowed (%)
Marital status - Divorced (%)
Ancestries Reported - Arab (%)
Ancestries Reported - Czech (%)
Ancestries Reported - Danish (%)
Ancestries Reported - Dutch (%)
Ancestries Reported - English (%)
Ancestries Reported - French (%)
Ancestries Reported - French Canadian (%)
Ancestries Reported - German (%)
Ancestries Reported - Greek (%)
Ancestries Reported - Hungarian (%)
Ancestries Reported - Irish (%)
Ancestries Reported - Italian (%)
Ancestries Reported - Lithuanian (%)
Ancestries Reported - Norwegian (%)
Ancestries Reported - Polish (%)
Ancestries Reported - Portuguese (%)
Ancestries Reported - Russian (%)
Ancestries Reported - Scotch-Irish (%)
Ancestries Reported - Scottish (%)
Ancestries Reported - Slovak (%)
Ancestries Reported - Subsaharan African (%)
Ancestries Reported - Swedish (%)
Ancestries Reported - Swiss (%)
Ancestries Reported - Ukrainian (%)
Ancestries Reported - United States (%)
Ancestries Reported - Welsh (%)
Ancestries Reported - West Indian (%)
Ancestries Reported - Other (%)
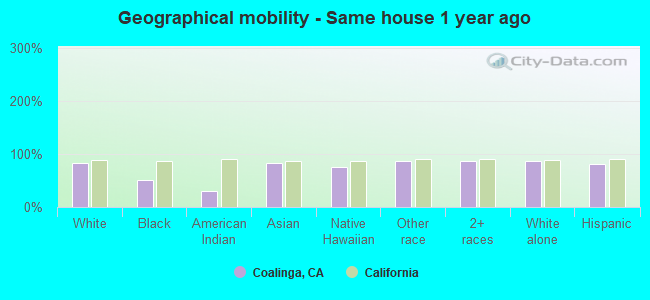
Geographical mobility - Same house 1 year ago (%)
Geographical mobility - Same house 1 year ago (%) - White
Geographical mobility - Same house 1 year ago (%) - Black or African American
Geographical mobility - Same house 1 year ago (%) - Asian
Geographical mobility - Same house 1 year ago (%) - Hispanic or Latino
Geographical mobility - Same house 1 year ago (%) - American Indian and Alaska Native
Geographical mobility - Same house 1 year ago (%) - Multirace
Geographical mobility - Same house 1 year ago (%) - Other Race
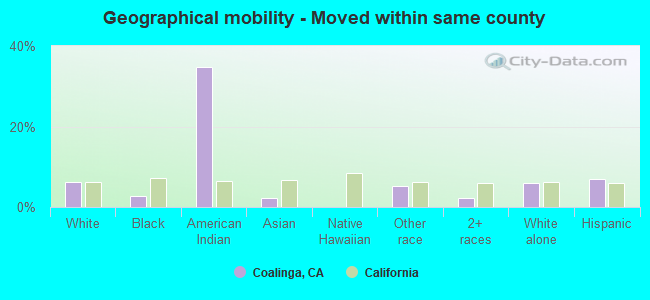
Geographical mobility - Moved within same county (%)
Geographical mobility - Moved within same county (%) - White
Geographical mobility - Moved within same county (%) - Black or African American
Geographical mobility - Moved within same county (%) - Asian
Geographical mobility - Moved within same county (%) - Hispanic or Latino
Geographical mobility - Moved within same county (%) - American Indian and Alaska Native
Geographical mobility - Moved within same county (%) - Multirace
Geographical mobility - Moved within same county (%) - Other Race
Geographical mobility - Moved from different county within same state (%)
Geographical mobility - Moved from different county within same state (%) - White
Geographical mobility - Moved from different county within same state (%) - Black or African American
Geographical mobility - Moved from different county within same state (%) - Asian
Geographical mobility - Moved from different county within same state (%) - Hispanic or Latino
Geographical mobility - Moved from different county within same state (%) - American Indian and Alaska Native
Geographical mobility - Moved from different county within same state (%) - Multirace
Geographical mobility - Moved from different county within same state (%) - Other Race
Geographical mobility - Moved from different state (%)
Geographical mobility - Moved from different state (%) - White
Geographical mobility - Moved from different state (%) - Black or African American
Geographical mobility - Moved from different state (%) - Asian
Geographical mobility - Moved from different state (%) - Hispanic or Latino
Geographical mobility - Moved from different state (%) - American Indian and Alaska Native
Geographical mobility - Moved from different state (%) - Multirace
Geographical mobility - Moved from different state (%) - Other Race
Geographical mobility - Moved from abroad (%)
Geographical mobility - Moved from abroad (%) - White
Geographical mobility - Moved from abroad (%) - Black or African American
Geographical mobility - Moved from abroad (%) - Asian
Geographical mobility - Moved from abroad (%) - Hispanic or Latino
Geographical mobility - Moved from abroad (%) - American Indian and Alaska Native
Geographical mobility - Moved from abroad (%) - Multirace
Geographical mobility - Moved from abroad (%) - Other Race
Place of birth for the foreign-born population - Ireland (%)
Place of birth for the foreign-born population - Denmark (%)
Place of birth for the foreign-born population - Norway (%)
Place of birth for the foreign-born population - Sweden (%)
Place of birth for the foreign-born population - United Kingdom (%)
Place of birth for the foreign-born population - England (%)
Place of birth for the foreign-born population - Scotland (%)
Place of birth for the foreign-born population - Other Northern Europe (%)
Place of birth for the foreign-born population - Austria (%)
Place of birth for the foreign-born population - Belgium (%)
Place of birth for the foreign-born population - France (%)
Place of birth for the foreign-born population - Germany (%)
Place of birth for the foreign-born population - Netherlands (%)
Place of birth for the foreign-born population - Switzerland (%)
Place of birth for the foreign-born population - Other Western Europe (%)
Place of birth for the foreign-born population - Greece (%)
Place of birth for the foreign-born population - Italy (%)
Place of birth for the foreign-born population - Portugal (%)
Place of birth for the foreign-born population - Spain (%)
Place of birth for the foreign-born population - Other Southern Europe (%)
Place of birth for the foreign-born population - Albania (%)
Place of birth for the foreign-born population - Belarus (%)
Place of birth for the foreign-born population - Bosnia and Herzegovina (%)
Place of birth for the foreign-born population - Bulgaria (%)
Place of birth for the foreign-born population - Croatia (%)
Place of birth for the foreign-born population - Czechoslovakia (%)
Place of birth for the foreign-born population - Hungary (%)
Place of birth for the foreign-born population - Latvia (%)
Place of birth for the foreign-born population - Lithuania (%)
Place of birth for the foreign-born population - North Macedonia (Macedonia) (%)
Place of birth for the foreign-born population - Moldova (%)
Place of birth for the foreign-born population - Poland (%)
Place of birth for the foreign-born population - Romania (%)
Place of birth for the foreign-born population - Russia (%)
Place of birth for the foreign-born population - Serbia (%)
Place of birth for the foreign-born population - Ukraine (%)
Place of birth for the foreign-born population - Other Eastern Europe (%)
Place of birth for the foreign-born population - China (%)
Place of birth for the foreign-born population - Hong Kong (%)
Place of birth for the foreign-born population - Taiwan (%)
Place of birth for the foreign-born population - Japan (%)
Place of birth for the foreign-born population - Korea (%)
Place of birth for the foreign-born population - Other Eastern Asia (%)
Place of birth for the foreign-born population - Afghanistan (%)
Place of birth for the foreign-born population - Bangladesh (%)
Place of birth for the foreign-born population - India (%)
Place of birth for the foreign-born population - Iran (%)
Place of birth for the foreign-born population - Kazakhstan (%)
Place of birth for the foreign-born population - Nepal (%)
Place of birth for the foreign-born population - Pakistan (%)
Place of birth for the foreign-born population - Sri Lanka (%)
Place of birth for the foreign-born population - Uzbekistan (%)
Place of birth for the foreign-born population - Other South Central Asia (%)
Place of birth for the foreign-born population - Burma (%)
Place of birth for the foreign-born population - Cambodia (%)
Place of birth for the foreign-born population - Indonesia (%)
Place of birth for the foreign-born population - Laos (%)
Place of birth for the foreign-born population - Malaysia (%)
Place of birth for the foreign-born population - Philippines (%)
Place of birth for the foreign-born population - Singapore (%)
Place of birth for the foreign-born population - Thailand (%)
Place of birth for the foreign-born population - Vietnam (%)
Place of birth for the foreign-born population - Other South Eastern Asia (%)
Place of birth for the foreign-born population - Armenia (%)
Place of birth for the foreign-born population - Iraq (%)
Place of birth for the foreign-born population - Israel (%)
Place of birth for the foreign-born population - Jordan (%)
Place of birth for the foreign-born population - Kuwait (%)
Place of birth for the foreign-born population - Lebanon (%)
Place of birth for the foreign-born population - Saudi Arabia (%)
Place of birth for the foreign-born population - Syria (%)
Place of birth for the foreign-born population - Turkey (%)
Place of birth for the foreign-born population - Yemen (%)
Place of birth for the foreign-born population - Other Western Asia (%)
Place of birth for the foreign-born population - Eritrea (%)
Place of birth for the foreign-born population - Ethiopia (%)
Place of birth for the foreign-born population - Kenya (%)
Place of birth for the foreign-born population - Somalia (%)
Place of birth for the foreign-born population - Uganda (%)
Place of birth for the foreign-born population - Zimbabwe (%)
Place of birth for the foreign-born population - Other Eastern Africa (%)
Place of birth for the foreign-born population - Cameroon (%)
Place of birth for the foreign-born population - Congo (%)
Place of birth for the foreign-born population - Democratic Republic of Congo (Zaire) (%)
Place of birth for the foreign-born population - Other Middle Africa (%)
Place of birth for the foreign-born population - Egypt (%)
Place of birth for the foreign-born population - Morocco (%)
Place of birth for the foreign-born population - Sudan (%)
Place of birth for the foreign-born population - Other Northern Africa (%)
Place of birth for the foreign-born population - South Africa (%)
Place of birth for the foreign-born population - Other Southern Africa (%)
Place of birth for the foreign-born population - Cabo Verde (%)
Place of birth for the foreign-born population - Ghana (%)
Place of birth for the foreign-born population - Liberia (%)
Place of birth for the foreign-born population - Nigeria (%)
Place of birth for the foreign-born population - Senegal (%)
Place of birth for the foreign-born population - Sierra Leone (%)
Place of birth for the foreign-born population - Other Western Africa (%)
Place of birth for the foreign-born population - Australia (%)
Place of birth for the foreign-born population - New Zealand (%)
Place of birth for the foreign-born population - Fiji (%)
Place of birth for the foreign-born population - Micronesia (%)
Place of birth for the foreign-born population - Bahamas (%)
Place of birth for the foreign-born population - Barbados (%)
Place of birth for the foreign-born population - Cuba (%)
Place of birth for the foreign-born population - Dominica (%)
Place of birth for the foreign-born population - Dominican Republic (%)
Place of birth for the foreign-born population - Grenada (%)
Place of birth for the foreign-born population - Haiti (%)
Place of birth for the foreign-born population - Jamaica (%)
Place of birth for the foreign-born population - St. Vincent and the Grenadines (%)
Place of birth for the foreign-born population - Trinidad and Tobago (%)
Place of birth for the foreign-born population - West Indies (%)
Place of birth for the foreign-born population - Other Caribbean (%)
Place of birth for the foreign-born population - Belize (%)
Place of birth for the foreign-born population - Costa Rica (%)
Place of birth for the foreign-born population - El Salvador (%)
Place of birth for the foreign-born population - Guatemala (%)
Place of birth for the foreign-born population - Honduras (%)
Place of birth for the foreign-born population - Mexico (%)
Place of birth for the foreign-born population - Nicaragua (%)
Place of birth for the foreign-born population - Panama (%)
Place of birth for the foreign-born population - Other Central America (%)
Place of birth for the foreign-born population - Argentina (%)
Place of birth for the foreign-born population - Bolivia (%)
Place of birth for the foreign-born population - Brazil (%)
Place of birth for the foreign-born population - Chile (%)
Place of birth for the foreign-born population - Colombia (%)
Place of birth for the foreign-born population - Ecuador (%)
Place of birth for the foreign-born population - Guyana (%)
Place of birth for the foreign-born population - Peru (%)
Place of birth for the foreign-born population - Uruguay (%)
Place of birth for the foreign-born population - Venezuela (%)
Place of birth for the foreign-born population - Other South America (%)
Place of birth for the foreign-born population - Canada (%)
Place of birth for the foreign-born population - Other Northern America (%)
Place of birth for the foreign-born population - Other (%)
Latest news about races in Coalinga, CA collected exclusively by city-data.com from local newspapers, TV, and radio stations
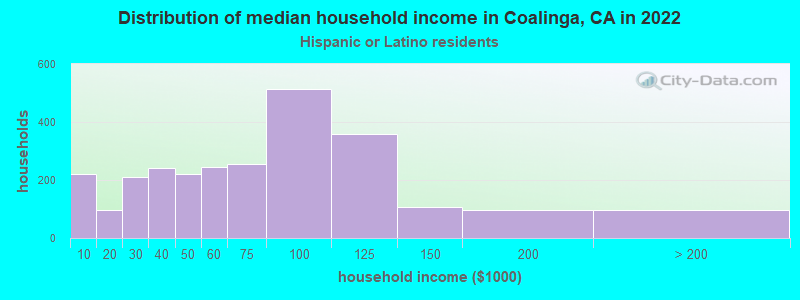
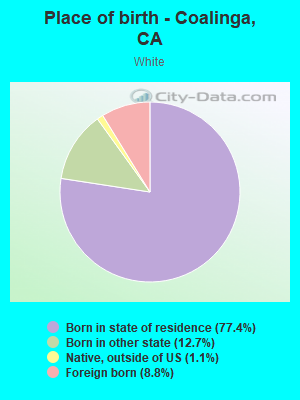
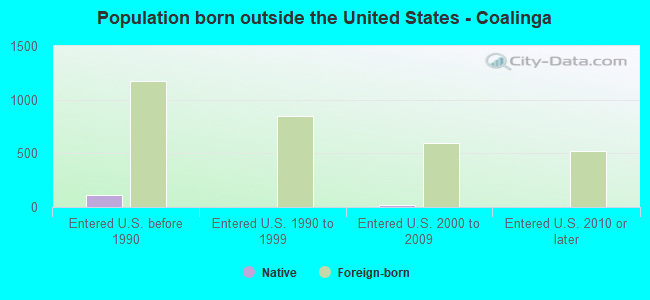
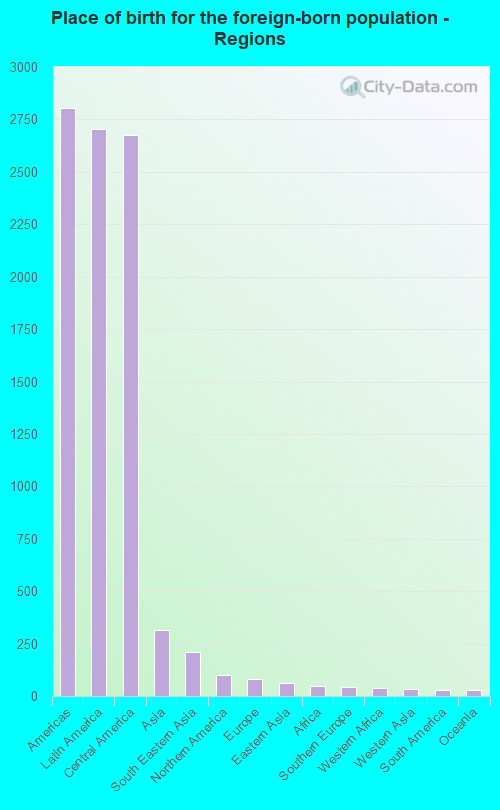
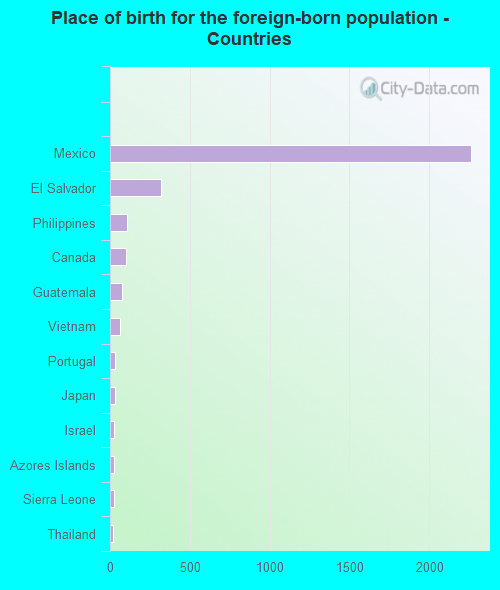
According to 2022 data, the most numerous races in Coalinga, CA are Hispanic (10,418 residents), White alone (4,854 residents), and Asian alone (406 residents). 60.3% of Coalinga residents speak English at home. 19.1% of Coalinga, CA residents are foreign-born (15.8% born in Latin America), which is 36.4% less than the foreign-born rate of 26.0% across the entire state of California.
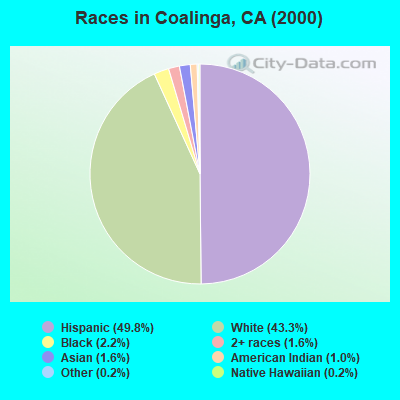
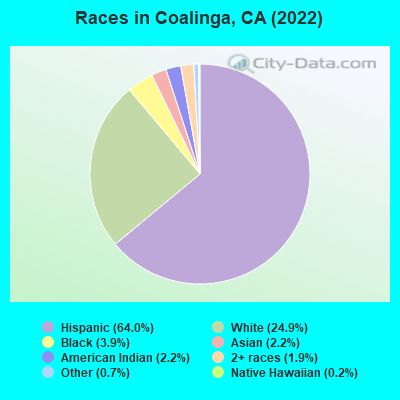
Race distribution in Coalinga
2000 2022
15,816,790 46.7% White alone 10,966,556 32.4% Hispanic 3,648,860 10.8% Asian alone 2,181,926 6.4% Black alone 903,115 2.7% Two or more races 178,984 0.5% American Indian alone 103,736 0.3% Native Hawaiian and Other 71,681 0.2% Other race alone
15,732,184 40.3% Hispanic 13,160,426 33.7% White alone 5,957,867 15.3% Asian alone 2,025,218 5.2% Black alone 1,663,222 4.3% Two or more races 251,618 0.6% Other race alone 135,777 0.3% Native Hawaiian and Other 103,030 0.3% American Indian alone
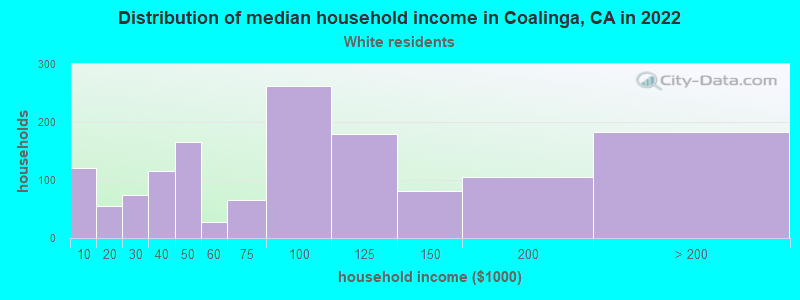
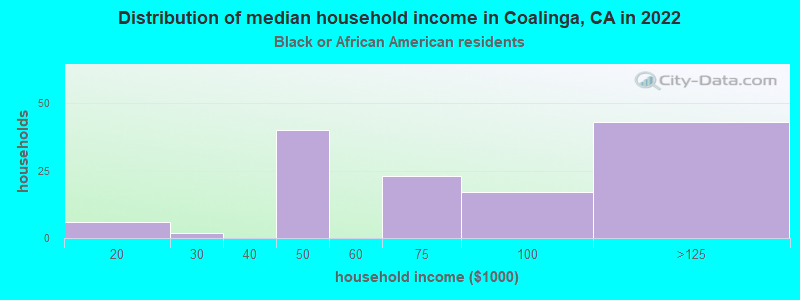
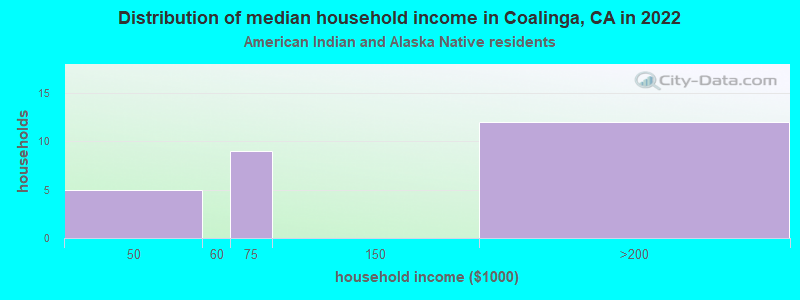
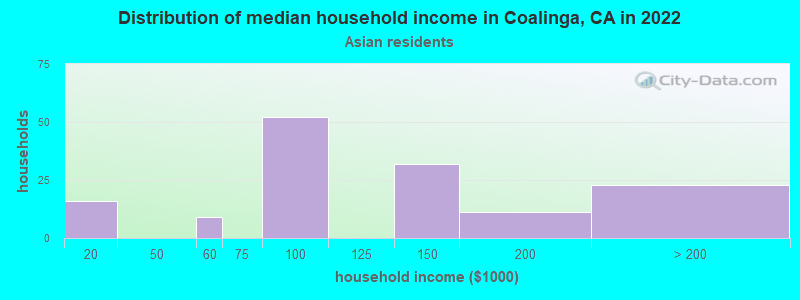
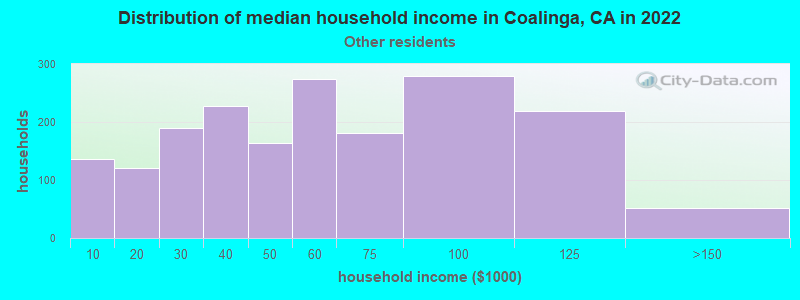
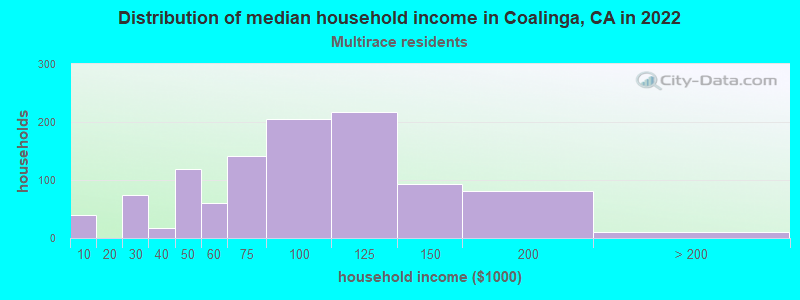
Income and house value in Coalinga Median household income in 2022 $96,519 White non-Hispanic householders$77,165 Black householdersover $200,000 American Indian and Alaska Native householdersover $200,000 Asian householders$140,599 Native Hawaiian and other Pacific Islander householders$58,946 Some other race householders$93,454 Two or more races householders$63,094 Hispanic or Latino race householdersMedian 2022 house value $329,335 White Non-Hispanic householders$314,218 Black or African American householders$308,819 American Indian or Alaska Native householders$404,920 Native Hawaiian and other Pacific Islander householders$289,383 Some other race householders$206,239 Two or more races householders$293,702 Hispanic or Latino householders
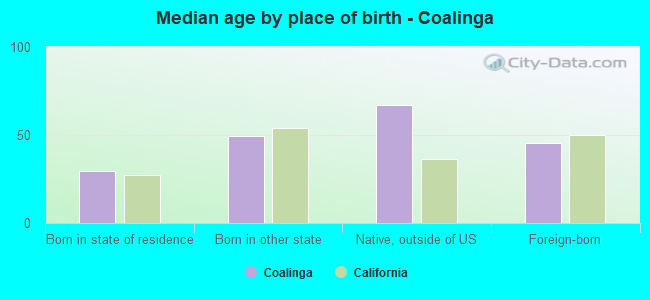
Median age by race in Coalinga
36.6 Median age for White residents37.0 35.9 34.2 Median age for Black or African American residents22.1 33.2 8.3 Median age for American Indian / Alaska Native residents6.2 9.4 33.4 Median age for Asian residents33.5 29.0 15.6 Median age for Native Hawaiian / Pacific Islander residents32.5 Median age for Other race residents32.4 33.7 37.7 Median age for Two or more races residents36.3 35.4 42.9 Median age for White alone residents42.3 43.6 31.1 Median age for Hispanic or Latino residents31.7 29.6
Owner/renter occupied households by race in Coalinga
House owners and renters - White residents 1,544 62.5% Owner occupied925 37.5% Renter occupiedHouse owners and renters - Black or African American residents 22 19.6% Owner occupied92 80.4% Renter occupiedHouse owners and renters - American Indian / Alaska Native residents 15 28.8% Owner occupied38 71.2% Renter occupiedHouse owners and renters - Asian residents 40 35.2% Owner occupied73 64.8% Renter occupiedHouse owners and renters - Native Hawaiian / Pacific Islander residents 18 100.0% Renter occupiedHouse owners and renters - Other race residents 718 54.9% Owner occupied590 45.1% Renter occupiedHouse owners and renters - Two or more races residents 220 37.8% Owner occupied362 62.2% Renter occupiedHouse owners and renters - White alone residents 1,113 61.8% Owner occupied687 38.2% Renter occupiedHouse owners and renters - Hispanic or Latino residents 1,337 57.1% Owner occupied1,005 42.9% Renter occupied
Language usage in Coalinga
English speakers - Total 60.3% of residents of Coalinga speak English at home.
36.7% of residents speak Spanish at home 4,053 68.7% Speak English very well1,847 31.3% Speak English less than very well2.9% of residents speak other language at home 387 84.1% Speak English very well73 15.9% Speak English less than very well
English speakers - Born in the United States 80.7% of residents of Coalinga speak English at home.
18.3% of residents speak Spanish at home 221 79.8% Speak English very well56 20.2% Speak English less than very well0.7% of residents speak other language at home 11 100.0% Speak English very well
All residents speak only English at home
English speakers - Foreign-born 12.6% of residents of Coalinga speak English at home.
74.4% of residents speak Spanish at home 858 36.0% Speak English very well1,527 64.0% Speak English less than very well11.7% of residents speak other language at home 327 87.0% Speak English very well49 13.0% Speak English less than very well
White (Caucasian) - Speak only English Native:
82.6% (5,927)Foreign-born:
22.2% (158)
White (Caucasian) - Speak another language Native:
16.6% (1,190)Foreign-born:
76.1% (542)
Black or African American - Speak only English Native:
98.9% (406)Foreign-born:
20.5% (8)
American Indian / Alaska Native - Speak only English Native:
87.8% (435)Foreign-born:
33.9% (19)
American Indian / Alaska Native - Speak another language Native:
3.3% (16)Foreign-born:
74.7% (41)
Asian - Speak only English Native:
80.9% (121)Foreign-born:
13.8% (39)
Asian - Speak another language Native:
24.4% (37)Foreign-born:
86.3% (241)
Native Hawaiian / Pacific Islander - Speak another language Native:
21.1% (18)Foreign-born:
96.4% (10)
Other race - Speak only English Native:
38.0% (1,231)Foreign-born:
4.1% (76)
Other race - Speak another language Native:
63.2% (2,048)Foreign-born:
94.8% (1,742)
Two or more races - Speak another language Native:
31.5% (851)Foreign-born:
100.0% (481)
White alone - Speak only English Native:
97.9% (4,399)Foreign-born:
61.1% (114)
White alone - Speak another language Native:
1.7% (78)Foreign-born:
28.2% (52)
Hispanic or Latino - Speak only English Native:
51.4% (3,886)Foreign-born:
6.0% (150)
Hispanic or Latino - Speak another language Native:
49.3% (3,722)Foreign-born:
93.3% (2,325)
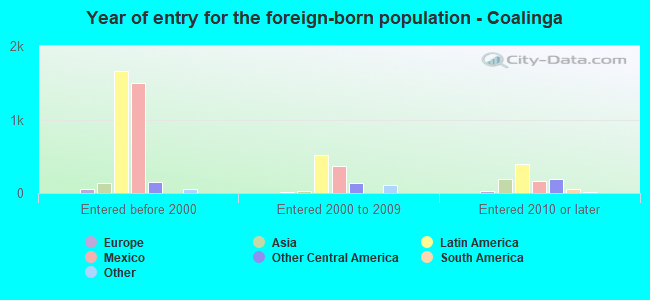
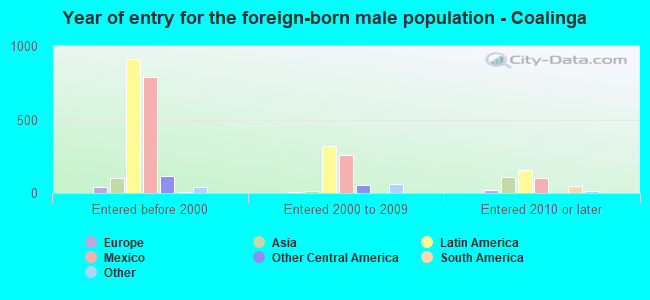
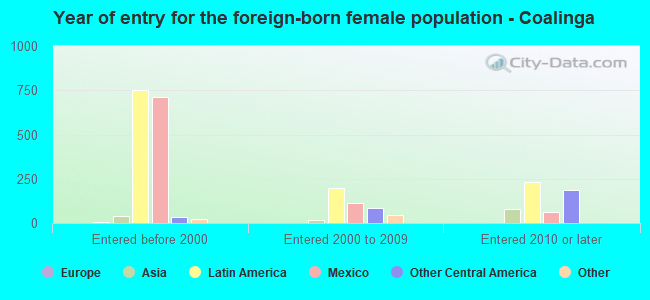
Foreign-born residents in Coalinga 3,277 residents are foreign born (15.8% Latin America ).
This city:
19.1%California:
100.0%
Marital status for residents in Coalinga Marital status - White (Caucasian) population 15 years and over
Males 51.8% Never married34.8% Now married1.3% Separated2.0% Widowed10.1% DivorcedFemales 35.2% Never married41.9% Now married4.9% Separated7.3% Widowed10.7% DivorcedWomen who gave birth in the past 12 months Now married:
58.3% (49)Unmarried:
41.7% (35)
Women who did not give birth in the past 12 months Now married:
36.6% (553)Unmarried:
63.4% (956)
Marital status - Black or African American population 15 years and over
Males 67.2% Never married10.9% Now married9.2% Separated4.2% Widowed8.4% DivorcedFemales 37.4% Never married32.0% Now married8.7% Separated0.0% Widowed21.9% DivorcedWomen who gave birth in the past 12 months Now married:
100.0% (24)Unmarried:
0.0% (0)
Women who did not give birth in the past 12 months Now married:
15.7% (18)Unmarried:
84.3% (99)
Marital status - American Indian / Alaska Native population 15 years and over
Males 40.6% Never married41.7% Now married8.3% Separated9.4% Widowed0.0% DivorcedFemales 51.6% Never married21.1% Now married0.0% Separated0.0% Widowed27.4% DivorcedWomen who did not give birth in the past 12 months Now married:
14.8% (22)Unmarried:
85.2% (125)
Marital status - Asian population 15 years and over
Males 70.7% Never married18.8% Now married0.0% Separated0.0% Widowed10.5% DivorcedFemales 51.4% Never married31.8% Now married0.0% Separated4.1% Widowed12.8% DivorcedWomen who did not give birth in the past 12 months Now married:
15.2% (18)Unmarried:
84.8% (98)
Marital status - Native Hawaiian / Pacific Islander population 15 years and over
Males 88.9% Never married11.1% Now married0.0% Separated0.0% Widowed0.0% DivorcedFemales 100.0% Never married0.0% Now married0.0% Separated0.0% Widowed0.0% DivorcedWomen who did not give birth in the past 12 months Now married:
0.0% (0)Unmarried:
100.0% (15)
Marital status - Other race population 15 years and over
Males 58.9% Never married31.9% Now married1.9% Separated0.0% Widowed7.2% DivorcedFemales 34.5% Never married52.5% Now married3.5% Separated4.4% Widowed5.0% DivorcedWomen who gave birth in the past 12 months Now married:
0.0% (0)Unmarried:
100.0% (33)
Women who did not give birth in the past 12 months Now married:
49.9% (485)Unmarried:
50.1% (486)
Marital status - Two or more races population 15 years and over
Males 46.3% Never married22.0% Now married12.8% Separated0.3% Widowed18.6% DivorcedFemales 40.6% Never married36.8% Now married7.1% Separated7.1% Widowed8.3% DivorcedWomen who did not give birth in the past 12 months Now married:
25.7% (123)Unmarried:
74.3% (355)
Marital status - White alone, not Hispanic / Latino population 15 years and over
Males 41.7% Never married39.6% Now married1.7% Separated1.9% Widowed14.9% DivorcedFemales 28.4% Never married50.0% Now married0.9% Separated7.9% Widowed12.8% DivorcedWomen who gave birth in the past 12 months Now married:
100.0% (32)Unmarried:
0.0% (0)
Women who did not give birth in the past 12 months Now married:
40.5% (348)Unmarried:
59.5% (513)
Marital status - Hispanic or Latino population 15 years and over
Males 59.2% Never married30.4% Now married2.4% Separated1.0% Widowed7.0% DivorcedFemales 40.0% Never married40.2% Now married7.3% Separated5.9% Widowed6.6% DivorcedWomen who gave birth in the past 12 months Now married:
27.7% (29)Unmarried:
72.3% (76)
Women who did not give birth in the past 12 months Now married:
39.7% (800)Unmarried:
60.3% (1,214)
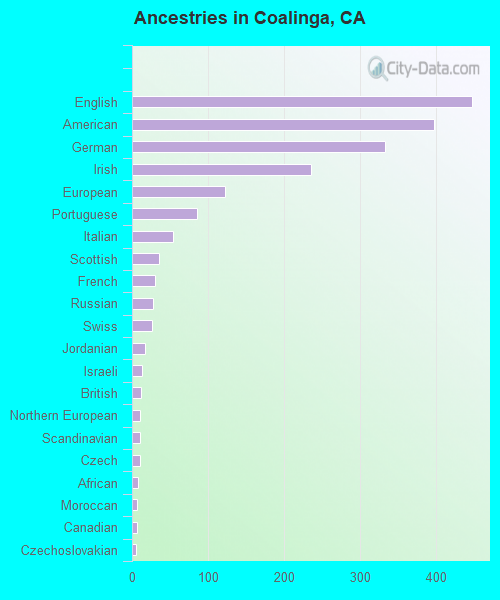
Ancestries in Coalinga
355 3.2% German347 3.1% English303 2.7% American255 2.3% Irish140 1.2% European104 0.9% Italian62 0.6% Portuguese39 0.3% Hungarian38 0.3% Scottish28 0.2% Scandinavian27 0.2% Russian22 0.2% Swiss21 0.2% African12 0.1% Danish12 0.1% Polish11 0.10% Czech10 0.09% Canadian10 0.09% Serbian9 0.08% British8 0.07% Czechoslovakian8 0.07% Swedish7 0.06% Moroccan7 0.06% French6 0.05% Northern European5 0.04% Norwegian4 0.04% Iraqi4 0.04% Eastern European3 0.03% Armenian2 0.02% Welsh
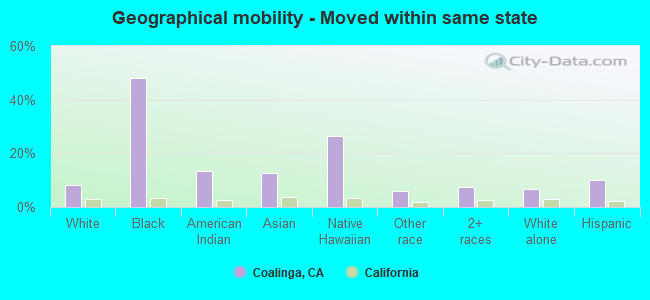
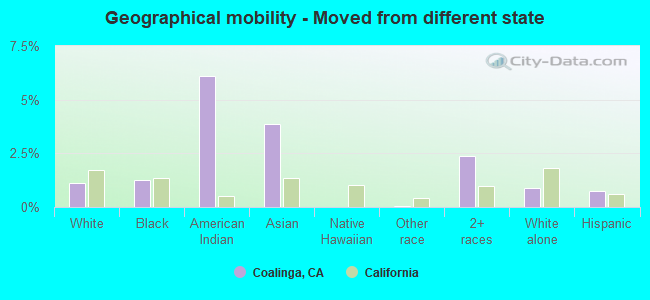
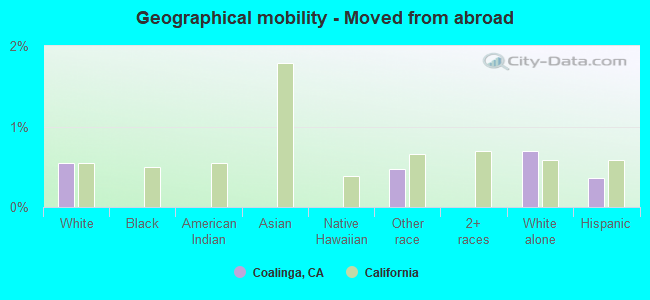
Geographical mobility in Coalinga Same house 1 year ago 6,704 83.3% White (Caucasian)247 51.7% Black or African American203 29.5% American Indian / Alaska Native366 83.4% Asian87 75.4% Native Hawaiian / Pacific Islander4,533 87.0% Other race2,781 87.2% Two or more races4,229 85.9% White alone, not Hispanic / Latino8,152 81.4% Hispanic or LatinoMoved within same county 508 6.3% White / Caucasian13 2.7% Black or African American239 34.7% American Indian / Alaska Native10 2.2% Asian268 5.1% Other race68 2.1% Two or more races294 6.0% White alone, not Hispanic / Latino709 7.1% Hispanic or LatinoMoved within same state 667 8.3% White / Caucasian230 48.2% Black or African American91 13.2% American Indian / Alaska Native56 12.7% Asian30 26.3% Native Hawaiian / Pacific Islander318 6.1% Other race244 7.6% Two or more races330 6.7% White alone, not Hispanic / Latino1,012 10.1% Hispanic or LatinoMoved from different state 88 1.1% White / Caucasian6 1.3% Black or African American42 6.1% American Indian / Alaska Native17 3.9% Asian3 0.1% Other race76 2.4% Two or more races43 0.9% White alone, not Hispanic / Latino75 0.8% Hispanic or LatinoMoved from abroad 44 0.5% White25 0.5% Other race34 0.7% White alone, not Hispanic / Latino36 0.4% Hispanic or Latino
Children Nativity (place of birth) in Coalinga
Children under 6 years - Living with two parents Both parents native 300 100.0% NativeBoth parents foreign-born 79 100.0% NativeOne native, one foreign-born parent 53 100.0% NativeChildren under 6 years - Living with one parent Native parent 407 100.0% NativeForeign-born parent 89 100.0% NativeChildren 6 to 17 years - Living with two parents Both parents native 704 100.0% Native0 0.0% Foreign-bornBoth parents foreign-born 381 88.1% Native52 11.9% Foreign-bornOne native, one foreign-born parent 231 100.0% NativeChildren 6 to 17 years - Living with one parent Native parent 1,200 100.0% NativeForeign-born parent 408 51.3% Native387 48.7% Foreign-born
Grandparents responsible for own grandchildren in Coalinga
Grandparents (30 to 59 years) White / Caucasian 26 32.7% Responsible for grandchildren54 67.3% Not responsible for grandchildrenBlack or African American 28 100.0% Not responsible for grandchildrenOther race 20 100.0% Not responsible for grandchildrenWhite alone, not Hispanic / Latino 6 100.0% Not responsible for grandchildrenHispanic or Latino 46 30.5% Responsible for grandchildren104 69.5% Not responsible for grandchildrenGrandparents (60 years and over) White / Caucasian 13 12.5% Responsible for grandchildren90 87.5% Not responsible for grandchildrenOther race 68 100.0% Not responsible for grandchildrenWhite alone, not Hispanic / Latino 3 3.0% Responsible for grandchildren88 97.0% Not responsible for grandchildrenHispanic or Latino 22 17.6% Responsible for grandchildren103 82.4% Not responsible for grandchildren