Races in Coeymans, New York (NY) Detailed Stats
Ancestries, Foreign-born residents, place of birth

Recent posts about races in Coeymans, New York on our local forum with over 2,400,000 registered users:
 | Where are the toxic areas of Capitol District? (3 replies) |
| Toxic/polluted, places to AVOID! (2 replies) |
| Moving to Albany from Tennessee (25 replies) |
Latest news about races in Coeymans, NY collected exclusively by city-data.com from local newspapers, TV, and radio stations
1.8% of Coeymans, NY residents are foreign-born , which is 1124.7% less than the foreign-born rate of 22.0% across the entire state of New York.
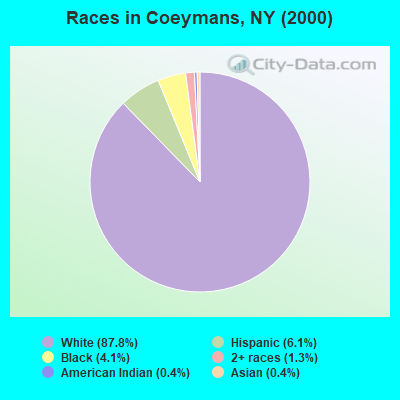
Race distribution in Coeymans

- 73387.8%White alone
- 516.1%Hispanic
- 344.1%Black alone
- 111.3%Two or more races
- 30.4%Asian alone
- 30.4%American Indian alone
2000
2022
-
- 11,760,98162.0%White alone
- 2,867,58315.1%Hispanic
- 2,812,62314.8%Black alone
- 1,035,9265.5%Asian alone
- 366,1161.9%Two or more races
- 75,4990.4%Other race alone
- 52,4990.3%American Indian alone
- 5,2300.03%Native Hawaiian and Other
Pacific Islander alone

-
- 10,408,93352.9%White alone
- 3,867,29919.7%Hispanic
- 2,633,84013.4%Black alone
- 1,776,2869.0%Asian alone
- 732,6703.7%Two or more races
- 216,1101.1%Other race alone
- 35,0820.2%American Indian alone
- 6,9310.04%Native Hawaiian and Other
Pacific Islander alone

Income and house value in Coeymans
- Median household income in 2022
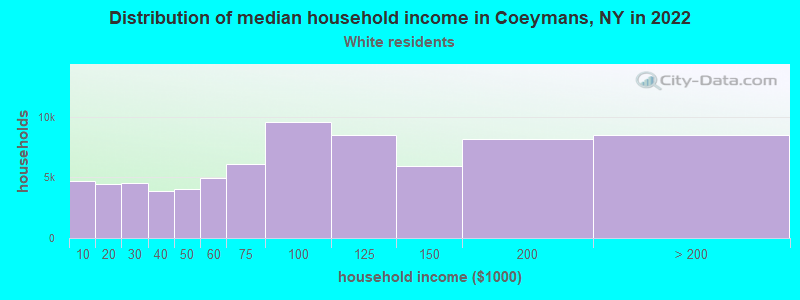
- $62,056White non-Hispanic householders
- $24,981Some other race householders
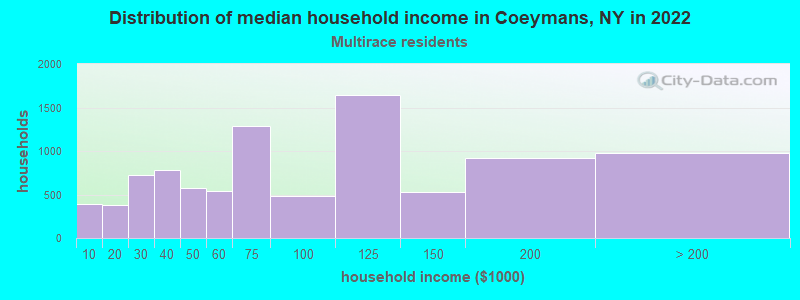
- $122,981Two or more races householders
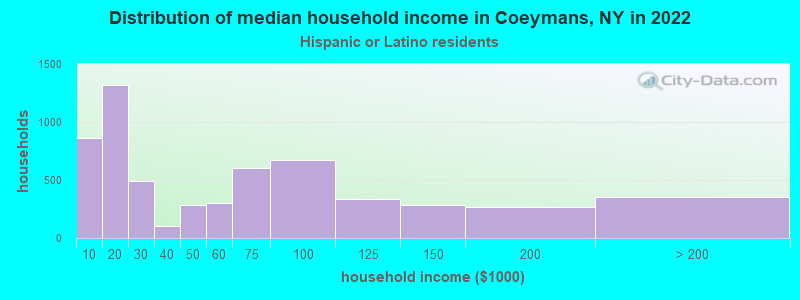
- $43,928Hispanic or Latino race householders
- Median 2022 house value
- $192,419White Non-Hispanic householders
- $72,519Two or more races householders
- $229,646Hispanic or Latino householders
Household income for White non-Hispanic householders
Household income for Two or more races householders
Household income for Hispanic or Latino race householders
Foreign-born residents in Coeymans
15 residents are foreign born
| This city: | 1.8% |
| New York: | 20.4% |
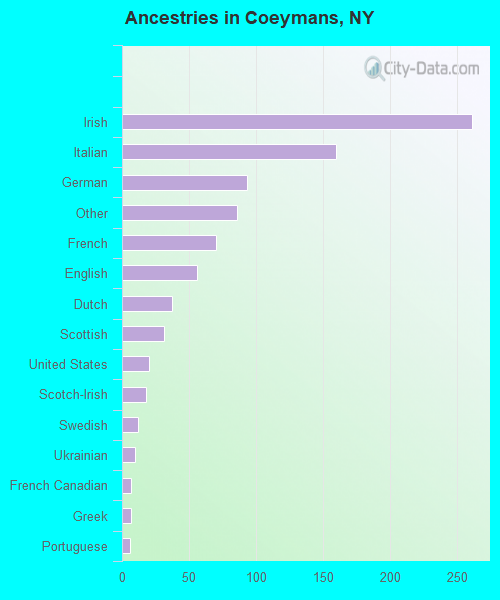
Ancestries in Coeymans

- 26129.9%Irish
- 16018.3%Italian
- 9310.6%German
- 869.8%Other
- 708.0%French
- 566.4%English
- 374.2%Dutch
- 313.5%Scottish
- 202.3%United States
- 182.1%Scotch-Irish
- 121.4%Swedish
- 101.1%Ukrainian
- 70.8%French Canadian
- 70.8%Greek
- 60.7%Portuguese
Zip codes: 12045.