Races in Cold Spring, Wisconsin (WI) Detailed Stats
Ancestries, Foreign-born residents, place of birth

Recent posts about races in Cold Spring, Wisconsin on our local forum with over 2,400,000 registered users:
 | Best neighborhoods to live for professional African American population (54 replies) |
2.7% of Cold Spring, WI residents are foreign-born (1.2% born in Latin America, 0.8% born in Europe, 0.8% born in Asia), which is 82.4% less than the foreign-born rate of 5.0% across the entire state of Wisconsin.
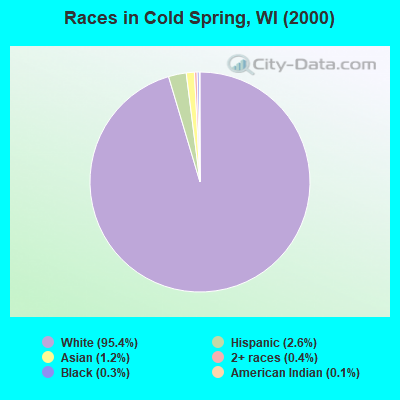
Race distribution in Cold Spring

- 73195.4%White alone
- 202.6%Hispanic
- 91.2%Asian alone
- 30.4%Two or more races
- 20.3%Black alone
- 10.1%American Indian alone
2000
2022
-
- 4,681,63087.3%White alone
- 300,2455.6%Black alone
- 192,9213.6%Hispanic
- 87,9951.6%Asian alone
- 51,9211.0%Two or more races
- 43,9800.8%American Indian alone
- 3,6370.07%Other race alone
- 1,3460.03%Native Hawaiian and Other
Pacific Islander alone

-
- 4,654,03179.0%White alone
- 447,0227.6%Hispanic
- 345,6785.9%Black alone
- 217,5323.7%Two or more races
- 172,2422.9%Asian alone
- 33,7620.6%American Indian alone
- 19,6800.3%Other race alone
- 2,5920.04%Native Hawaiian and Other
Pacific Islander alone

Income and house value in Cold Spring
- Median household income in 2022
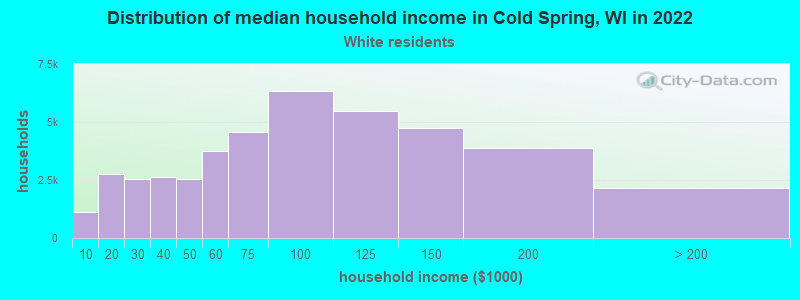
- $102,239White non-Hispanic householders
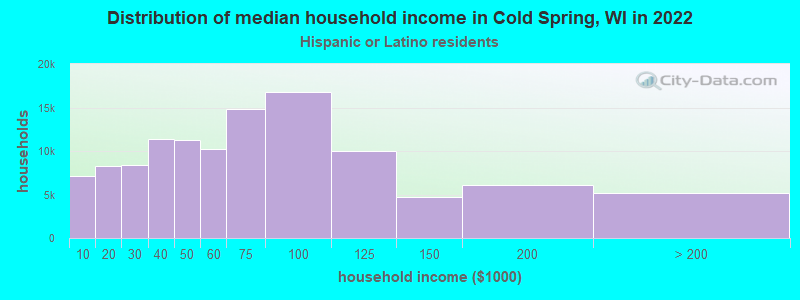
- $109,275Hispanic or Latino race householders
- Median 2022 house value
- $343,088White Non-Hispanic householders
- $363,915Hispanic or Latino householders
Household income for White non-Hispanic householders
Household income for Hispanic or Latino race householders
Foreign-born residents in Cold Spring
21 residents are foreign born (1.2% Latin America, 0.8% Europe, 0.8% Asia).
| This city: | 2.7% |
| Wisconsin: | 3.6% |
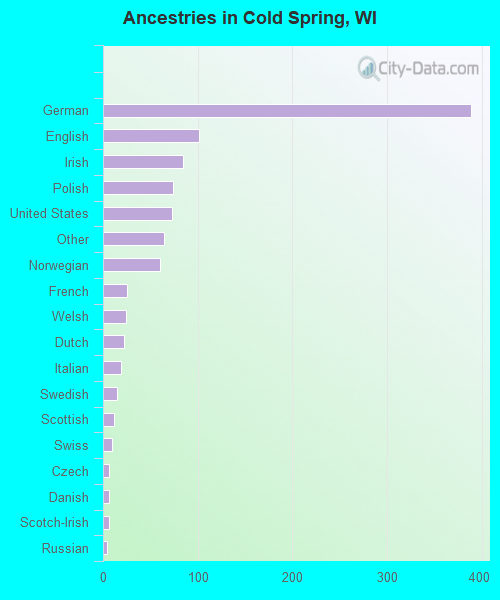
Ancestries in Cold Spring

- 38838.6%German
- 10110.1%English
- 848.4%Irish
- 747.4%Polish
- 737.3%United States
- 646.4%Other
- 606.0%Norwegian
- 252.5%French
- 242.4%Welsh
- 222.2%Dutch
- 191.9%Italian
- 151.5%Swedish
- 121.2%Scottish
- 90.9%Swiss
- 60.6%Czech
- 60.6%Danish
- 60.6%Scotch-Irish
- 40.4%Russian
- 30.3%Hungarian
- 30.3%Lithuanian
- 20.2%Greek
- 20.2%Slovak
- 10.10%Arab
- 10.10%French Canadian
Zip codes: 53190.