Races in Colesville, Maryland (MD) Detailed Stats
Data:
Races - White alone (%)
Races - White alone (% change since 2000)
Races - Black alone (%)
Races - Black alone (% change since 2000)
Races - American Indian alone (%)
Races - American Indian alone (% change since 2000)
Races - Asian alone (%)
Races - Asian alone (% change since 2000)
Races - Hispanic (%)
Races - Hispanic (% change since 2000)
Races - Native Hawaiian and Other Pacific Islander alone (%)
Races - Native Hawaiian and Other Pacific Islander alone (% change since 2000)
Races - Two or more races(%)
Races - Two or more races(% change since 2000)
Races - Other race alone (%)
Races - Other race alone (% change since 2000)
Racial diversity
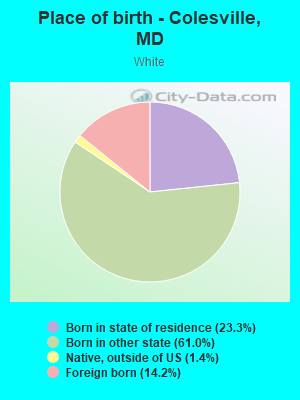
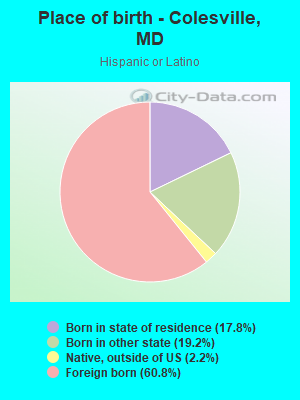
Place of birth - Born in state of residence (%)
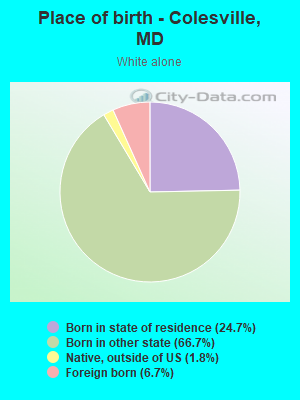
Place of birth - Born in state of residence (%) - White
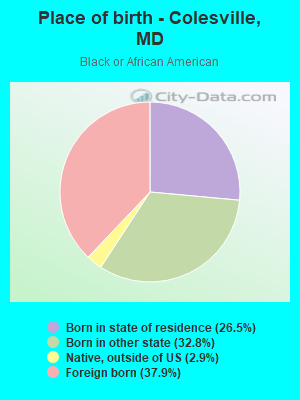
Place of birth - Born in state of residence (%) - Black or African American
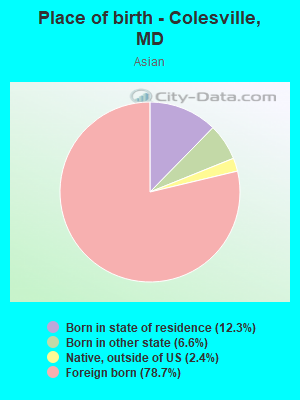
Place of birth - Born in state of residence (%) - Asian
Place of birth - Born in state of residence (%) - Hispanic or Latino
Place of birth - Born in state of residence (%) - American Indian and Alaska Native
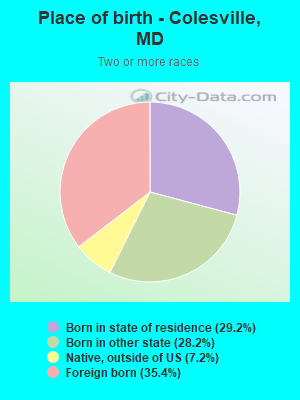
Place of birth - Born in state of residence (%) - Multirace
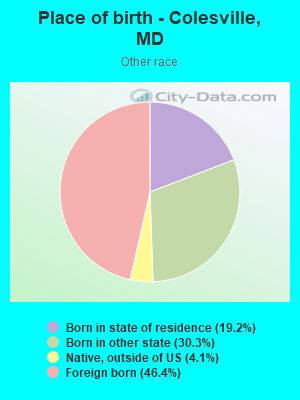
Place of birth - Born in state of residence (%) - Other Race
Place of birth - Born in other state (%)
Place of birth - Born in other state (%) - White
Place of birth - Born in other state (%) - Black or African American
Place of birth - Born in other state (%) - Asian
Place of birth - Born in other state (%) - Hispanic or Latino
Place of birth - Born in other state (%) - American Indian and Alaska Native
Place of birth - Born in other state (%) - Multirace
Place of birth - Born in other state (%) - Other Race
Place of birth - Native, outside of US (%)
Place of birth - Native, outside of US (%) - White
Place of birth - Native, outside of US (%) - Black or African American
Place of birth - Native, outside of US (%) - Asian
Place of birth - Native, outside of US (%) - Hispanic or Latino
Place of birth - Native, outside of US (%) - American Indian and Alaska Native
Place of birth - Native, outside of US (%) - Multirace
Place of birth - Native, outside of US (%) - Other Race
Place of birth - Foreign born (%)
Place of birth - Foreign born (%) - White
Place of birth - Foreign born (%) - Black or African American
Place of birth - Foreign born (%) - Asian
Place of birth - Foreign born (%) - Hispanic or Latino
Place of birth - Foreign born (%) - American Indian and Alaska Native
Place of birth - Foreign born (%) - Multirace
Place of birth - Foreign born (%) - Other Race
Residents speaking English at home (%)
Residents speaking English at home - Born in the United States (%)
Residents speaking English at home - Native, born elsewhere (%)
Residents speaking English at home - Foreign born (%)
Residents speaking Spanish at home (%)
Residents speaking Spanish at home - Born in the United States (%)
Residents speaking Spanish at home - Native, born elsewhere (%)
Residents speaking Spanish at home - Foreign born (%)
Residents speaking other language at home (%)
Residents speaking other language at home - Born in the United States (%)
Residents speaking other language at home - Native, born elsewhere (%)
Residents speaking other language at home - Foreign born (%)
Marital status - Never married (%)
Marital status - Now married (%)
Marital status - Separated (%)
Marital status - Widowed (%)
Marital status - Divorced (%)
Ancestries Reported - Arab (%)
Ancestries Reported - Czech (%)
Ancestries Reported - Danish (%)
Ancestries Reported - Dutch (%)
Ancestries Reported - English (%)
Ancestries Reported - French (%)
Ancestries Reported - French Canadian (%)
Ancestries Reported - German (%)
Ancestries Reported - Greek (%)
Ancestries Reported - Hungarian (%)
Ancestries Reported - Irish (%)
Ancestries Reported - Italian (%)
Ancestries Reported - Lithuanian (%)
Ancestries Reported - Norwegian (%)
Ancestries Reported - Polish (%)
Ancestries Reported - Portuguese (%)
Ancestries Reported - Russian (%)
Ancestries Reported - Scotch-Irish (%)
Ancestries Reported - Scottish (%)
Ancestries Reported - Slovak (%)
Ancestries Reported - Subsaharan African (%)
Ancestries Reported - Swedish (%)
Ancestries Reported - Swiss (%)
Ancestries Reported - Ukrainian (%)
Ancestries Reported - United States (%)
Ancestries Reported - Welsh (%)
Ancestries Reported - West Indian (%)
Ancestries Reported - Other (%)
Geographical mobility - Same house 1 year ago (%)
Geographical mobility - Same house 1 year ago (%) - White
Geographical mobility - Same house 1 year ago (%) - Black or African American
Geographical mobility - Same house 1 year ago (%) - Asian
Geographical mobility - Same house 1 year ago (%) - Hispanic or Latino
Geographical mobility - Same house 1 year ago (%) - American Indian and Alaska Native
Geographical mobility - Same house 1 year ago (%) - Multirace
Geographical mobility - Same house 1 year ago (%) - Other Race
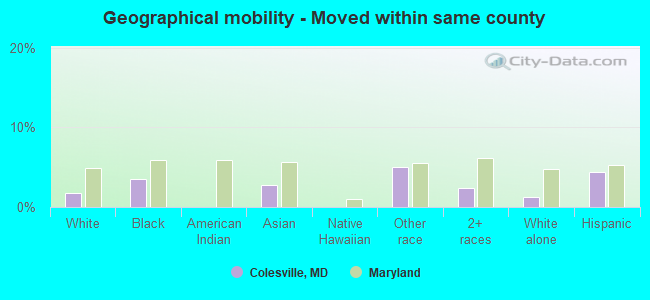
Geographical mobility - Moved within same county (%)
Geographical mobility - Moved within same county (%) - White
Geographical mobility - Moved within same county (%) - Black or African American
Geographical mobility - Moved within same county (%) - Asian
Geographical mobility - Moved within same county (%) - Hispanic or Latino
Geographical mobility - Moved within same county (%) - American Indian and Alaska Native
Geographical mobility - Moved within same county (%) - Multirace
Geographical mobility - Moved within same county (%) - Other Race
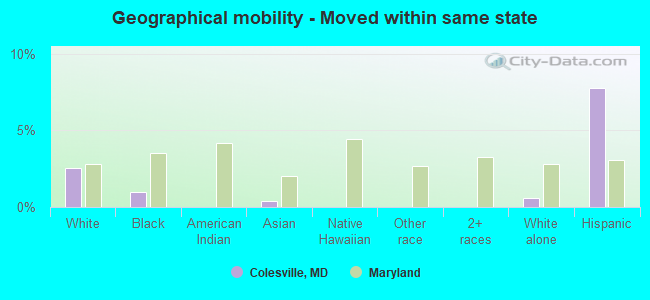
Geographical mobility - Moved from different county within same state (%)
Geographical mobility - Moved from different county within same state (%) - White
Geographical mobility - Moved from different county within same state (%) - Black or African American
Geographical mobility - Moved from different county within same state (%) - Asian
Geographical mobility - Moved from different county within same state (%) - Hispanic or Latino
Geographical mobility - Moved from different county within same state (%) - American Indian and Alaska Native
Geographical mobility - Moved from different county within same state (%) - Multirace
Geographical mobility - Moved from different county within same state (%) - Other Race
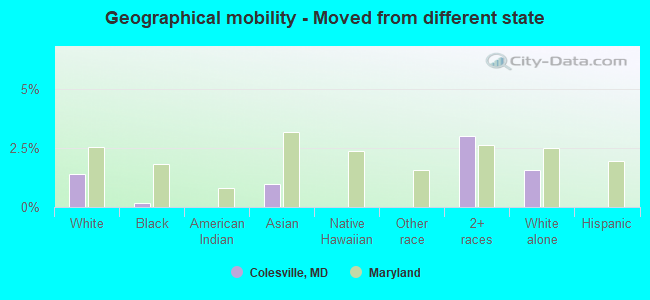
Geographical mobility - Moved from different state (%)
Geographical mobility - Moved from different state (%) - White
Geographical mobility - Moved from different state (%) - Black or African American
Geographical mobility - Moved from different state (%) - Asian
Geographical mobility - Moved from different state (%) - Hispanic or Latino
Geographical mobility - Moved from different state (%) - American Indian and Alaska Native
Geographical mobility - Moved from different state (%) - Multirace
Geographical mobility - Moved from different state (%) - Other Race
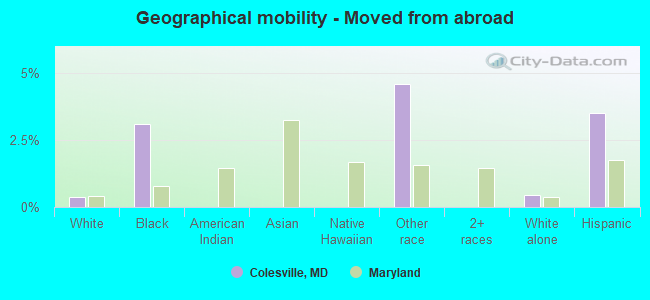
Geographical mobility - Moved from abroad (%)
Geographical mobility - Moved from abroad (%) - White
Geographical mobility - Moved from abroad (%) - Black or African American
Geographical mobility - Moved from abroad (%) - Asian
Geographical mobility - Moved from abroad (%) - Hispanic or Latino
Geographical mobility - Moved from abroad (%) - American Indian and Alaska Native
Geographical mobility - Moved from abroad (%) - Multirace
Geographical mobility - Moved from abroad (%) - Other Race
Place of birth for the foreign-born population - Ireland (%)
Place of birth for the foreign-born population - Denmark (%)
Place of birth for the foreign-born population - Norway (%)
Place of birth for the foreign-born population - Sweden (%)
Place of birth for the foreign-born population - United Kingdom (%)
Place of birth for the foreign-born population - England (%)
Place of birth for the foreign-born population - Scotland (%)
Place of birth for the foreign-born population - Other Northern Europe (%)
Place of birth for the foreign-born population - Austria (%)
Place of birth for the foreign-born population - Belgium (%)
Place of birth for the foreign-born population - France (%)
Place of birth for the foreign-born population - Germany (%)
Place of birth for the foreign-born population - Netherlands (%)
Place of birth for the foreign-born population - Switzerland (%)
Place of birth for the foreign-born population - Other Western Europe (%)
Place of birth for the foreign-born population - Greece (%)
Place of birth for the foreign-born population - Italy (%)
Place of birth for the foreign-born population - Portugal (%)
Place of birth for the foreign-born population - Spain (%)
Place of birth for the foreign-born population - Other Southern Europe (%)
Place of birth for the foreign-born population - Albania (%)
Place of birth for the foreign-born population - Belarus (%)
Place of birth for the foreign-born population - Bosnia and Herzegovina (%)
Place of birth for the foreign-born population - Bulgaria (%)
Place of birth for the foreign-born population - Croatia (%)
Place of birth for the foreign-born population - Czechoslovakia (%)
Place of birth for the foreign-born population - Hungary (%)
Place of birth for the foreign-born population - Latvia (%)
Place of birth for the foreign-born population - Lithuania (%)
Place of birth for the foreign-born population - North Macedonia (Macedonia) (%)
Place of birth for the foreign-born population - Moldova (%)
Place of birth for the foreign-born population - Poland (%)
Place of birth for the foreign-born population - Romania (%)
Place of birth for the foreign-born population - Russia (%)
Place of birth for the foreign-born population - Serbia (%)
Place of birth for the foreign-born population - Ukraine (%)
Place of birth for the foreign-born population - Other Eastern Europe (%)
Place of birth for the foreign-born population - China (%)
Place of birth for the foreign-born population - Hong Kong (%)
Place of birth for the foreign-born population - Taiwan (%)
Place of birth for the foreign-born population - Japan (%)
Place of birth for the foreign-born population - Korea (%)
Place of birth for the foreign-born population - Other Eastern Asia (%)
Place of birth for the foreign-born population - Afghanistan (%)
Place of birth for the foreign-born population - Bangladesh (%)
Place of birth for the foreign-born population - India (%)
Place of birth for the foreign-born population - Iran (%)
Place of birth for the foreign-born population - Kazakhstan (%)
Place of birth for the foreign-born population - Nepal (%)
Place of birth for the foreign-born population - Pakistan (%)
Place of birth for the foreign-born population - Sri Lanka (%)
Place of birth for the foreign-born population - Uzbekistan (%)
Place of birth for the foreign-born population - Other South Central Asia (%)
Place of birth for the foreign-born population - Burma (%)
Place of birth for the foreign-born population - Cambodia (%)
Place of birth for the foreign-born population - Indonesia (%)
Place of birth for the foreign-born population - Laos (%)
Place of birth for the foreign-born population - Malaysia (%)
Place of birth for the foreign-born population - Philippines (%)
Place of birth for the foreign-born population - Singapore (%)
Place of birth for the foreign-born population - Thailand (%)
Place of birth for the foreign-born population - Vietnam (%)
Place of birth for the foreign-born population - Other South Eastern Asia (%)
Place of birth for the foreign-born population - Armenia (%)
Place of birth for the foreign-born population - Iraq (%)
Place of birth for the foreign-born population - Israel (%)
Place of birth for the foreign-born population - Jordan (%)
Place of birth for the foreign-born population - Kuwait (%)
Place of birth for the foreign-born population - Lebanon (%)
Place of birth for the foreign-born population - Saudi Arabia (%)
Place of birth for the foreign-born population - Syria (%)
Place of birth for the foreign-born population - Turkey (%)
Place of birth for the foreign-born population - Yemen (%)
Place of birth for the foreign-born population - Other Western Asia (%)
Place of birth for the foreign-born population - Eritrea (%)
Place of birth for the foreign-born population - Ethiopia (%)
Place of birth for the foreign-born population - Kenya (%)
Place of birth for the foreign-born population - Somalia (%)
Place of birth for the foreign-born population - Uganda (%)
Place of birth for the foreign-born population - Zimbabwe (%)
Place of birth for the foreign-born population - Other Eastern Africa (%)
Place of birth for the foreign-born population - Cameroon (%)
Place of birth for the foreign-born population - Congo (%)
Place of birth for the foreign-born population - Democratic Republic of Congo (Zaire) (%)
Place of birth for the foreign-born population - Other Middle Africa (%)
Place of birth for the foreign-born population - Egypt (%)
Place of birth for the foreign-born population - Morocco (%)
Place of birth for the foreign-born population - Sudan (%)
Place of birth for the foreign-born population - Other Northern Africa (%)
Place of birth for the foreign-born population - South Africa (%)
Place of birth for the foreign-born population - Other Southern Africa (%)
Place of birth for the foreign-born population - Cabo Verde (%)
Place of birth for the foreign-born population - Ghana (%)
Place of birth for the foreign-born population - Liberia (%)
Place of birth for the foreign-born population - Nigeria (%)
Place of birth for the foreign-born population - Senegal (%)
Place of birth for the foreign-born population - Sierra Leone (%)
Place of birth for the foreign-born population - Other Western Africa (%)
Place of birth for the foreign-born population - Australia (%)
Place of birth for the foreign-born population - New Zealand (%)
Place of birth for the foreign-born population - Fiji (%)
Place of birth for the foreign-born population - Micronesia (%)
Place of birth for the foreign-born population - Bahamas (%)
Place of birth for the foreign-born population - Barbados (%)
Place of birth for the foreign-born population - Cuba (%)
Place of birth for the foreign-born population - Dominica (%)
Place of birth for the foreign-born population - Dominican Republic (%)
Place of birth for the foreign-born population - Grenada (%)
Place of birth for the foreign-born population - Haiti (%)
Place of birth for the foreign-born population - Jamaica (%)
Place of birth for the foreign-born population - St. Vincent and the Grenadines (%)
Place of birth for the foreign-born population - Trinidad and Tobago (%)
Place of birth for the foreign-born population - West Indies (%)
Place of birth for the foreign-born population - Other Caribbean (%)
Place of birth for the foreign-born population - Belize (%)
Place of birth for the foreign-born population - Costa Rica (%)
Place of birth for the foreign-born population - El Salvador (%)
Place of birth for the foreign-born population - Guatemala (%)
Place of birth for the foreign-born population - Honduras (%)
Place of birth for the foreign-born population - Mexico (%)
Place of birth for the foreign-born population - Nicaragua (%)
Place of birth for the foreign-born population - Panama (%)
Place of birth for the foreign-born population - Other Central America (%)
Place of birth for the foreign-born population - Argentina (%)
Place of birth for the foreign-born population - Bolivia (%)
Place of birth for the foreign-born population - Brazil (%)
Place of birth for the foreign-born population - Chile (%)
Place of birth for the foreign-born population - Colombia (%)
Place of birth for the foreign-born population - Ecuador (%)
Place of birth for the foreign-born population - Guyana (%)
Place of birth for the foreign-born population - Peru (%)
Place of birth for the foreign-born population - Uruguay (%)
Place of birth for the foreign-born population - Venezuela (%)
Place of birth for the foreign-born population - Other South America (%)
Place of birth for the foreign-born population - Canada (%)
Place of birth for the foreign-born population - Other Northern America (%)
Place of birth for the foreign-born population - Other (%)
Latest news about races in Colesville, MD collected exclusively by city-data.com from local newspapers, TV, and radio stations
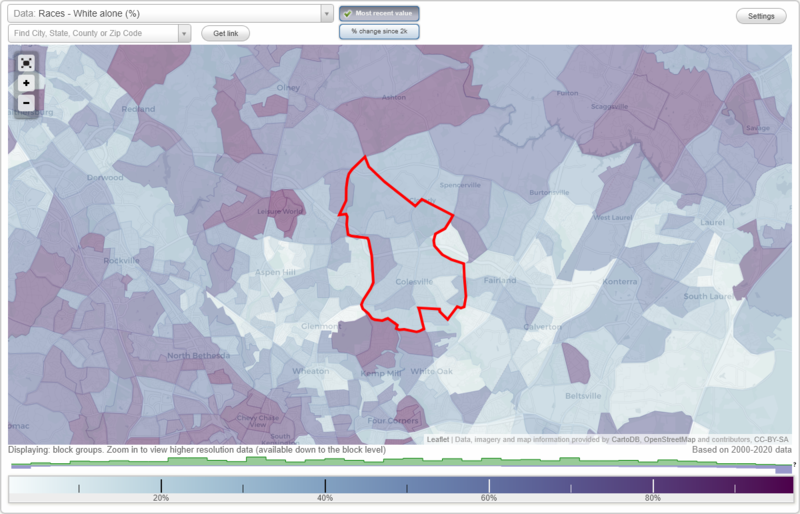
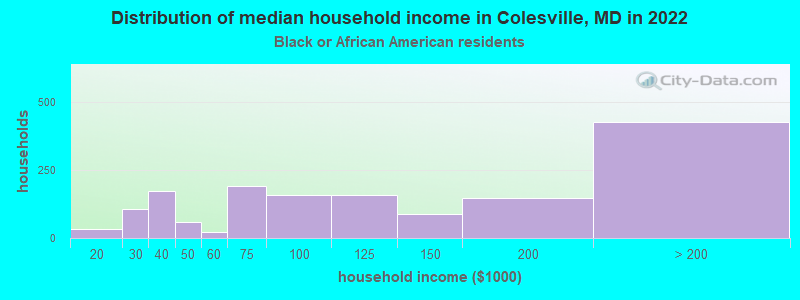
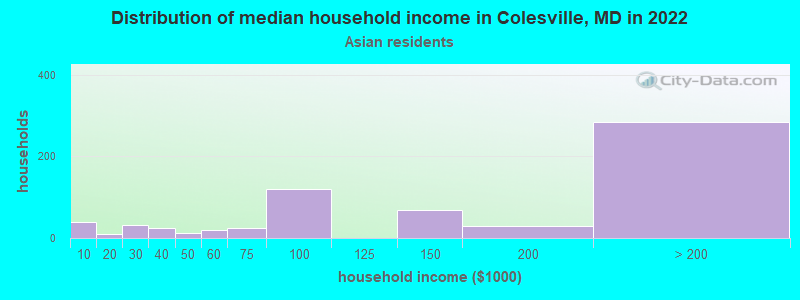
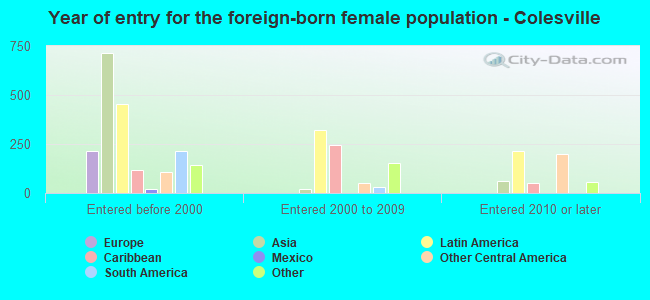
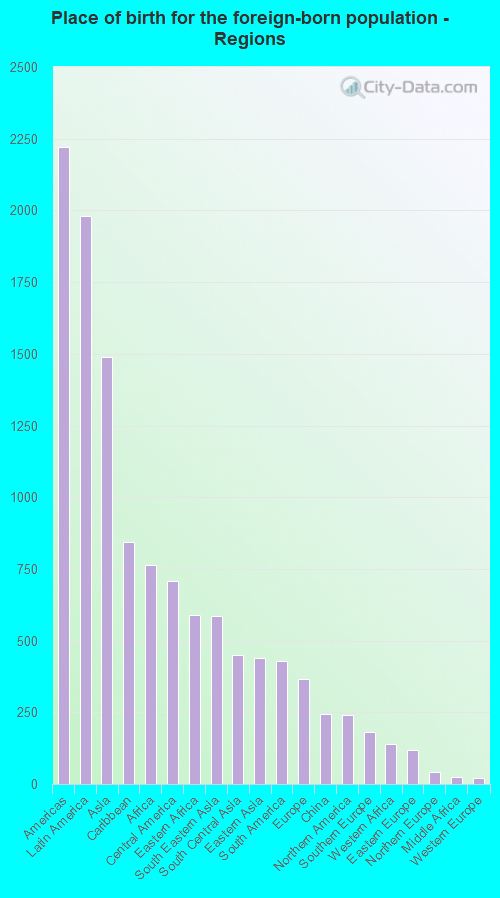
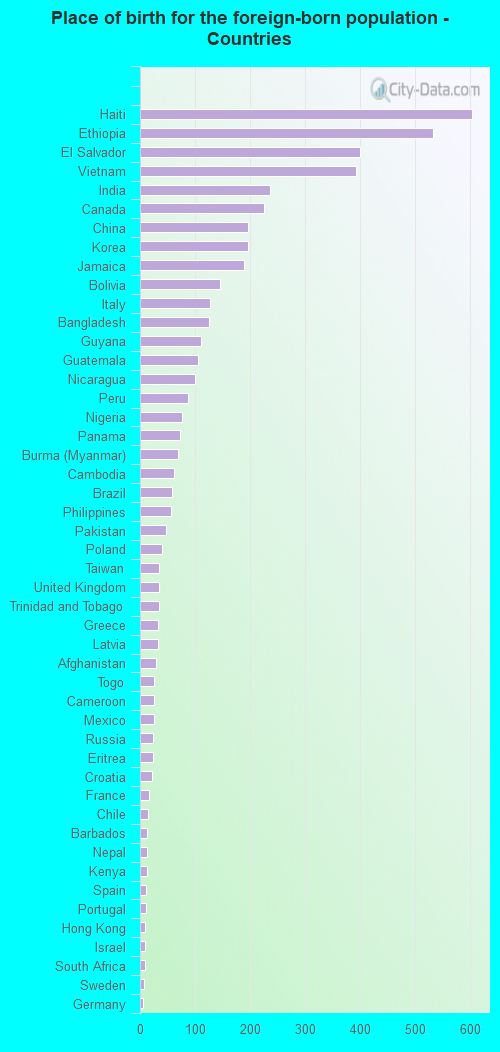
According to 2022 data, the most numerous races in Colesville, MD are White alone (4,612 residents), Black alone (4,281 residents), and Hispanic (1,935 residents). 58.0% of Colesville residents speak English at home. 35.5% of Colesville, MD residents are foreign-born (13.9% born in Latin America, 10.5% born in Asia, 5.3% born in Africa), which is 54.9% greater than the foreign-born rate of 16.0% across the entire state of Maryland.
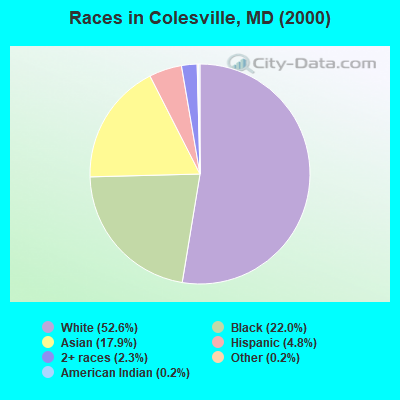
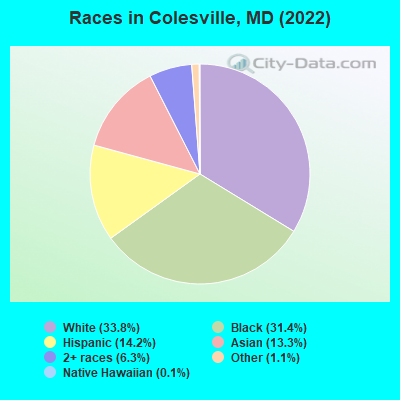
Race distribution in Colesville
2000 2022
3,286,547 62.1% White alone 1,464,735 27.7% Black alone 227,916 4.3% Hispanic 209,738 4.0% Asian alone 82,946 1.6% Two or more races 13,312 0.3% American Indian alone 9,379 0.2% Other race alone 1,913 0.04% Native Hawaiian and Other
2,906,492 47.1% White alone 1,800,914 29.2% Black alone 705,842 11.4% Hispanic 401,818 6.5% Asian alone 291,317 4.7% Two or more races 46,930 0.8% Other race alone 8,930 0.1% American Indian alone 2,417 0.04% Native Hawaiian and Other
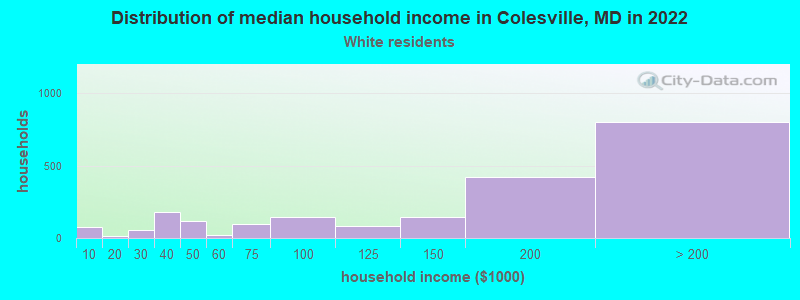
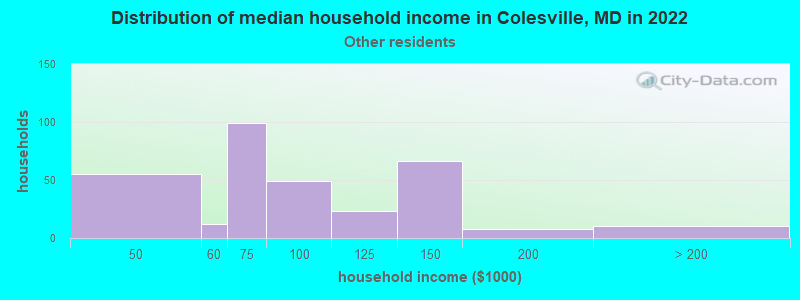
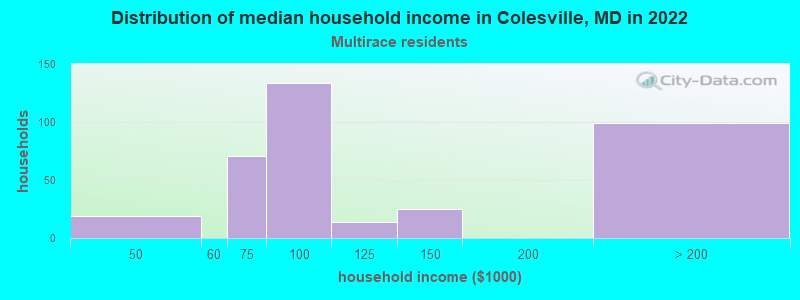
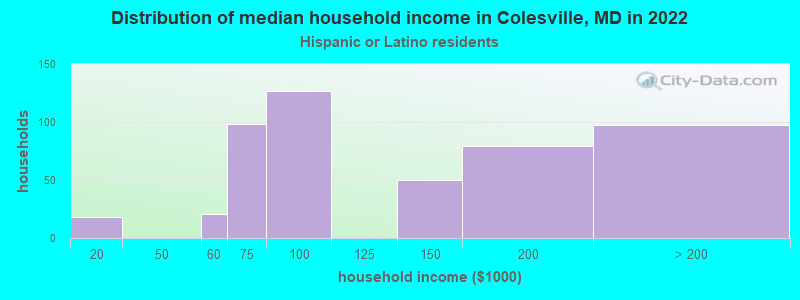
Income and house value in Colesville Median household income in 2022 $159,865 White non-Hispanic householders$98,723 Black householders$142,522 Asian householders$80,826 Some other race householders$89,724 Two or more races householders$117,629 Hispanic or Latino race householdersMedian 2022 house value $588,167 White Non-Hispanic householders$562,946 Black or African American householders$202,241 American Indian or Alaska Native householders $623,856 Asian householders$327,156 Native Hawaiian and other Pacific Islander householders$480,384 Some other race householders$576,984 Two or more races householders$490,852 Hispanic or Latino householders
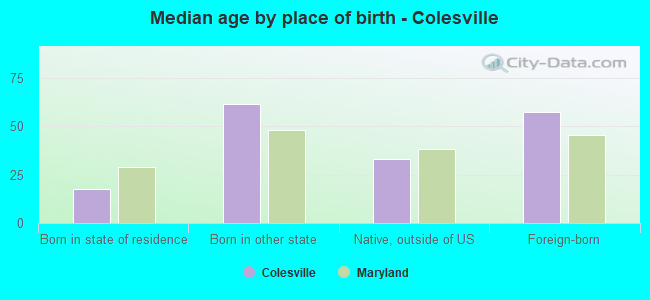
Median age by race in Colesville
59.3 Median age for White residents56.5 61.9 48.0 Median age for Black or African American residents43.4 49.2 -610,526,315.2 Median age for American Indian / Alaska Native residents-555,555,555.0 -671,704,449.4 63.5 Median age for Asian residents59.9 67.6 -763,333,332.6 Median age for Native Hawaiian / Pacific Islander residents-720,061,021.4 -760,942,760.2 32.3 Median age for Other race residents41.3 31.1 41.8 Median age for Two or more races residents32.9 47.3 61.4 Median age for White alone residents59.6 63.0 33.4 Median age for Hispanic or Latino residents41.8 33.0
Owner/renter occupied households by race in Colesville
House owners and renters - White residents 1,916 89.7% Owner occupied219 10.3% Renter occupiedHouse owners and renters - Black or African American residents 1,345 83.2% Owner occupied272 16.8% Renter occupiedHouse owners and renters - American Indian / Alaska Native residents 12 100.0% Owner occupiedHouse owners and renters - Asian residents 687 92.7% Owner occupied54 7.3% Renter occupiedHouse owners and renters - Other race residents 208 72.7% Owner occupied78 27.3% Renter occupiedHouse owners and renters - Two or more races residents 320 88.6% Owner occupied41 11.4% Renter occupiedHouse owners and renters - White alone residents 1,830 89.5% Owner occupied215 10.5% Renter occupiedHouse owners and renters - Hispanic or Latino residents 375 79.5% Owner occupied97 20.5% Renter occupied
Language usage in Colesville
English speakers - Total 58.0% of residents of Colesville speak English at home.
12.6% of residents speak Spanish at home 965 58.0% Speak English very well698 42.0% Speak English less than very well29.4% of residents speak other language at home 2,616 67.2% Speak English very well1,277 32.8% Speak English less than very well
English speakers - Born in the United States 88.4% of residents of Colesville speak English at home.
7.2% of residents speak Spanish at home 357 96.5% Speak English very well13 3.5% Speak English less than very well4.5% of residents speak other language at home 206 87.7% Speak English very well29 12.3% Speak English less than very well
English speakers - Native, born elsewhere 57.7% of residents of Colesville speak English at home.
4.5% of residents speak Spanish at home 18 100.0% Speak English very well34.4% of residents speak other language at home 139 100.0% Speak English very well
English speakers - Foreign-born 18.1% of residents of Colesville speak English at home.
21.9% of residents speak Spanish at home 372 35.2% Speak English very well686 64.8% Speak English less than very well59.7% of residents speak other language at home 1,768 61.3% Speak English very well1,118 38.7% Speak English less than very well
White (Caucasian) - Speak only English Native:
95.2% (4,021)Foreign-born:
25.0% (178)
White (Caucasian) - Speak another language Native:
5.5% (231)Foreign-born:
75.8% (539)
Black or African American - Speak only English Native:
76.7% (1,861)Foreign-born:
19.1% (311)
Black or African American - Speak another language Native:
24.4% (591)Foreign-born:
81.4% (1,323)
Asian - Speak only English Native:
61.0% (232)Foreign-born:
15.1% (217)
Asian - Speak another language Native:
36.2% (138)Foreign-born:
85.0% (1,217)
Other race - Speak only English Native:
19.9% (132)Foreign-born:
17.4% (97)
Other race - Speak another language Native:
79.0% (524)Foreign-born:
80.4% (447)
Two or more races - Speak only English Native:
81.6% (543)Foreign-born:
16.0% (68)
Two or more races - Speak another language Native:
14.3% (95)Foreign-born:
84.3% (357)
White alone - Speak only English Native:
93.5% (3,942)Foreign-born:
25.9% (80)
White alone - Speak another language Native:
6.4% (271)Foreign-born:
73.8% (228)
Hispanic or Latino - Speak only English Native:
28.3% (210)Foreign-born:
9.1% (106)
Hispanic or Latino - Speak another language Native:
71.4% (532)Foreign-born:
90.5% (1,055)
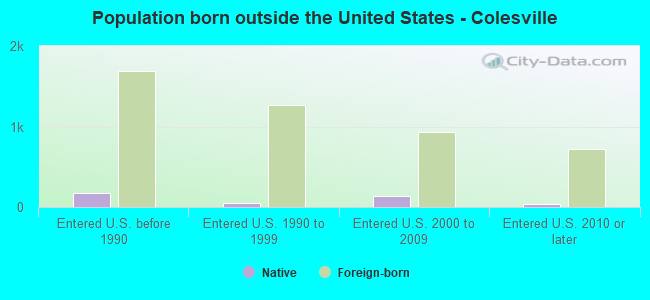
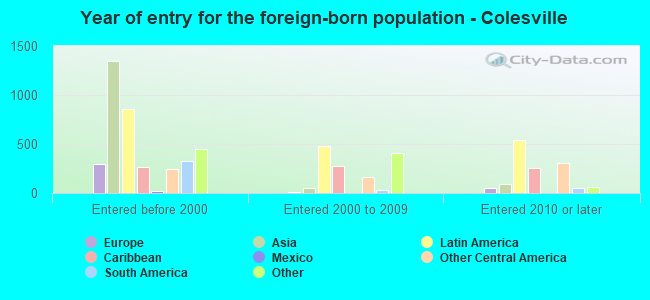
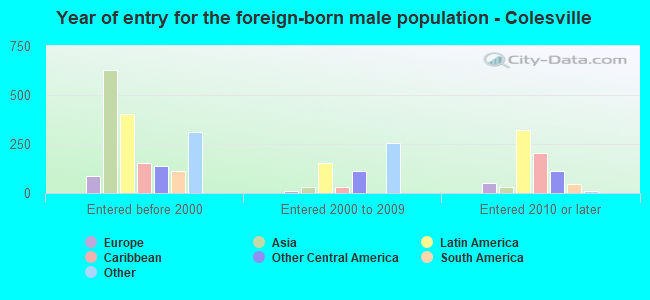
Foreign-born residents in Colesville 4,841 residents are foreign born (13.9% Latin America , 10.5% Asia , 5.3% Africa ).
This city:
35.5%Maryland:
15.7%
Marital status for residents in Colesville Marital status - White (Caucasian) population 15 years and over
Males 28.0% Never married61.4% Now married0.4% Separated3.5% Widowed6.6% DivorcedFemales 23.6% Never married55.3% Now married0.9% Separated11.2% Widowed9.0% DivorcedWomen who gave birth in the past 12 months Now married:
100.0% (52)Unmarried:
0.0% (0)
Women who did not give birth in the past 12 months Now married:
35.5% (246)Unmarried:
64.5% (447)
Marital status - Black or African American population 15 years and over
Males 32.5% Never married41.3% Now married1.9% Separated4.8% Widowed19.5% DivorcedFemales 28.3% Never married47.1% Now married0.3% Separated11.7% Widowed12.6% DivorcedWomen who gave birth in the past 12 months Now married:
82.2% (37)Unmarried:
17.8% (8)
Women who did not give birth in the past 12 months Now married:
46.0% (375)Unmarried:
54.0% (440)
Marital status - Asian population 15 years and over
Males 19.9% Never married64.3% Now married0.5% Separated4.2% Widowed11.1% DivorcedFemales 7.1% Never married69.4% Now married0.0% Separated12.1% Widowed11.4% DivorcedWomen who did not give birth in the past 12 months Now married:
60.9% (98)Unmarried:
39.1% (63)
Marital status - Other race population 15 years and over
Males 35.2% Never married52.7% Now married0.0% Separated0.0% Widowed12.2% DivorcedFemales 23.6% Never married67.3% Now married0.0% Separated0.0% Widowed9.1% DivorcedWomen who gave birth in the past 12 months Now married:
100.0% (51)Unmarried:
0.0% (0)
Women who did not give birth in the past 12 months Now married:
52.2% (103)Unmarried:
47.8% (94)
Marital status - Two or more races population 15 years and over
Males 26.6% Never married73.4% Now married0.0% Separated0.0% Widowed0.0% DivorcedFemales 41.8% Never married39.9% Now married0.0% Separated0.0% Widowed18.3% DivorcedWomen who did not give birth in the past 12 months Now married:
36.3% (95)Unmarried:
63.7% (167)
Marital status - White alone, not Hispanic / Latino population 15 years and over
Males 23.4% Never married66.8% Now married0.5% Separated4.1% Widowed5.1% DivorcedFemales 19.9% Never married57.7% Now married1.0% Separated12.3% Widowed9.2% DivorcedWomen who gave birth in the past 12 months Now married:
100.0% (57)Unmarried:
0.0% (0)
Women who did not give birth in the past 12 months Now married:
42.1% (259)Unmarried:
57.9% (356)
Marital status - Hispanic or Latino population 15 years and over
Males 38.3% Never married49.2% Now married0.0% Separated0.0% Widowed12.5% DivorcedFemales 31.7% Never married61.2% Now married0.0% Separated1.3% Widowed5.8% DivorcedWomen who gave birth in the past 12 months Now married:
100.0% (42)Unmarried:
0.0% (0)
Women who did not give birth in the past 12 months Now married:
39.7% (127)Unmarried:
60.3% (192)
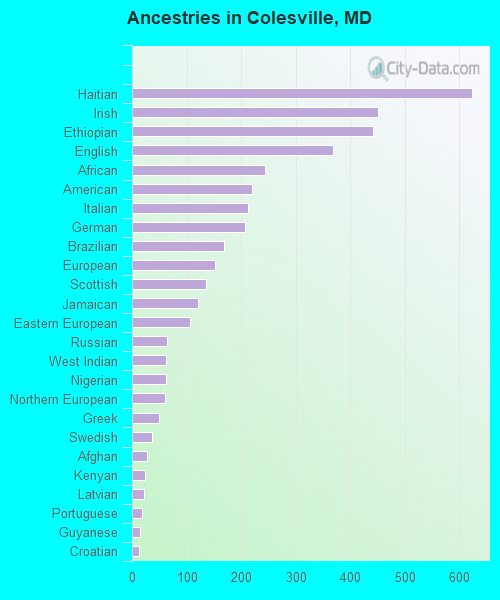
Ancestries in Colesville
623 7.3% Haitian451 5.3% Irish441 5.2% Ethiopian369 4.3% English243 2.9% African219 2.6% American212 2.5% Italian207 2.4% German168 2.0% Brazilian152 1.8% European136 1.6% Scottish121 1.4% Jamaican107 1.3% Eastern European65 0.8% Russian63 0.7% West Indian62 0.7% Nigerian60 0.7% Northern European49 0.6% Greek36 0.4% Swedish27 0.3% Afghan24 0.3% Kenyan22 0.3% Latvian19 0.2% Portuguese14 0.2% Guyanese13 0.2% Croatian12 0.1% Barbadian11 0.1% South African9 0.1% British9 0.1% Trinidadian and Tobagonian8 0.09% Polish5 0.06% Dutch5 0.06% U.S. Virgin Islander2 0.02% Liberian
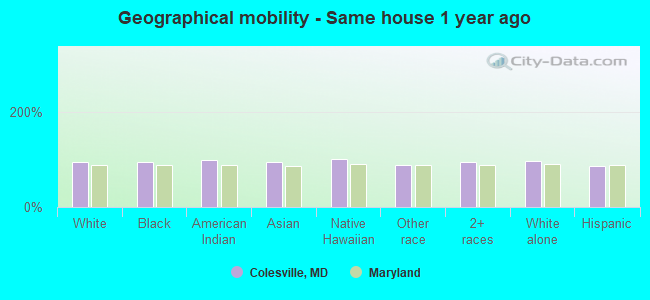
Geographical mobility in Colesville Same house 1 year ago 4,648 94.1% White (Caucasian)3,970 93.7% Black or African American13 98.9% American Indian / Alaska Native1,717 94.7% Asian30 100.0% Native Hawaiian / Pacific Islander1,111 88.7% Other race1,124 94.9% Two or more races4,423 97.0% White alone, not Hispanic / Latino1,633 84.6% Hispanic or LatinoMoved within same county 88 1.8% White / Caucasian148 3.5% Black or African American49 2.7% Asian63 5.1% Other race28 2.4% Two or more races59 1.3% White alone, not Hispanic / Latino84 4.4% Hispanic or LatinoMoved within same state 126 2.6% White / Caucasian41 1.0% Black or African American7 0.4% Asian26 0.6% White alone, not Hispanic / Latino150 7.8% Hispanic or LatinoMoved from different state 68 1.4% White / Caucasian8 0.2% Black or African American18 1.0% Asian35 3.0% Two or more races71 1.6% White alone, not Hispanic / LatinoMoved from abroad 18 0.4% White131 3.1% Black or African American57 4.6% Other race21 0.5% White alone, not Hispanic / Latino67 3.5% Hispanic or Latino
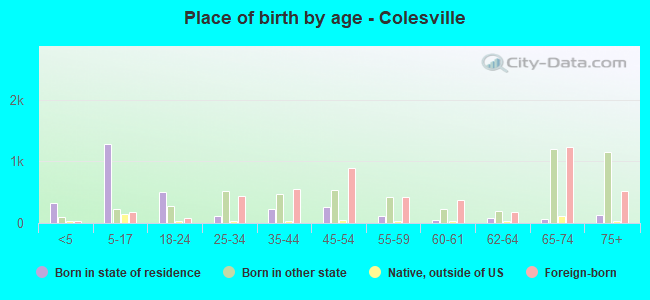
Children Nativity (place of birth) in Colesville
Children under 6 years - Living with two parents Both parents native 201 100.0% NativeBoth parents foreign-born 85 100.0% NativeOne native, one foreign-born parent 17 100.0% NativeChildren under 6 years - Living with one parent Native parent 31 100.0% NativeForeign-born parent 18 100.0% NativeChildren 6 to 17 years - Living with two parents Both parents native 459 100.0% NativeBoth parents foreign-born 359 100.0% NativeOne native, one foreign-born parent 79 100.0% NativeChildren 6 to 17 years - Living with one parent Native parent 85 100.0% NativeForeign-born parent 567 54.7% Native469 45.3% Foreign-born
Grandparents responsible for own grandchildren in Colesville
Grandparents (30 to 59 years) White / Caucasian 4 100.0% Responsible for grandchildrenBlack or African American 52 100.0% Responsible for grandchildrenAsian 11 100.0% Not responsible for grandchildrenWhite alone, not Hispanic / Latino 4 100.0% Responsible for grandchildrenGrandparents (60 years and over) White / Caucasian 9 8.7% Responsible for grandchildren91 91.3% Not responsible for grandchildrenBlack or African American 31 48.8% Responsible for grandchildren32 51.2% Not responsible for grandchildrenAsian 193 100.0% Not responsible for grandchildrenWhite alone, not Hispanic / Latino 7 5.8% Responsible for grandchildren113 94.2% Not responsible for grandchildren