Races in College, Alaska (AK) Detailed Stats
Ancestries, Foreign-born residents, place of birth
Settings
X


Recent posts about races in College, Alaska on our local forum with over 2,400,000 registered users:
 | Utilities in Fairbanks (13 replies) |
| Japanese in Fairbanks area/Interior AK (28 replies) |
| Greetings from Fairbanks (2 replies) |
| For Fairbanksians.... (16 replies) |
| Fairbanks - Advice on neighbourhoods (17 replies) |
| What is in Fairbanks? (21 replies) |
Latest news about races in College, AK collected exclusively by city-data.com from local newspapers, TV, and radio stations
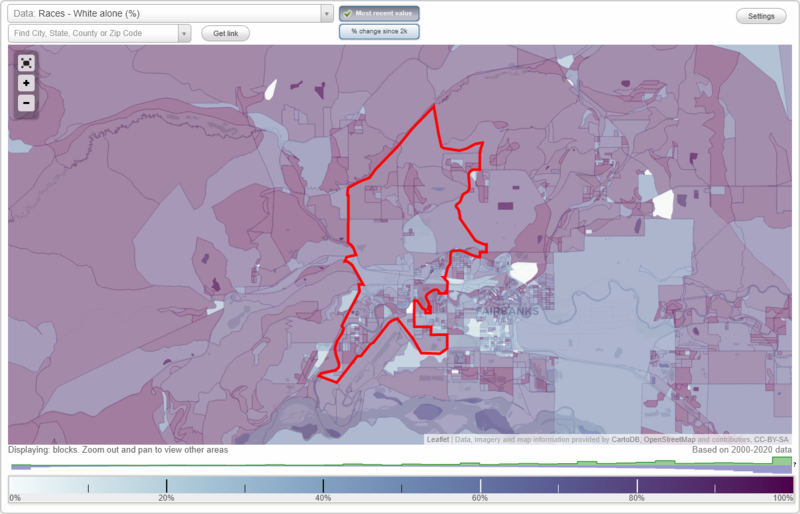
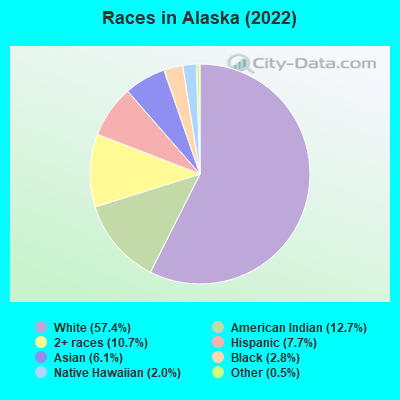
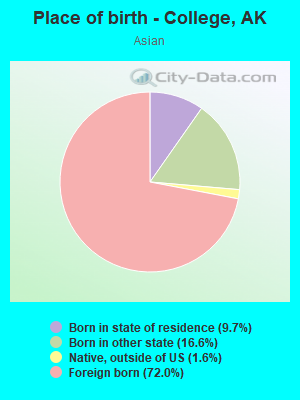
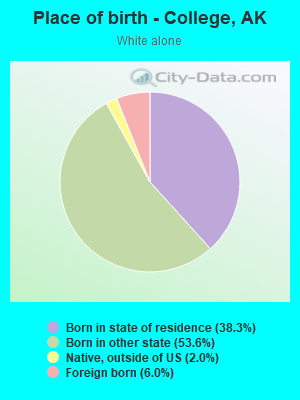
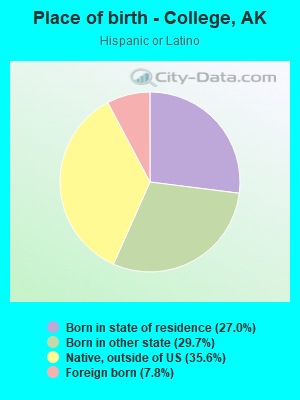
According to 2022 data, the most numerous races in College, AK are White alone (8,539 residents), American Indian alone (862 residents), and Two or more races (1,099 residents). 83.5% of College residents speak English at home. 9.8% of College, AK residents are foreign-born (4.7% born in Asia, 3.0% born in Europe, 1.1% born in North America), which is 28.6% greater than the foreign-born rate of 7.0% across the entire state of Alaska.
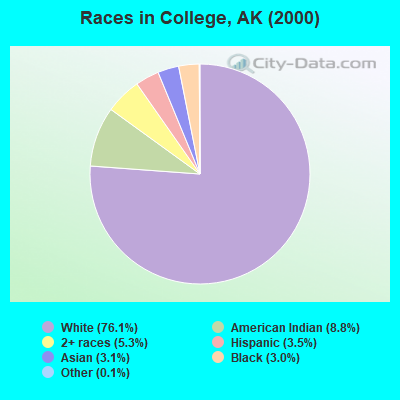
Race distribution in College
2000
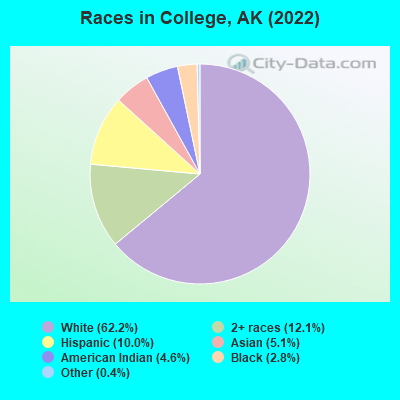
2022

- 8,67776.1%White alone
- 1,0068.8%American Indian alone
- 6045.3%Two or more races
- 3963.5%Hispanic
- 3573.1%Asian alone
- 3383.0%Black alone
- 170.1%Other race alone
- 70.06%Native Hawaiian and Other
Pacific Islander alone
-
- 8,53967.5%White alone
- 1,0998.7%Two or more races
- 8626.8%American Indian alone
- 7916.3%Hispanic
- 7976.3%Asian alone
- 3152.5%Black alone
- 490.4%Native Hawaiian and Other
Pacific Islander alone
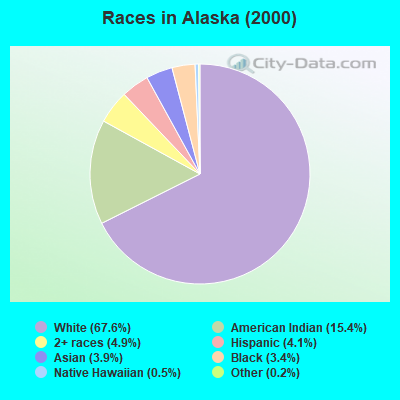
2000
2022
-
- 423,78867.6%White alone
- 96,50515.4%American Indian alone
- 30,4544.9%Two or more races
- 25,8524.1%Hispanic
- 24,7413.9%Asian alone
- 21,0733.4%Black alone
- 3,1810.5%Native Hawaiian and Other
Pacific Islander alone - 1,3380.2%Other race alone
-
- 421,10457.4%White alone
- 93,29412.7%American Indian alone
- 78,55210.7%Two or more races
- 56,4917.7%Hispanic
- 44,9056.1%Asian alone
- 20,6642.8%Black alone
- 14,5392.0%Native Hawaiian and Other
Pacific Islander alone - 4,0340.5%Other race alone
Income and house value in College
- Median household income in 2022
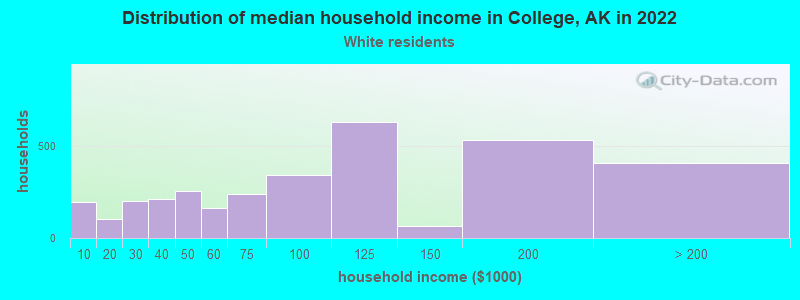
- $94,169White non-Hispanic householders
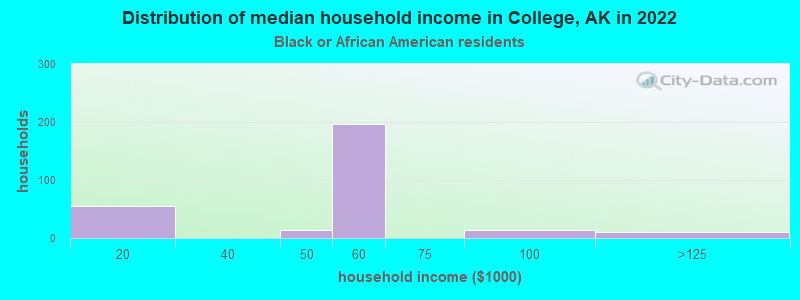
- $117,157Black householders
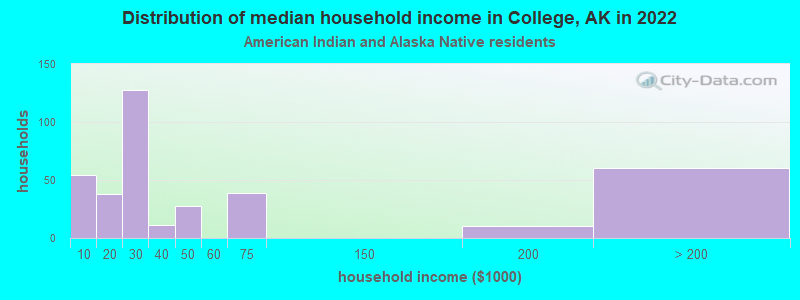
- $88,020American Indian and Alaska Native householders
- $96,563Asian householders
- $15,786Native Hawaiian and other Pacific Islander householders
- $27,268Some other race householders
- $89,249Two or more races householders
- $58,951Hispanic or Latino race householders
- Median 2022 house value
- $356,515White Non-Hispanic householders
- $418,795Black or African American householders
- $324,885American Indian or Alaska Native householders
- $319,736Asian householders
- $91,948Native Hawaiian and other Pacific Islander householders
- $239,066Some other race householders
- $358,967Two or more races householders
- $347,443Hispanic or Latino householders
Household income for White non-Hispanic householders
Household income for Black householders
Household income for American Indian and Alaska Native householders
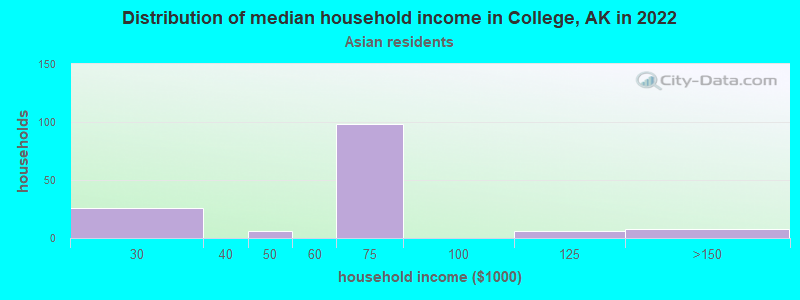
Household income for Asian householders
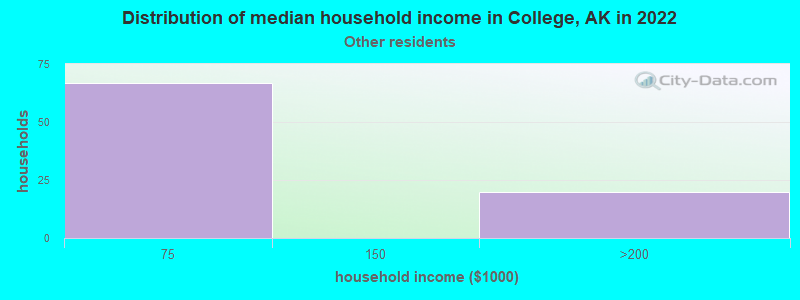
Household income for Some other race householders
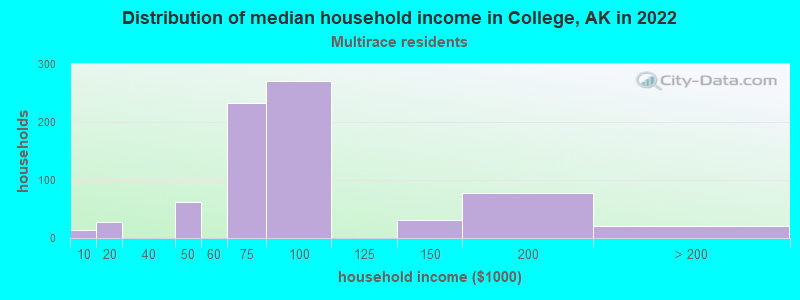
Household income for Two or more races householders
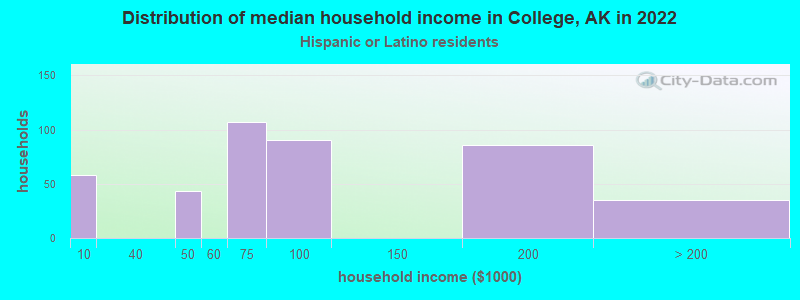
Household income for Hispanic or Latino race householders
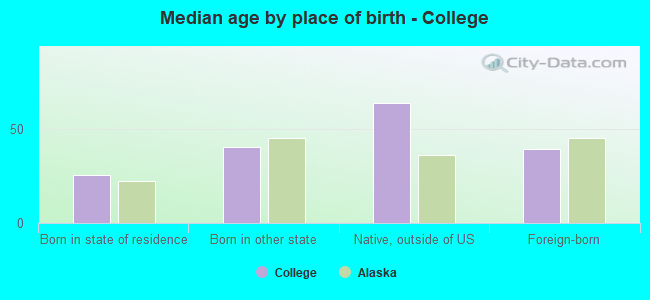
Median age by race in College
- 34.4Median age for White residents
- 32.8Males
- 36.8Females
- 70.5Median age for Black or African American residents
- 57.7Males
- 78.8Females
- 31.0Median age for American Indian / Alaska Native residents
- 20.8Males
- 36.9Females
- 32.1Median age for Asian residents
- 39.2Males
- 26.9Females
- 49.5Median age for Native Hawaiian / Pacific Islander residents
- 49.8Median age for Other race residents
- 24.7Median age for Two or more races residents
- 20.3Males
- 24.5Females
- 33.9Median age for White alone residents
- 34.4Males
- 33.6Females
- 30.4Median age for Hispanic or Latino residents
- 21.2Males
- 90.4Females
Owner/renter occupied households by race in College
- House owners and renters - White residents
- 2,70870.6%Owner occupied
- 1,12529.4%Renter occupied
- House owners and renters - Black or African American residents
- 6340.8%Owner occupied
- 9259.2%Renter occupied
- House owners and renters - American Indian / Alaska Native residents
- 22870.6%Owner occupied
- 9529.4%Renter occupied
- House owners and renters - Asian residents
- 14072.1%Owner occupied
- 5427.9%Renter occupied
- House owners and renters - Other race residents
- 111100.0%Owner occupied
- House owners and renters - Two or more races residents
- 18443.6%Owner occupied
- 23856.4%Renter occupied
- House owners and renters - White alone residents
- 2,62770.3%Owner occupied
- 1,11229.7%Renter occupied
- House owners and renters - Hispanic or Latino residents
- 15573.7%Owner occupied
- 5526.3%Renter occupied
Language usage in College
- English speakers - Total
- 83.5% of residents of College speak English at home.
- 3.9% of residents speak Spanish at home
- 34975.5%Speak English very well
- 11324.5%Speak English less than very well
- 12.6% of residents speak other language at home
- 1,10674.1%Speak English very well
- 38625.9%Speak English less than very well
- English speakers - Born in the United States
- 92.6% of residents of College speak English at home.
- 2.1% of residents speak Spanish at home
- 12199.2%Speak English very well
- 10.8%Speak English less than very well
- 5.4% of residents speak other language at home
- 21669.7%Speak English very well
- 9430.3%Speak English less than very well
- English speakers - Native, born elsewhere
- 44.6% of residents of College speak English at home.
- 44.8% of residents speak Spanish at home
- 15064.4%Speak English very well
- 8335.6%Speak English less than very well
- 12.1% of residents speak other language at home
- 5587.3%Speak English very well
- 812.7%Speak English less than very well
- English speakers - Foreign-born
- 26.1% of residents of College speak English at home.
- 3.9% of residents speak Spanish at home
- 1225.5%Speak English very well
- 3574.5%Speak English less than very well
- 72.1% of residents speak other language at home
- 56864.8%Speak English very well
- 30835.2%Speak English less than very well
White (Caucasian) - Speak only English
| Native: | 91.7% (7,250) |
| Foreign-born: | 41.5% (144) |
White (Caucasian) - Speak another language
| Native: | 8.5% (668) |
| Foreign-born: | 61.1% (213) |
Black or African American - Speak another language
| Native: | 1.3% (4) |
| Foreign-born: | 83.0% (16) |
Asian - Speak only English
| Native: | 60.9% (160) |
| Foreign-born: | 6.1% (34) |
Asian - Speak another language
| Native: | 39.3% (104) |
| Foreign-born: | 91.2% (510) |
Other race - Speak another language
| Native: | 37.6% (41) |
| Foreign-born: | 93.8% (47) |
White alone - Speak only English
| Native: | 94.7% (6,943) |
| Foreign-born: | 40.3% (160) |
White alone - Speak another language
| Native: | 5.2% (379) |
| Foreign-born: | 63.0% (250) |
Hispanic or Latino - Speak only English
| Native: | 52.9% (382) |
| Foreign-born: | 19.6% (12) |
Hispanic or Latino - Speak another language
| Native: | 48.1% (347) |
| Foreign-born: | 79.8% (50) |
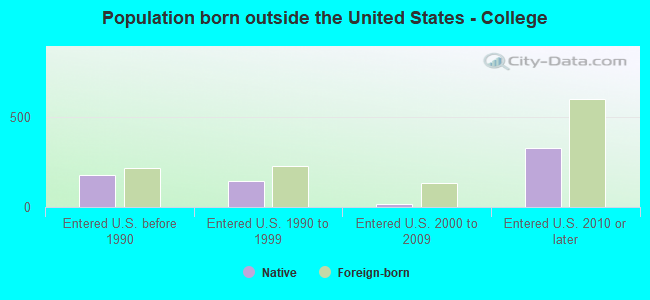
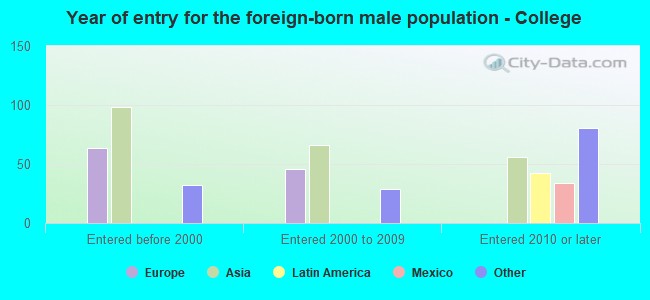
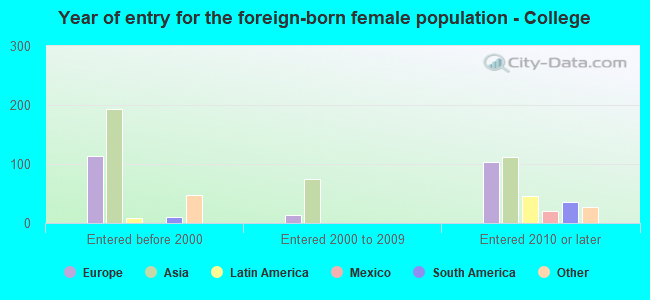
Foreign-born residents in College
1,223 residents are foreign born (4.7% Asia, 3.0% Europe, 1.1% North America).
| This city: | 9.8% |
| Alaska: | 100.0% |

Marital status for residents in College
Marital status - White (Caucasian) population 15 years and over
- Males
- 44.7%Never married
- 45.6%Now married
- 1.4%Separated
- 1.0%Widowed
- 7.3%Divorced
- Females
- 28.7%Never married
- 47.4%Now married
- 1.2%Separated
- 4.8%Widowed
- 17.9%Divorced
Women who gave birth in the past 12 months
| Now married: | 100.0% (221) |
| Unmarried: | 0.0% (0) |
Women who did not give birth in the past 12 months
| Now married: | 37.9% (631) |
| Unmarried: | 62.1% (1,034) |
Marital status - Black or African American population 15 years and over
- Males
- 47.5%Never married
- 42.2%Now married
- 0.0%Separated
- 0.0%Widowed
- 10.2%Divorced
- Females
- 72.9%Never married
- 21.9%Now married
- 0.0%Separated
- 0.0%Widowed
- 5.2%Divorced
Women who did not give birth in the past 12 months
| Now married: | 0.0% (0) |
| Unmarried: | 100.0% (33) |
Marital status - American Indian / Alaska Native population 15 years and over
- Males
- 48.2%Never married
- 15.3%Now married
- 0.0%Separated
- 0.0%Widowed
- 36.5%Divorced
- Females
- 33.1%Never married
- 37.2%Now married
- 4.6%Separated
- 0.0%Widowed
- 25.1%Divorced
Women who gave birth in the past 12 months
| Now married: | 100.0% (29) |
| Unmarried: | 0.0% (0) |
Women who did not give birth in the past 12 months
| Now married: | 23.5% (60) |
| Unmarried: | 76.5% (197) |
Marital status - Asian population 15 years and over
- Males
- 64.5%Never married
- 35.5%Now married
- 0.0%Separated
- 0.0%Widowed
- 0.0%Divorced
- Females
- 35.7%Never married
- 54.4%Now married
- 5.5%Separated
- 0.0%Widowed
- 4.5%Divorced
Women who gave birth in the past 12 months
| Now married: | 100.0% (27) |
| Unmarried: | 0.0% (0) |
Women who did not give birth in the past 12 months
| Now married: | 46.0% (104) |
| Unmarried: | 54.0% (121) |
Marital status - Native Hawaiian / Pacific Islander population 15 years and over
- Males
- 0.0%Never married
- 100.0%Now married
- 0.0%Separated
- 0.0%Widowed
- 0.0%Divorced
- Females
- 3.8%Never married
- 96.2%Now married
- 0.0%Separated
- 0.0%Widowed
- 0.0%Divorced
Women who did not give birth in the past 12 months
| Now married: | 96.2% (32) |
| Unmarried: | 3.8% (1) |
Marital status - Other race population 15 years and over
- Males
- 28.6%Never married
- 71.4%Now married
- 0.0%Separated
- 0.0%Widowed
- 0.0%Divorced
- Females
- 0.0%Never married
- 28.8%Now married
- 0.0%Separated
- 0.0%Widowed
- 71.2%Divorced
Women who did not give birth in the past 12 months
| Now married: | 100.0% (21) |
| Unmarried: | 0.0% (0) |
Marital status - Two or more races population 15 years and over
- Males
- 74.5%Never married
- 22.1%Now married
- 0.0%Separated
- 0.0%Widowed
- 3.5%Divorced
- Females
- 74.5%Never married
- 19.6%Now married
- 0.2%Separated
- 0.0%Widowed
- 5.7%Divorced
Women who did not give birth in the past 12 months
| Now married: | 6.5% (28) |
| Unmarried: | 93.5% (399) |
Marital status - White alone, not Hispanic / Latino population 15 years and over
- Males
- 43.4%Never married
- 46.6%Now married
- 1.5%Separated
- 1.0%Widowed
- 7.5%Divorced
- Females
- 28.9%Never married
- 48.9%Now married
- 1.3%Separated
- 5.2%Widowed
- 15.7%Divorced
Women who gave birth in the past 12 months
| Now married: | 100.0% (221) |
| Unmarried: | 0.0% (0) |
Women who did not give birth in the past 12 months
| Now married: | 39.9% (619) |
| Unmarried: | 60.1% (933) |
Marital status - Hispanic or Latino population 15 years and over
- Males
- 64.6%Never married
- 35.4%Now married
- 0.0%Separated
- 0.0%Widowed
- 0.0%Divorced
- Females
- 22.8%Never married
- 30.9%Now married
- 0.0%Separated
- 0.0%Widowed
- 46.2%Divorced
Women who did not give birth in the past 12 months
| Now married: | 19.9% (27) |
| Unmarried: | 80.1% (108) |
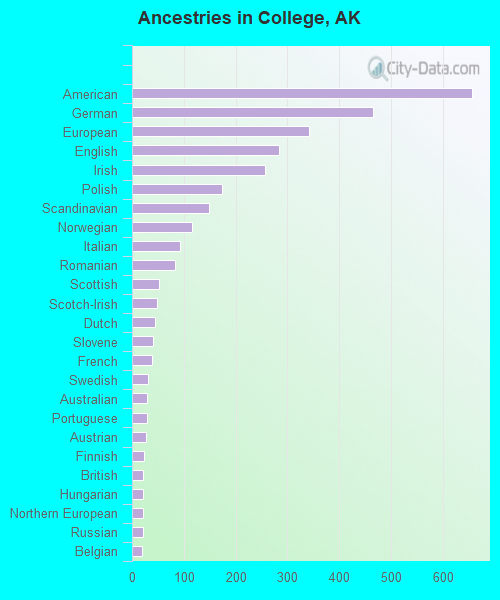
Ancestries in College

- 61911.4%German
- 2624.8%American
- 2474.6%Irish
- 2344.3%English
- 1793.3%European
- 1442.7%Northern European
- 1422.6%Ukrainian
- 1312.4%Scandinavian
- 1001.8%Italian
- 631.2%Norwegian
- 611.1%Scottish
- 521.0%Polish
- 510.9%Danish
- 480.9%British
- 480.9%Swedish
- 460.8%Portuguese
- 430.8%Scotch-Irish
- 410.8%African
- 350.6%French Canadian
- 340.6%Slavic
- 330.6%Austrian
- 290.5%Romanian
- 280.5%Slovene
- 270.5%French
- 240.4%Czech
- 240.4%Eastern European
- 240.4%Swiss
- 230.4%West Indian
- 190.4%Finnish
- 190.4%Dutch
- 150.3%Albanian
- 50.09%Russian
- 20.04%Iranian
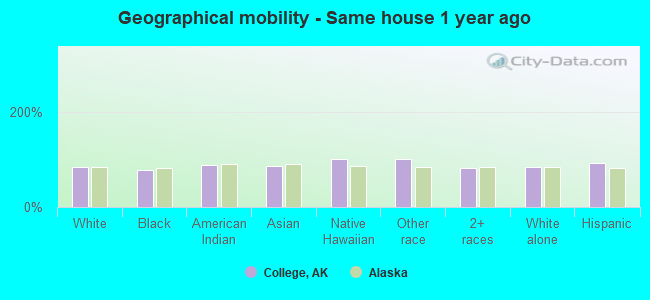
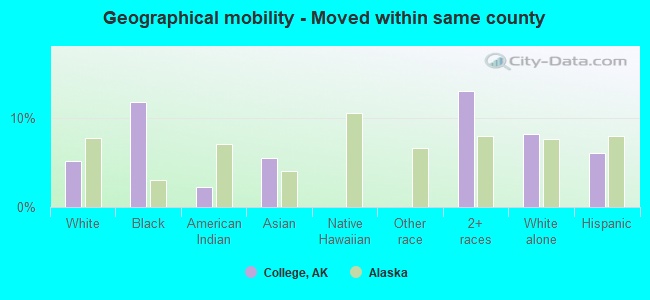
Geographical mobility in College

- Same house 1 year ago
- 7,41083.9%White (Caucasian)
- 25776.9%Black or African American
- 73289.0%American Indian / Alaska Native
- 66986.4%Asian
- 53100.0%Native Hawaiian / Pacific Islander
- 173100.0%Other race
- 1,09381.0%Two or more races
- 7,24484.4%White alone, not Hispanic / Latino
- 72292.8%Hispanic or Latino
-
- Moved within same county
- 4585.2%White / Caucasian
- 3911.8%Black or African American
- 182.2%American Indian / Alaska Native
- 425.5%Asian
- 17513.0%Two or more races
- 6978.1%White alone, not Hispanic / Latino
- 476.1%Hispanic or Latino
-
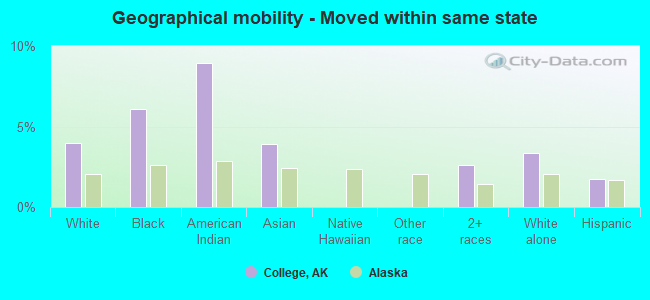
- Moved within same state
- 3504.0%White / Caucasian
- 206.1%Black or African American
- 749.0%American Indian / Alaska Native
- 303.9%Asian
- 352.6%Two or more races
- 2893.4%White alone, not Hispanic / Latino
- 131.7%Hispanic or Latino
-
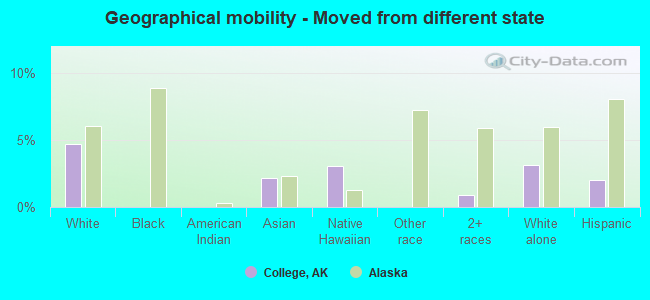
- Moved from different state
- 4124.7%White / Caucasian
- 172.2%Asian
- 13.0%Native Hawaiian / Pacific Islander
- 120.9%Two or more races
- 2673.1%White alone, not Hispanic / Latino
- 152.0%Hispanic or Latino
-
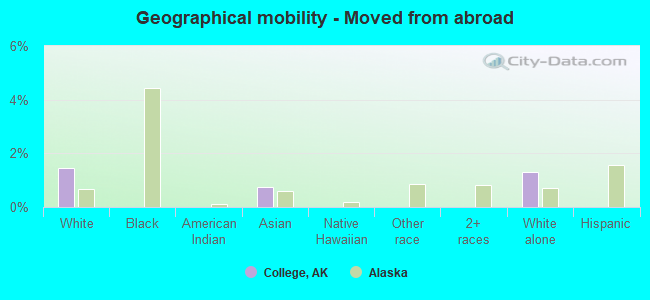
- Moved from abroad
- 1271.4%White
- 60.7%Asian
- 1111.3%White alone, not Hispanic / Latino
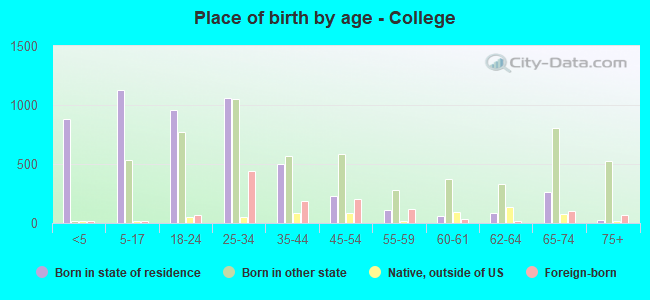
Children Nativity (place of birth) in College
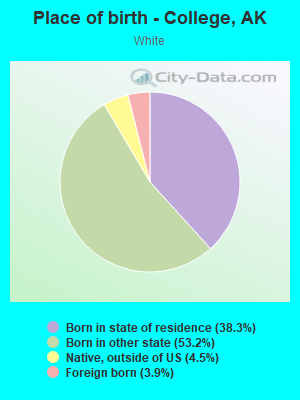
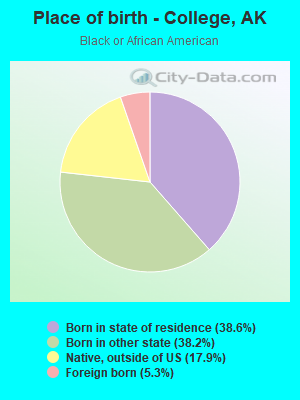
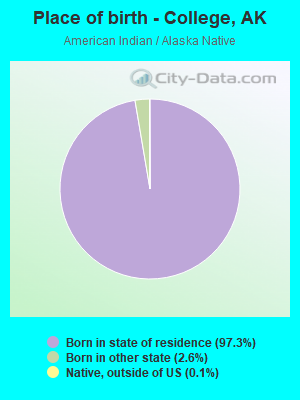
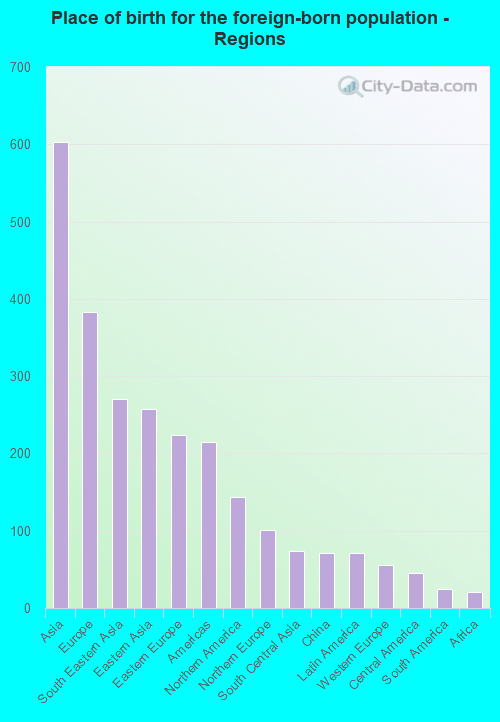
Place of birth for residents in College
![Place of birth for the foreign-born population - Regions]()
- 603Asia
- 383Europe
- 270South Eastern Asia
- 258Eastern Asia
- 224Eastern Europe
- 215Americas
- 144Northern America
- 101Northern Europe
- 74South Central Asia
- 71China
- 71Latin America
- 55Western Europe
- 45Central America
- 25South America
- 21Africa
- 5Western Africa
- 2Southern Europe
- 2Eastern Africa
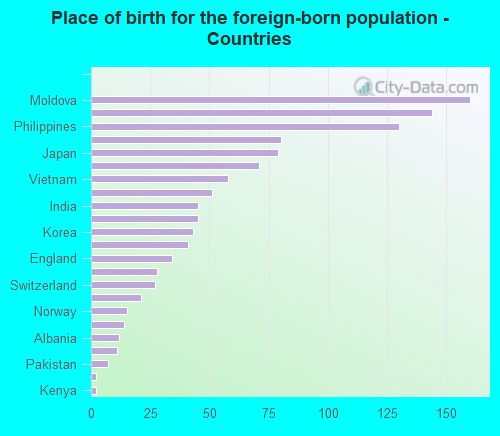
![Place of birth for the foreign-born population - Countries]()
- 160Moldova
- 144Canada
- 130Philippines
- 80Thailand
- 79Japan
- 71China
- 58Vietnam
- 51Ukraine
- 45India
- 45Mexico
- 43Korea
- 41Denmark
- 34England
- 28Germany
- 27Switzerland
- 21Nepal
- 15Norway
- 14Peru
- 12Albania
- 11Colombia
- 7Pakistan
- 2Greece
- 2Kenya
Grandparents responsible for own grandchildren in College
Zip codes: 99775.