Races in Collinsville, Oklahoma (OK) Detailed Stats
Ancestries, Foreign-born residents, place of birth
Settings
X


Recent posts about races in Collinsville, Oklahoma on our local forum with over 2,400,000 registered users:
 | Looking to move to Bartlesville-Tulsa (34 replies) |
| Where do we live?? Moving from WA (16 replies) |
| How is the speeding situation down 44 and 40, in OK? (8 replies) |
| Rental Homes in Owasso, Collinsville areas (3 replies) |
| What about living in collinsville??? (29 replies) |
| What's going on in Collinsville and Skiatook? (6 replies) |
Latest news about races in Collinsville, OK collected exclusively by city-data.com from local newspapers, TV, and radio stations
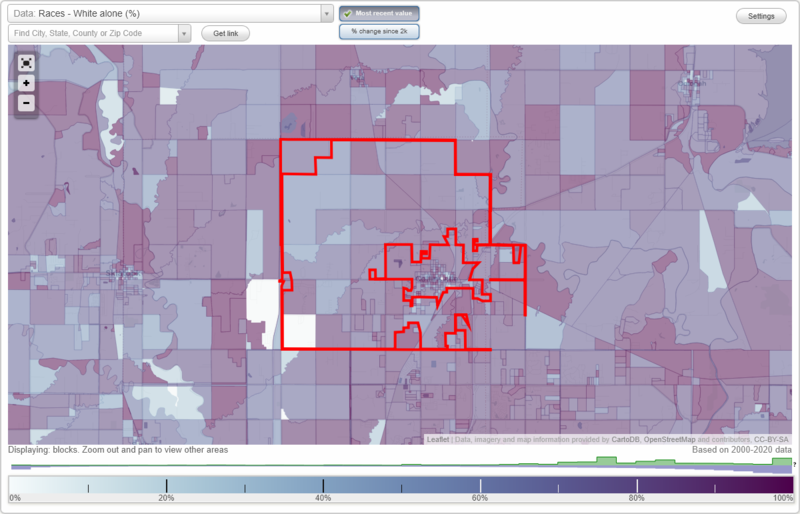
According to 2022 data, the most numerous races in Collinsville, OK are White alone (5,482 residents), Hispanic (297 residents), and Two or more races (1,024 residents). 95.4% of Collinsville residents speak English at home. 2.1% of Collinsville, OK residents are foreign-born (1.0% born in Asia, 0.6% born in Latin America, 0.5% born in Europe), which is 181.9% less than the foreign-born rate of 6.0% across the entire state of Oklahoma.
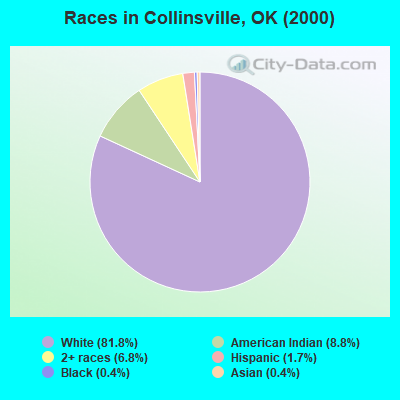
Race distribution in Collinsville
2000
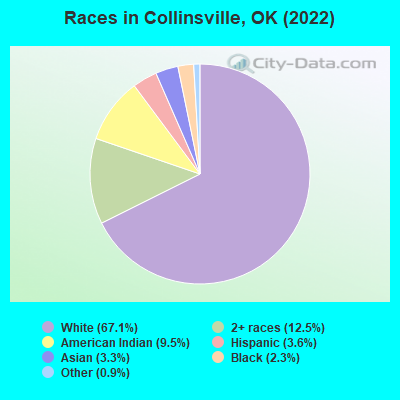
2022

- 3,33781.8%White alone
- 3578.8%American Indian alone
- 2796.8%Two or more races
- 701.7%Hispanic
- 150.4%Black alone
- 150.4%Asian alone
- 40.10%Native Hawaiian and Other
Pacific Islander alone
-
- 5,48267.1%White alone
- 1,02412.5%Two or more races
- 7769.5%American Indian alone
- 2973.6%Hispanic
- 2673.3%Asian alone
- 1892.3%Black alone
- 700.9%Other race alone
2000
2022
-
- 2,556,36874.1%White alone
- 266,1587.7%American Indian alone
- 257,9817.5%Black alone
- 179,3045.2%Hispanic
- 140,2494.1%Two or more races
- 46,1721.3%Asian alone
- 2,3220.07%Other race alone
- 2,1000.06%Native Hawaiian and Other
Pacific Islander alone

-
- 2,517,40362.6%White alone
- 486,69212.1%Hispanic
- 364,4539.1%Two or more races
- 273,6506.8%American Indian alone
- 268,5436.7%Black alone
- 92,6722.3%Asian alone
- 10,7860.3%Other race alone
- 5,6010.1%Native Hawaiian and Other
Pacific Islander alone

Income and house value in Collinsville
- Median household income in 2022
- $73,860White non-Hispanic householders
- $56,687American Indian and Alaska Native householders
- $126,262Some other race householders
- $82,770Two or more races householders
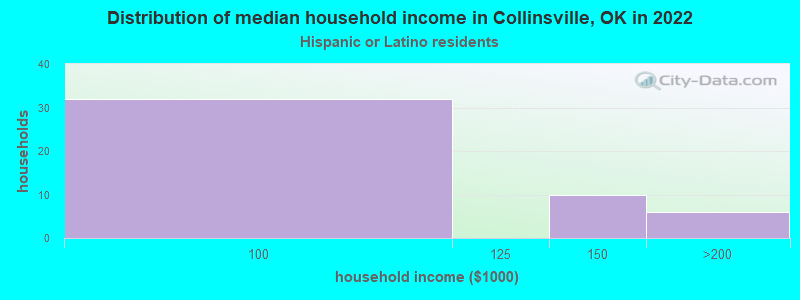
- $92,616Hispanic or Latino race householders
- Median 2022 house value
- $217,226White Non-Hispanic householders
- $196,882American Indian or Alaska Native householders
- $369,154Asian householders
- $246,102Two or more races householders
- $278,916Hispanic or Latino householders
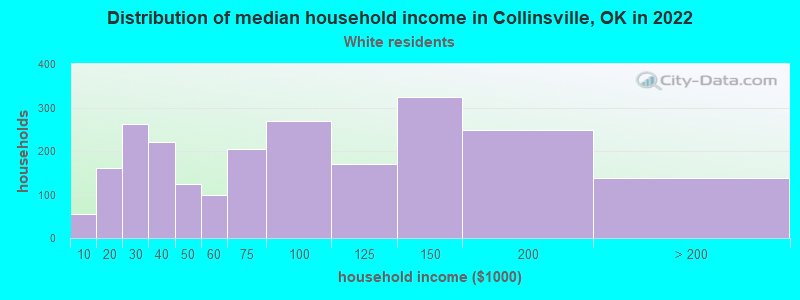
Household income for White non-Hispanic householders
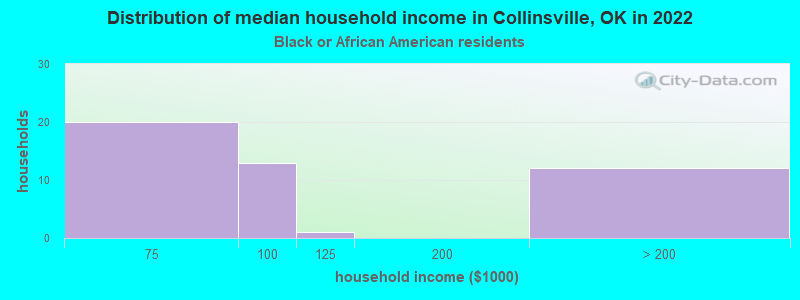
Household income for Black householders
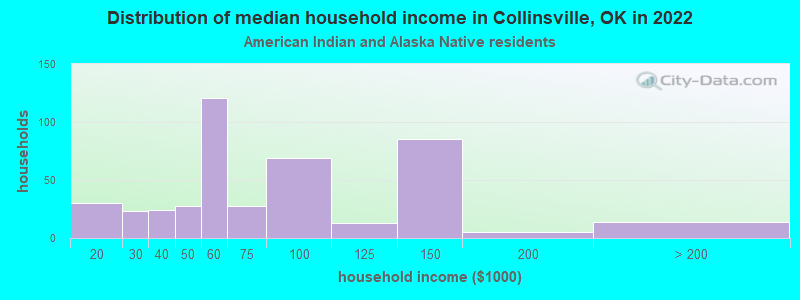
Household income for American Indian and Alaska Native householders
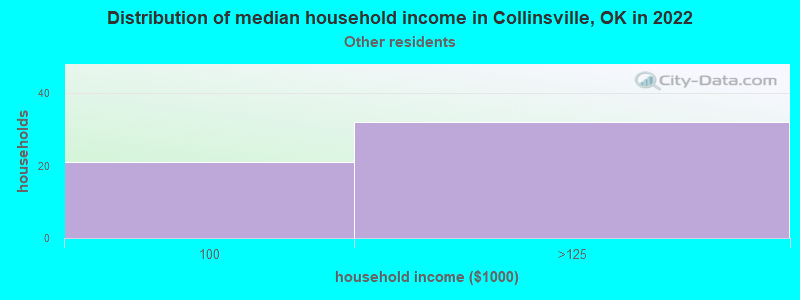
Household income for Some other race householders
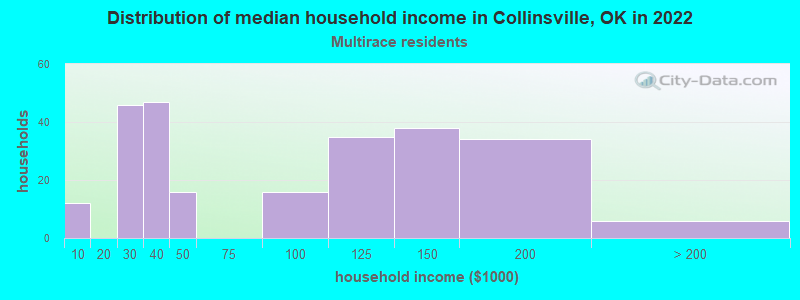
Household income for Two or more races householders
Household income for Hispanic or Latino race householders
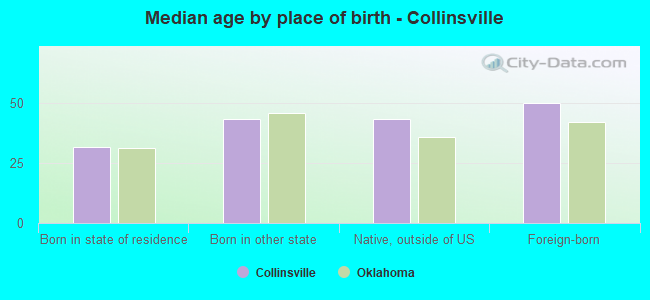
Median age by race in Collinsville
- 42.6Median age for White residents
- 41.8Males
- 43.0Females
- 35.4Median age for Black or African American residents
- 41.2Males
- 35.3Females
- 34.5Median age for American Indian / Alaska Native residents
- 33.9Males
- 45.1Females
- 17.1Median age for Asian residents
- 17.5Males
- 16.7Females
- -633,554,083.3Median age for Native Hawaiian / Pacific Islander residents
- -662,177,328.2Males
- -442,328,041.9Females
- 58.0Median age for Other race residents
- 57.0Males
- 61.0Females
- 21.6Median age for Two or more races residents
- 21.1Males
- 21.5Females
- 41.6Median age for White alone residents
- 41.0Males
- 42.1Females
- 32.0Median age for Hispanic or Latino residents
- 31.8Males
- 35.0Females
Owner/renter occupied households by race in Collinsville
- House owners and renters - White residents
- 1,70074.8%Owner occupied
- 57225.2%Renter occupied
- House owners and renters - Black or African American residents
- 57100.0%Owner occupied
- House owners and renters - American Indian / Alaska Native residents
- 32371.0%Owner occupied
- 13229.0%Renter occupied
- House owners and renters - Asian residents
- 36100.0%Owner occupied
- House owners and renters - Other race residents
- 68100.0%Owner occupied
- House owners and renters - Two or more races residents
- 16467.1%Owner occupied
- 8032.9%Renter occupied
- House owners and renters - White alone residents
- 1,72774.3%Owner occupied
- 59825.7%Renter occupied
- House owners and renters - Hispanic or Latino residents
- 48100.0%Owner occupied
Language usage in Collinsville
- English speakers - Total
- 95.4% of residents of Collinsville speak English at home.
- 1.7% of residents speak Spanish at home
- 10377.4%Speak English very well
- 3022.6%Speak English less than very well
- 2.7% of residents speak other language at home
- 11153.9%Speak English very well
- 9546.1%Speak English less than very well
- English speakers - Born in the United States
- 95.2% of residents of Collinsville speak English at home.
- 2.5% of residents speak Spanish at home
- 3958.2%Speak English very well
- 2841.8%Speak English less than very well
- 2.7% of residents speak other language at home
- 73100.0%Speak English very well
All residents speak only English at home
- English speakers - Foreign-born
- 19.2% of residents of Collinsville speak English at home.
- 25.8% of residents speak Spanish at home
- 3983.0%Speak English very well
- 817.0%Speak English less than very well
- 52.7% of residents speak other language at home
- 2728.1%Speak English very well
- 6971.9%Speak English less than very well
White (Caucasian) - Speak only English
| Native: | 100.0% (5,055) |
| Foreign-born: | 99.1% (27) |
White (Caucasian) - Speak another language
| Native: | 0.2% (10) |
| Foreign-born: | 33.1% (9) |
Asian - Speak only English
| Native: | 40.9% (87) |
| Foreign-born: | 11.9% (10) |
Asian - Speak another language
| Native: | 57.8% (123) |
| Foreign-born: | 87.8% (70) |
Other race - Speak another language
| Native: | 26.6% (39) |
| Foreign-born: | 100.0% (43) |
Two or more races - Speak another language
| Native: | 2.3% (26) |
| Foreign-born: | 100.0% (27) |
White alone - Speak only English
| Native: | 100.0% (5,159) |
| Foreign-born: | 71.3% (30) |
White alone - Speak another language
| Native: | 0.3% (13) |
| Foreign-born: | 34.5% (15) |
Hispanic or Latino - Speak another language
| Native: | 21.5% (49) |
| Foreign-born: | 100.0% (52) |
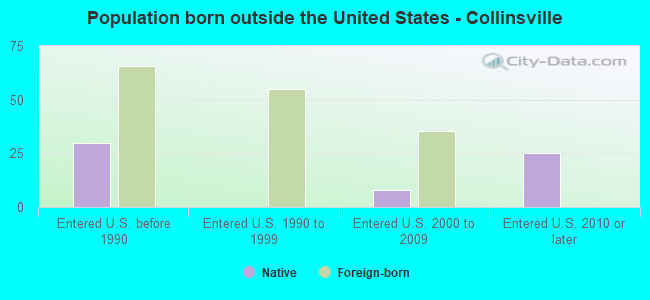
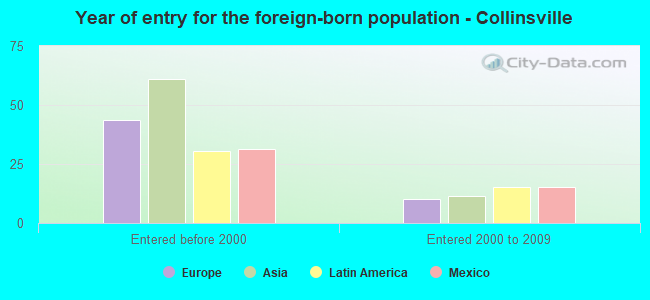
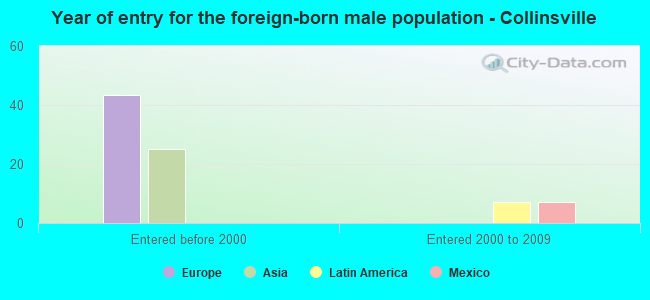
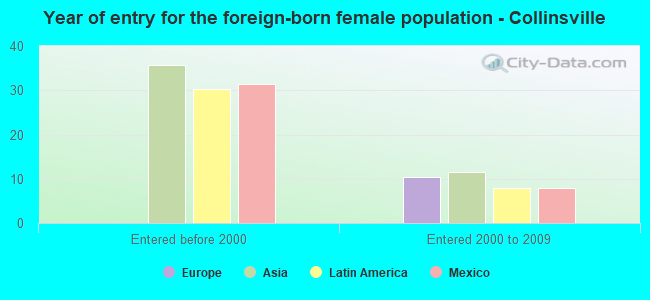
Foreign-born residents in Collinsville
174 residents are foreign born (1.0% Asia, 0.6% Latin America, 0.5% Europe).
| This city: | 2.1% |
| Oklahoma: | 6.1% |

Marital status for residents in Collinsville
Marital status - White (Caucasian) population 15 years and over
- Males
- 21.1%Never married
- 57.1%Now married
- 0.8%Separated
- 7.0%Widowed
- 14.0%Divorced
- Females
- 15.3%Never married
- 53.8%Now married
- 0.4%Separated
- 11.4%Widowed
- 19.1%Divorced
Women who gave birth in the past 12 months
| Now married: | 100.0% (29) |
| Unmarried: | 0.0% (0) |
Women who did not give birth in the past 12 months
| Now married: | 55.2% (571) |
| Unmarried: | 44.8% (464) |
Marital status - Black or African American population 15 years and over
- Males
- 72.7%Never married
- 10.6%Now married
- 0.0%Separated
- 0.0%Widowed
- 16.7%Divorced
- Females
- 46.9%Never married
- 50.0%Now married
- 0.0%Separated
- 0.0%Widowed
- 3.1%Divorced
Women who gave birth in the past 12 months
| Now married: | 0.0% (0) |
| Unmarried: | 100.0% (16) |
Marital status - American Indian / Alaska Native population 15 years and over
- Males
- 45.6%Never married
- 29.0%Now married
- 0.0%Separated
- 5.9%Widowed
- 19.5%Divorced
- Females
- 13.4%Never married
- 53.7%Now married
- 0.0%Separated
- 22.0%Widowed
- 10.9%Divorced
Women who gave birth in the past 12 months
| Now married: | 100.0% (8) |
| Unmarried: | 0.0% (0) |
Women who did not give birth in the past 12 months
| Now married: | 69.1% (116) |
| Unmarried: | 30.9% (52) |
Marital status - Asian population 15 years and over
- Males
- 42.1%Never married
- 57.9%Now married
- 0.0%Separated
- 0.0%Widowed
- 0.0%Divorced
- Females
- 47.9%Never married
- 42.7%Now married
- 0.0%Separated
- 9.4%Widowed
- 0.0%Divorced
Women who did not give birth in the past 12 months
| Now married: | 42.5% (36) |
| Unmarried: | 57.5% (49) |
Marital status - Other race population 15 years and over
- Males
- 0.0%Never married
- 69.4%Now married
- 0.0%Separated
- 0.0%Widowed
- 30.6%Divorced
- Females
- 14.0%Never married
- 50.5%Now married
- 0.0%Separated
- 0.0%Widowed
- 35.5%Divorced
Women who did not give birth in the past 12 months
| Now married: | 0.0% (0) |
| Unmarried: | 100.0% (60) |
Marital status - Two or more races population 15 years and over
- Males
- 46.1%Never married
- 42.9%Now married
- 0.0%Separated
- 0.0%Widowed
- 11.0%Divorced
- Females
- 43.1%Never married
- 48.6%Now married
- 0.0%Separated
- 8.0%Widowed
- 0.3%Divorced
Women who gave birth in the past 12 months
| Now married: | 58.8% (39) |
| Unmarried: | 41.2% (27) |
Women who did not give birth in the past 12 months
| Now married: | 44.9% (118) |
| Unmarried: | 55.1% (146) |
Marital status - White alone, not Hispanic / Latino population 15 years and over
- Males
- 21.3%Never married
- 57.5%Now married
- 0.8%Separated
- 6.5%Widowed
- 13.9%Divorced
- Females
- 15.3%Never married
- 53.8%Now married
- 0.4%Separated
- 11.4%Widowed
- 19.1%Divorced
Women who gave birth in the past 12 months
| Now married: | 100.0% (31) |
| Unmarried: | 0.0% (0) |
Women who did not give birth in the past 12 months
| Now married: | 55.2% (602) |
| Unmarried: | 44.8% (488) |
Marital status - Hispanic or Latino population 15 years and over
- Males
- 10.0%Never married
- 59.0%Now married
- 0.0%Separated
- 11.0%Widowed
- 20.0%Divorced
- Females
- 20.9%Never married
- 49.1%Now married
- 0.0%Separated
- 0.0%Widowed
- 30.0%Divorced
Women who did not give birth in the past 12 months
| Now married: | 28.2% (24) |
| Unmarried: | 71.8% (60) |
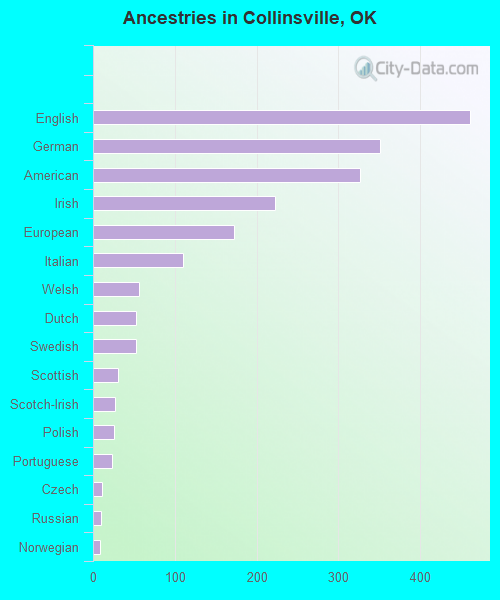
Ancestries in Collinsville

- 46112.7%English
- 3519.7%German
- 3269.0%American
- 2226.1%Irish
- 1724.7%European
- 1103.0%Italian
- 561.5%Welsh
- 531.5%Dutch
- 521.4%Swedish
- 310.9%Scottish
- 270.7%Scotch-Irish
- 260.7%Polish
- 230.6%Portuguese
- 110.3%Czech
- 100.3%Russian
- 80.2%Norwegian
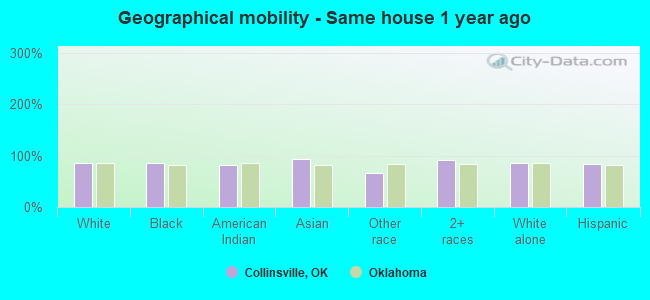
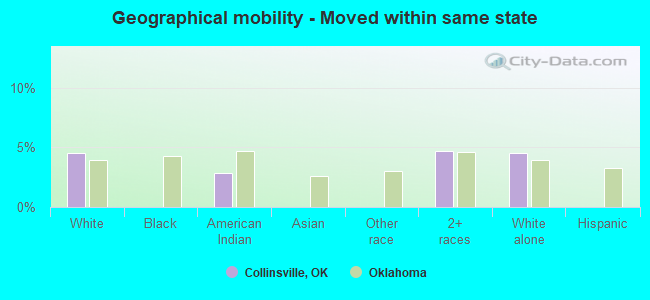
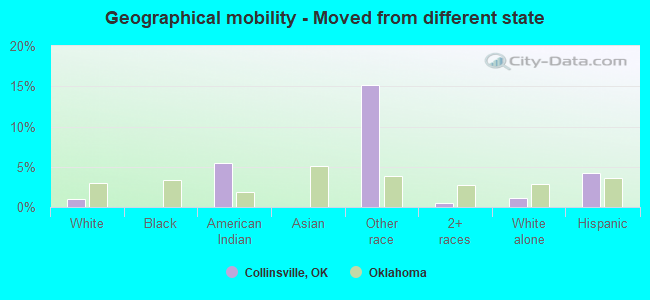
Geographical mobility in Collinsville

- Same house 1 year ago
- 4,48085.5%White (Caucasian)
- 14585.8%Black or African American
- 68382.7%American Indian / Alaska Native
- 25293.8%Asian
- 12666.3%Other race
- 1,20192.5%Two or more races
- 4,64885.2%White alone, not Hispanic / Latino
- 24883.6%Hispanic or Latino
-
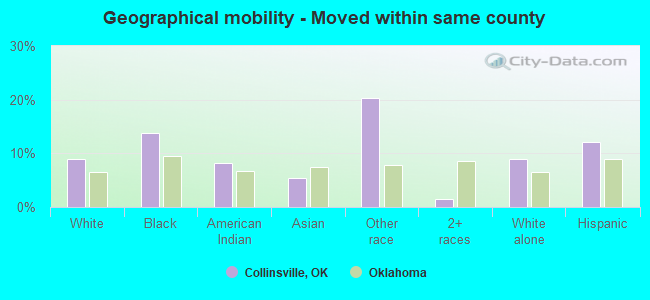
- Moved within same county
- 4719.0%White / Caucasian
- 2413.9%Black or African American
- 688.2%American Indian / Alaska Native
- 145.4%Asian
- 3920.3%Other race
- 191.5%Two or more races
- 4929.0%White alone, not Hispanic / Latino
- 3612.2%Hispanic or Latino
-
- Moved within same state
- 2364.5%White / Caucasian
- 232.8%American Indian / Alaska Native
- 614.7%Two or more races
- 2494.6%White alone, not Hispanic / Latino
-
- Moved from different state
- 541.0%White / Caucasian
- 455.5%American Indian / Alaska Native
- 2915.1%Other race
- 70.5%Two or more races
- 591.1%White alone, not Hispanic / Latino
- 134.3%Hispanic or Latino
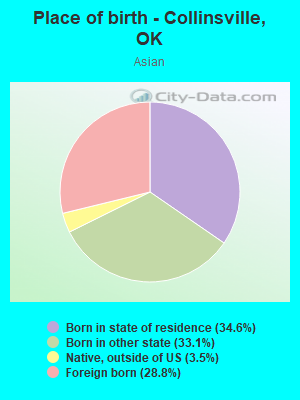
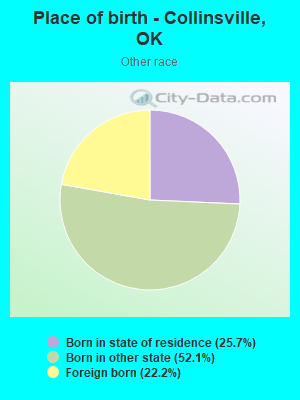
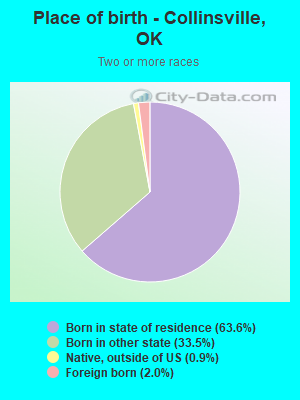
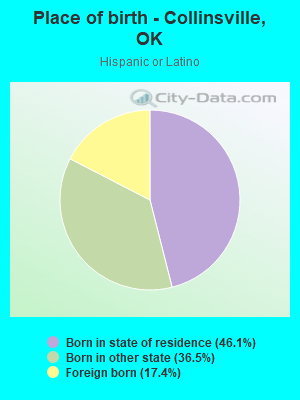
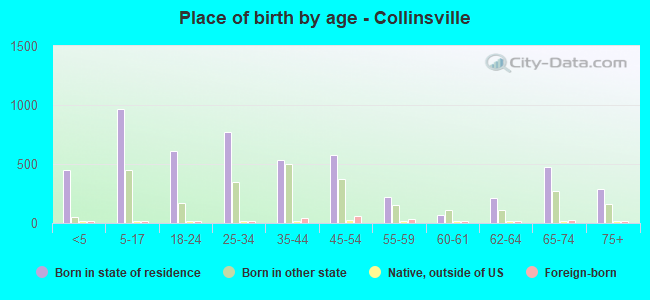
Children Nativity (place of birth) in Collinsville
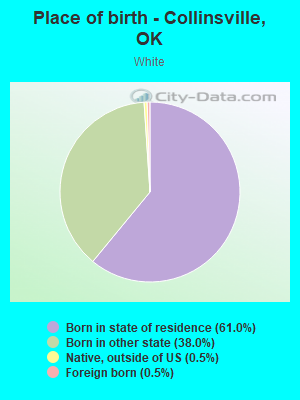
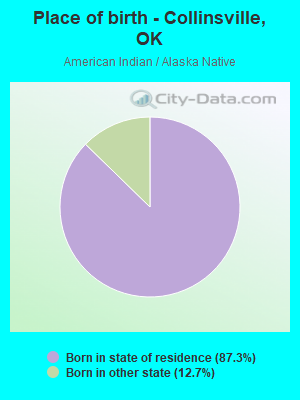
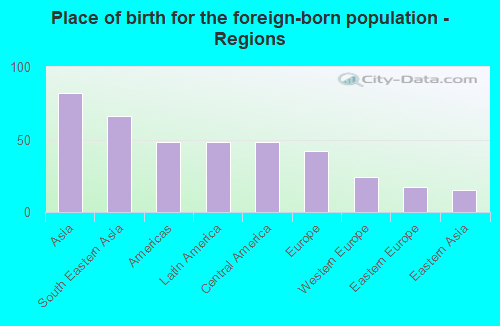
Place of birth for residents in Collinsville
![Place of birth for the foreign-born population - Regions]()
- 82Asia
- 66South Eastern Asia
- 48Americas
- 48Latin America
- 48Central America
- 42Europe
- 24Western Europe
- 17Eastern Europe
- 15Eastern Asia
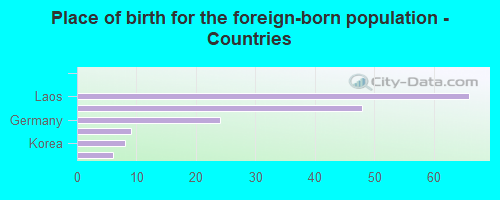
![Place of birth for the foreign-born population - Countries]()
- 66Laos
- 48Mexico
- 24Germany
- 9Serbia
- 8Korea
- 6Japan
Grandparents responsible for own grandchildren in Collinsville
Zip codes: 74021.