Races in Columbia, Pennsylvania (PA) Detailed Stats
Ancestries, Foreign-born residents, place of birth
Settings
X


Recent posts about races in Columbia, Pennsylvania on our local forum with over 2,400,000 registered users:
 | Philadelphia Mayor 2023 - Official Thread (589 replies) |
| PA Republicans bucking party to endorse Democrat Josh Shapiro for governor (284 replies) |
| Vetting John Fetterman (170 replies) |
| Public service announcement: Protest downtown tomorrow at 2:30pm (Sat 30th) (303 replies) |
| What are the chances of Trump winning Pennsylvania again in 2020 Election? (267 replies) |
| Muddled Messaging on Masks (71 replies) |
Latest news about races in Columbia, PA collected exclusively by city-data.com from local newspapers, TV, and radio stations
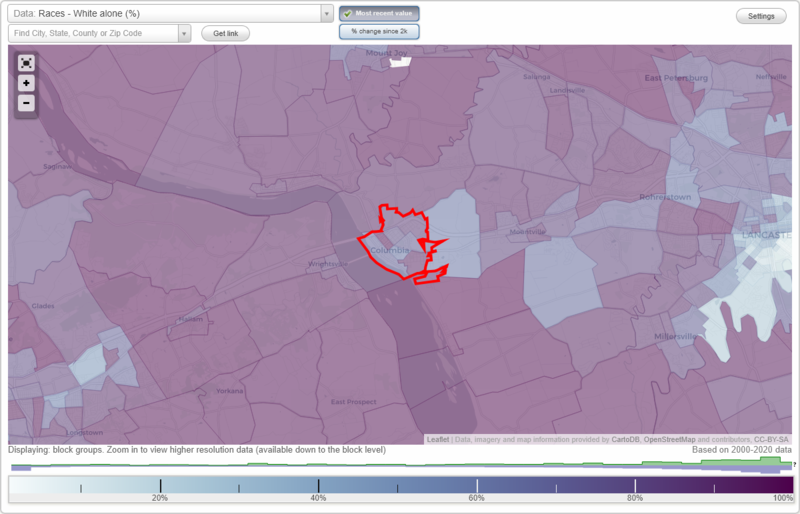
According to 2022 data, the most numerous races in Columbia, PA are White alone (7,043 residents), Black alone (588 residents), and Hispanic (2,485 residents). 86.1% of Columbia residents speak English at home. 4.2% of Columbia, PA residents are foreign-born (2.4% born in Latin America, 1.2% born in Africa), which is 66.7% less than the foreign-born rate of 7.0% across the entire state of Pennsylvania.
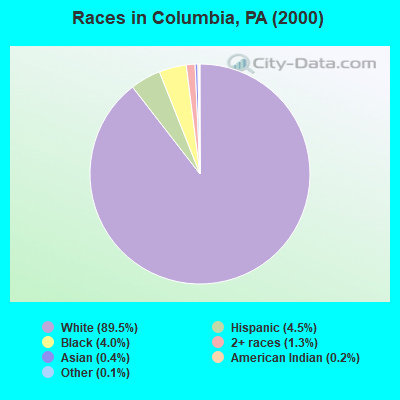
Race distribution in Columbia
2000
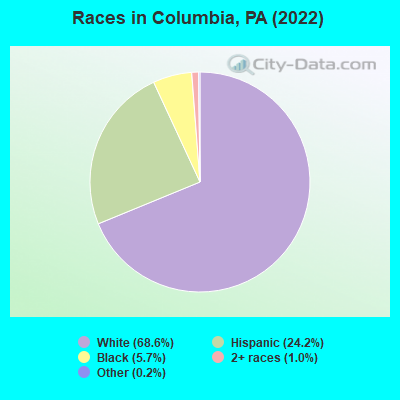
2022

- 9,22589.5%White alone
- 4634.5%Hispanic
- 4144.0%Black alone
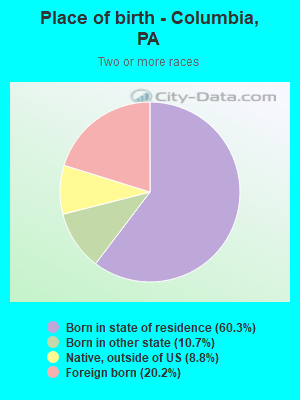
- 1351.3%Two or more races
- 420.4%Asian alone
- 180.2%American Indian alone
- 140.1%Other race alone
-
- 7,04368.6%White alone
- 2,48524.2%Hispanic
- 5885.7%Black alone
- 1051.0%Two or more races
- 190.2%Other race alone
- 80.08%American Indian alone
- 70.07%Asian alone
2000
2022
-
- 10,322,45584.1%White alone
- 1,202,4379.8%Black alone
- 394,0883.2%Hispanic
- 218,2961.8%Asian alone
- 113,0970.9%Two or more races
- 13,0860.1%Other race alone
- 14,9040.1%American Indian alone
- 2,6910.02%Native Hawaiian and Other
Pacific Islander alone

-
- 9,487,22873.1%White alone
- 1,311,58110.1%Black alone
- 1,115,9978.6%Hispanic
- 493,9423.8%Two or more races
- 487,1243.8%Asian alone
- 63,5820.5%Other race alone
- 10,1300.08%American Indian alone
- 2,4240.02%Native Hawaiian and Other
Pacific Islander alone

Income and house value in Columbia
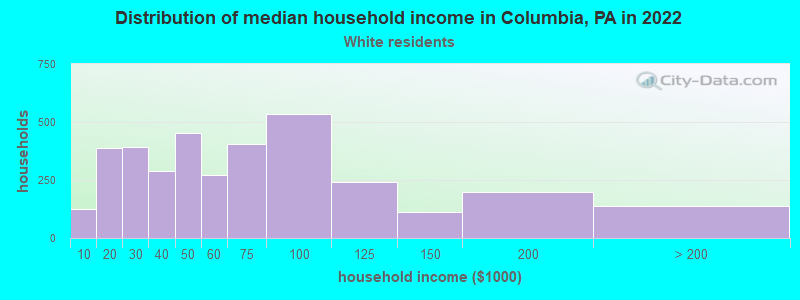
- Median household income in 2022
- $54,303White non-Hispanic householders
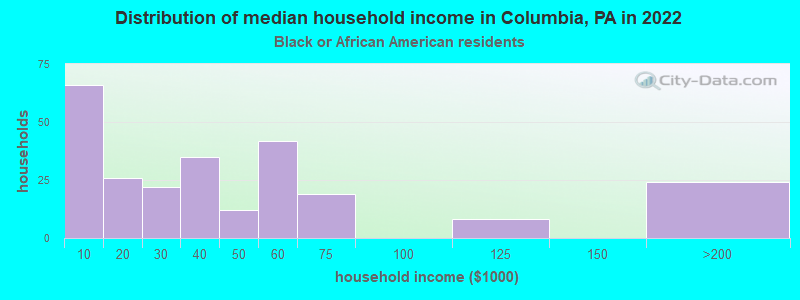
- $41,947Black householders
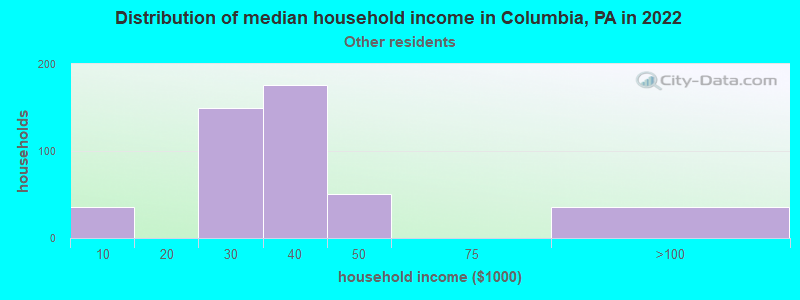
- $46,612Some other race householders
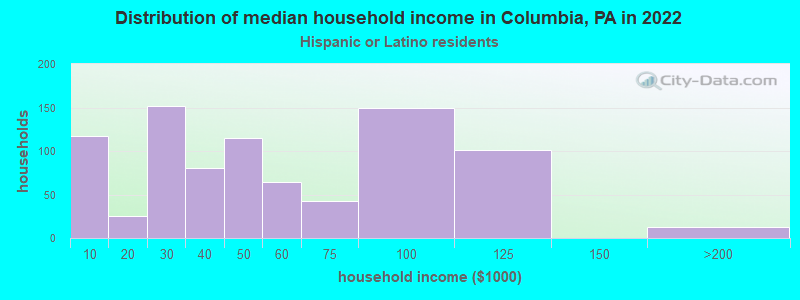
- $38,739Hispanic or Latino race householders
- Median 2022 house value
- $168,249White Non-Hispanic householders
- $164,140Black or African American householders
- $183,544Some other race householders
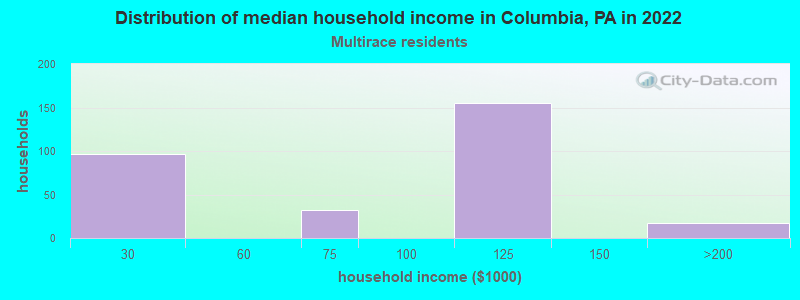
- $164,140Two or more races householders
- $177,837Hispanic or Latino householders
Household income for White non-Hispanic householders
Household income for Black householders
Household income for Some other race householders
Household income for Two or more races householders
Household income for Hispanic or Latino race householders
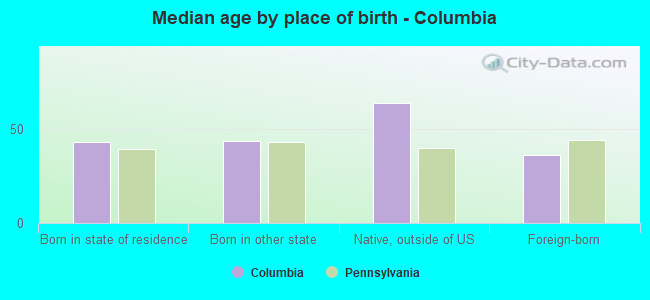
Median age by race in Columbia
- 45.6Median age for White residents
- 44.1Males
- 46.5Females
- 35.0Median age for Black or African American residents
- 27.3Males
- 38.0Females
- -642,857,142.2Median age for American Indian / Alaska Native residents
- -714,583,332.6Males
- -577,519,379.3Females
- -700,098,327.7Median age for Asian residents
- -683,026,584.2Males
- -737,827,714.6Females
- -612,499,999.4Median age for Native Hawaiian / Pacific Islander residents
- -760,416,665.9Males
- -747,474,746.7Females
- 48.9Median age for Other race residents
- 60.8Males
- 24.4Females
- 27.9Median age for Two or more races residents
- 30.1Males
- 25.7Females
- 51.3Median age for White alone residents
- 50.4Males
- 54.4Females
- 28.5Median age for Hispanic or Latino residents
- 32.7Males
- 24.4Females
Owner/renter occupied households by race in Columbia
- House owners and renters - White residents
- 2,13059.4%Owner occupied
- 1,45640.6%Renter occupied
- House owners and renters - Black or African American residents
- 21468.0%Owner occupied
- 10132.0%Renter occupied
- House owners and renters - American Indian / Alaska Native residents
- 47100.0%Renter occupied
- House owners and renters - Other race residents
- 352100.0%Renter occupied
- House owners and renters - Two or more races residents
- 102.7%Owner occupied
- 38297.3%Renter occupied
- House owners and renters - White alone residents
- 2,07160.3%Owner occupied
- 1,36639.7%Renter occupied
- House owners and renters - Hispanic or Latino residents
- 12012.3%Owner occupied
- 85387.7%Renter occupied
Language usage in Columbia
- English speakers - Total
- 86.1% of residents of Columbia speak English at home.
- 11.4% of residents speak Spanish at home
- 78068.8%Speak English very well
- 35331.2%Speak English less than very well
- 2.0% of residents speak other language at home
- 12864.6%Speak English very well
- 7035.4%Speak English less than very well
- English speakers - Born in the United States
- 76.7% of residents of Columbia speak English at home.
- 21.7% of residents speak Spanish at home
- 24685.4%Speak English very well
- 4214.6%Speak English less than very well
- 6.3% of residents speak other language at home
- 84100.0%Speak English very well
- English speakers - Native, born elsewhere
- 15.5% of residents of Columbia speak English at home.
- 85.0% of residents speak Spanish at home
- 24646.8%Speak English very well
- 28053.2%Speak English less than very well
- English speakers - Foreign-born
- 16.7% of residents of Columbia speak English at home.
- 62.7% of residents speak Spanish at home
- 18990.0%Speak English very well
- 2110.0%Speak English less than very well
- 31.3% of residents speak other language at home
- 4643.8%Speak English very well
- 5956.2%Speak English less than very well
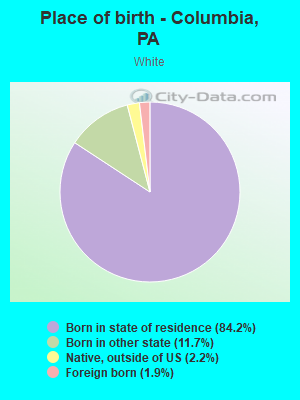
White (Caucasian) - Speak only English
| Native: | 92.3% (6,961) |
| Foreign-born: | 11.0% (15) |
White (Caucasian) - Speak another language
| Native: | 7.6% (574) |
| Foreign-born: | 75.4% (101) |
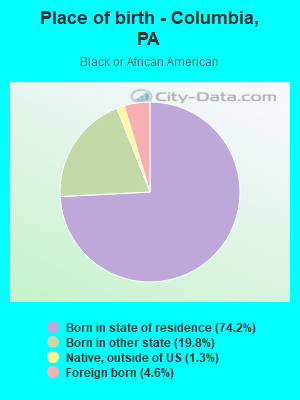
Black or African American - Speak only English
| Native: | 92.3% (801) |
| Foreign-born: | 93.8% (42) |
Black or African American - Speak another language
| Native: | 7.2% (62) |
| Foreign-born: | 38.0% (17) |
Two or more races - Speak only English
| Native: | 94.2% (585) |
| Foreign-born: | 6.3% (10) |
Two or more races - Speak another language
| Native: | 8.5% (53) |
| Foreign-born: | 98.0% (153) |
White alone - Speak only English
| Native: | 97.6% (6,592) |
| Foreign-born: | 17.9% (16) |
White alone - Speak another language
| Native: | 1.6% (108) |
| Foreign-born: | 71.7% (63) |
Hispanic or Latino - Speak another language
| Native: | 42.1% (954) |
| Foreign-born: | 99.2% (161) |
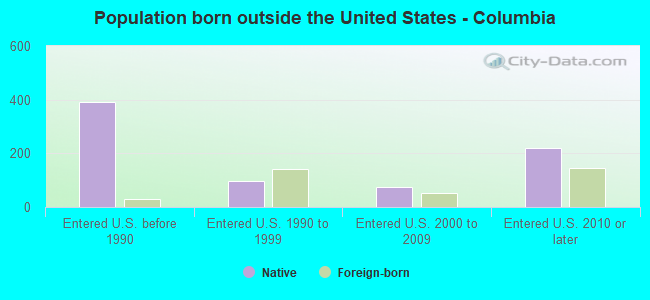
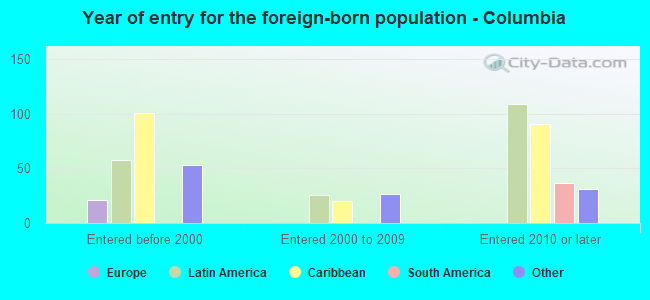
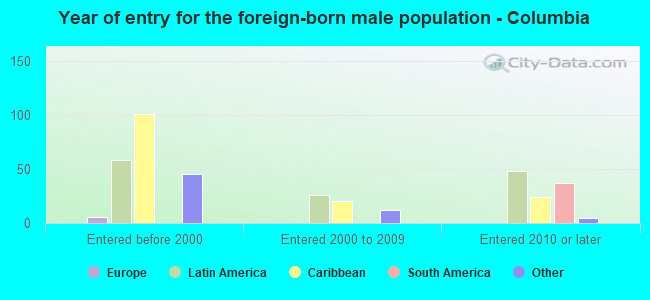
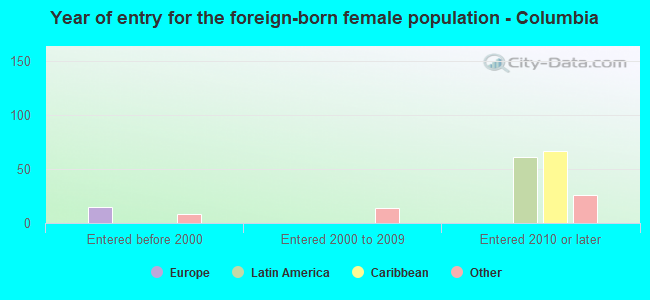
Foreign-born residents in Columbia
431 residents are foreign born (2.4% Latin America, 1.2% Africa).
| This city: | 4.2% |
| Pennsylvania: | 7.3% |
Marital status for residents in Columbia
Marital status - White (Caucasian) population 15 years and over
- Males
- 37.5%Never married
- 45.0%Now married
- 0.9%Separated
- 3.4%Widowed
- 13.2%Divorced
- Females
- 28.0%Never married
- 39.6%Now married
- 2.9%Separated
- 12.6%Widowed
- 16.8%Divorced
Women who gave birth in the past 12 months
| Now married: | 29.3% (28) |
| Unmarried: | 70.7% (67) |
Women who did not give birth in the past 12 months
| Now married: | 37.5% (633) |
| Unmarried: | 62.5% (1,056) |
Marital status - Black or African American population 15 years and over
- Males
- 59.2%Never married
- 22.5%Now married
- 0.0%Separated
- 2.0%Widowed
- 16.2%Divorced
- Females
- 55.7%Never married
- 18.7%Now married
- 0.0%Separated
- 18.7%Widowed
- 6.9%Divorced
Women who did not give birth in the past 12 months
| Now married: | 0.0% (0) |
| Unmarried: | 100.0% (97) |
Marital status - American Indian / Alaska Native population 15 years and over
- Males
- 100.0%Never married
- 0.0%Now married
- 0.0%Separated
- 0.0%Widowed
- 0.0%Divorced
- Females
- 0.0%Never married
- 0.0%Now married
- 75.0%Separated
- 25.0%Widowed
- 0.0%Divorced
Women who did not give birth in the past 12 months
| Now married: | 75.0% (55) |
| Unmarried: | 25.0% (18) |
Marital status - Other race population 15 years and over
- Males
- 39.9%Never married
- 7.2%Now married
- 0.0%Separated
- 1.6%Widowed
- 51.3%Divorced
- Females
- 70.7%Never married
- 29.3%Now married
- 0.0%Separated
- 0.0%Widowed
- 0.0%Divorced
Women who did not give birth in the past 12 months
| Now married: | 0.0% (0) |
| Unmarried: | 100.0% (76) |
Marital status - Two or more races population 15 years and over
- Males
- 52.1%Never married
- 21.6%Now married
- 26.3%Separated
- 0.0%Widowed
- 0.0%Divorced
- Females
- 35.4%Never married
- 52.4%Now married
- 1.2%Separated
- 11.0%Widowed
- 0.0%Divorced
Women who did not give birth in the past 12 months
| Now married: | 44.2% (33) |
| Unmarried: | 55.8% (42) |
Marital status - White alone, not Hispanic / Latino population 15 years and over
- Males
- 36.7%Never married
- 46.7%Now married
- 1.0%Separated
- 3.8%Widowed
- 11.9%Divorced
- Females
- 25.1%Never married
- 40.0%Now married
- 3.3%Separated
- 13.8%Widowed
- 17.8%Divorced
Women who gave birth in the past 12 months
| Now married: | 2.9% (1) |
| Unmarried: | 97.1% (34) |
Women who did not give birth in the past 12 months
| Now married: | 39.3% (562) |
| Unmarried: | 60.7% (870) |
Marital status - Hispanic or Latino population 15 years and over
- Males
- 49.5%Never married
- 17.7%Now married
- 7.3%Separated
- 0.6%Widowed
- 24.8%Divorced
- Females
- 51.3%Never married
- 33.6%Now married
- 4.5%Separated
- 2.3%Widowed
- 8.4%Divorced
Women who gave birth in the past 12 months
| Now married: | 43.8% (28) |
| Unmarried: | 56.2% (35) |
Women who did not give birth in the past 12 months
| Now married: | 28.7% (137) |
| Unmarried: | 71.3% (340) |
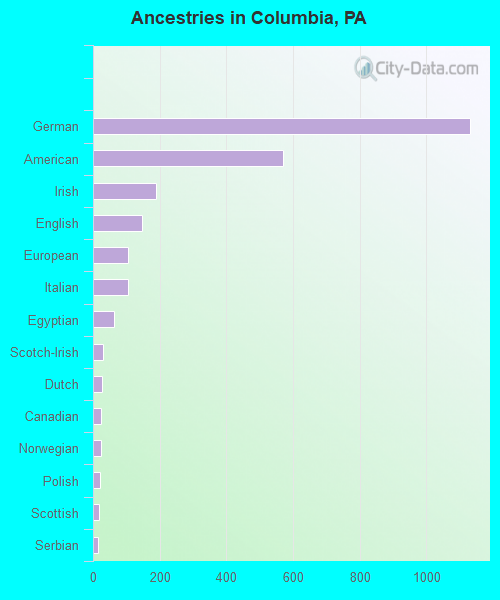
Ancestries in Columbia

- 1,13125.9%German
- 56913.0%American
- 1904.3%Irish
- 1463.3%English
- 1052.4%European
- 1052.4%Italian
- 631.4%Egyptian
- 300.7%Scotch-Irish
- 280.6%Dutch
- 240.5%Canadian
- 230.5%Norwegian
- 220.5%Polish
- 190.4%Scottish
- 150.3%Serbian
- 100.2%French Canadian
- 100.2%Lithuanian
- 80.2%Welsh
- 80.2%Jamaican
- 60.1%Turkish
- 30.07%Austrian
- 20.05%Ukrainian
- 10.02%Slovak
- 10.02%Dutch West Indian
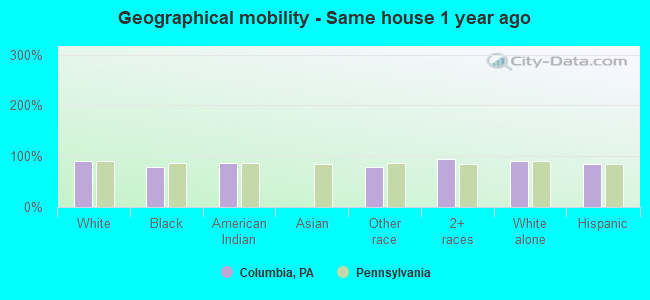
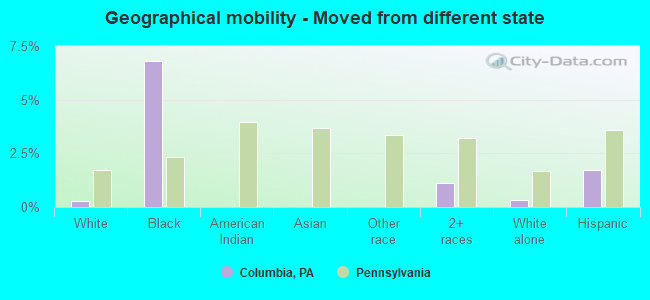
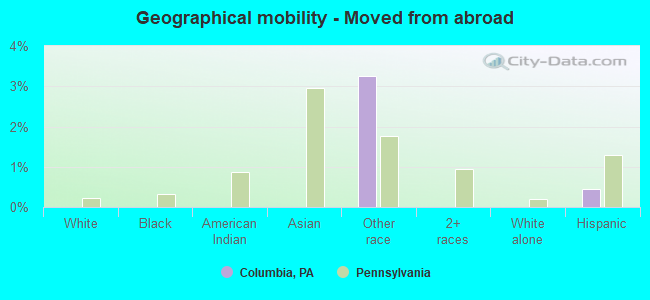
Geographical mobility in Columbia

- Same house 1 year ago
- 7,12089.7%White (Caucasian)
- 68079.4%Black or African American
- 11587.0%American Indian / Alaska Native
- 45678.4%Other race
- 72294.5%Two or more races
- 6,38591.2%White alone, not Hispanic / Latino
- 2,09085.0%Hispanic or Latino
-
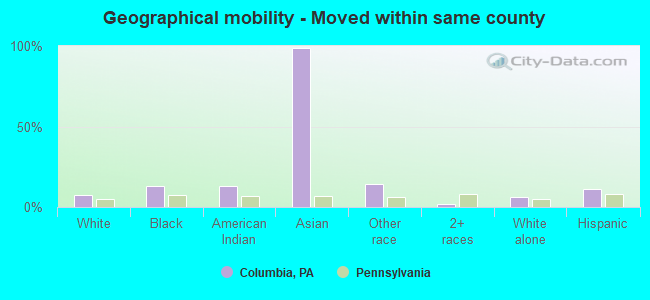
- Moved within same county
- 6057.6%White / Caucasian
- 11413.3%Black or African American
- 1813.3%American Indian / Alaska Native
- 798.5%Asian
- 8414.5%Other race
- 141.9%Two or more races
- 4456.4%White alone, not Hispanic / Latino
- 28211.5%Hispanic or Latino
-
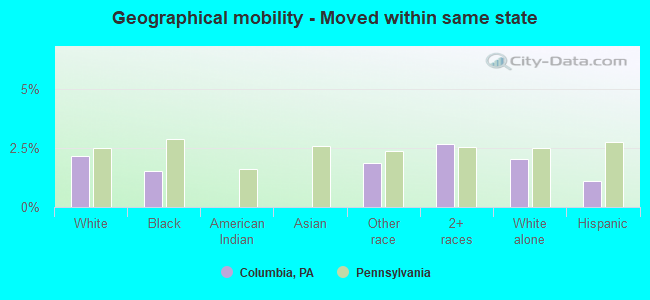
- Moved within same state
- 1702.1%White / Caucasian
- 131.5%Black or African American
- 111.9%Other race
- 202.6%Two or more races
- 1422.0%White alone, not Hispanic / Latino
- 271.1%Hispanic or Latino
-
- Moved from different state
- 230.3%White / Caucasian
- 586.8%Black or African American
- 81.1%Two or more races
- 220.3%White alone, not Hispanic / Latino
- 421.7%Hispanic or Latino
-
- Moved from abroad
- 193.2%Other race
- 110.4%Hispanic or Latino
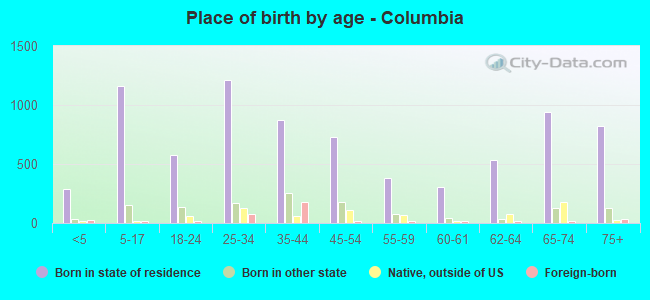
Children Nativity (place of birth) in Columbia
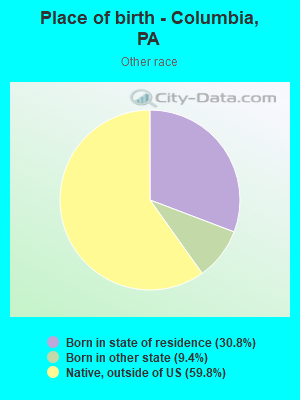
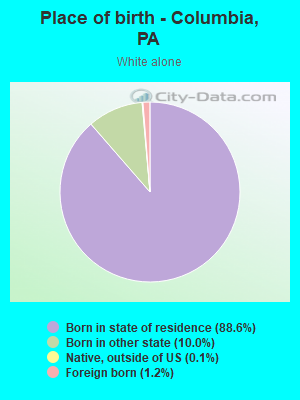
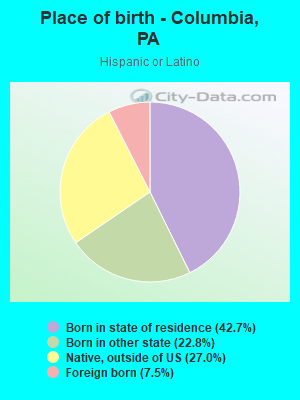
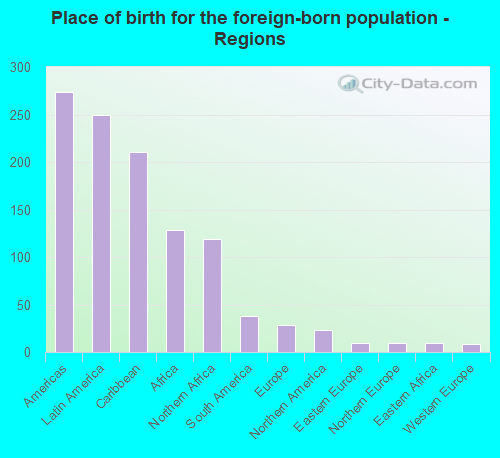
Place of birth for residents in Columbia
![Place of birth for the foreign-born population - Regions]()
- 274Americas
- 250Latin America
- 211Caribbean
- 128Africa
- 119Northern Africa
- 38South America
- 28Europe
- 23Northern America
- 10Eastern Europe
- 9Northern Europe
- 9Eastern Africa
- 8Western Europe
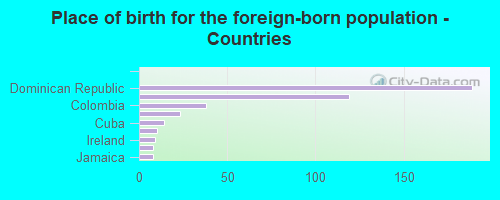
![Place of birth for the foreign-born population - Countries]()
- 189Dominican Republic
- 119Egypt
- 38Colombia
- 23Canada
- 14Cuba
- 10Lithuania
- 9Ireland
- 8Germany
- 8Jamaica
Grandparents responsible for own grandchildren in Columbia
Zip codes: 17512.