Races in Commerce, Georgia (GA) Detailed Stats
Data:
Races - White alone (%)
Races - White alone (% change since 2000)
Races - Black alone (%)
Races - Black alone (% change since 2000)
Races - American Indian alone (%)
Races - American Indian alone (% change since 2000)
Races - Asian alone (%)
Races - Asian alone (% change since 2000)
Races - Hispanic (%)
Races - Hispanic (% change since 2000)
Races - Native Hawaiian and Other Pacific Islander alone (%)
Races - Native Hawaiian and Other Pacific Islander alone (% change since 2000)
Races - Two or more races(%)
Races - Two or more races(% change since 2000)
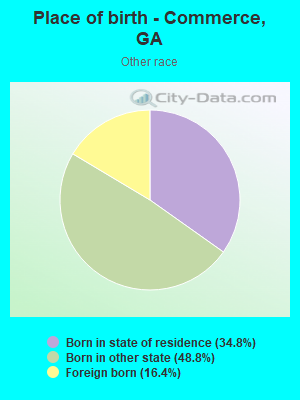
Races - Other race alone (%)
Races - Other race alone (% change since 2000)
Racial diversity
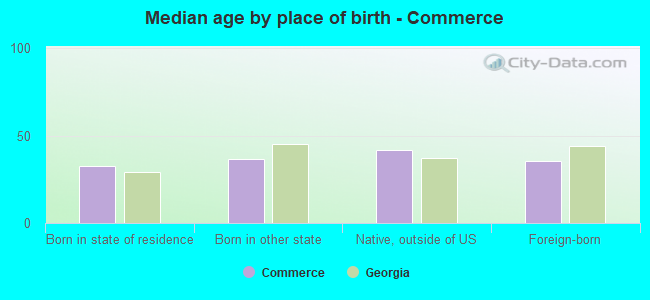
Place of birth - Born in state of residence (%)
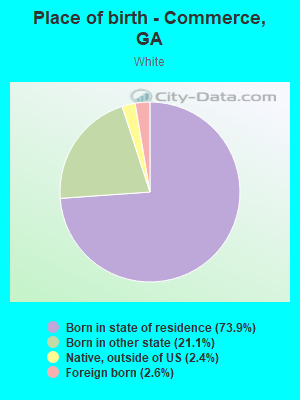
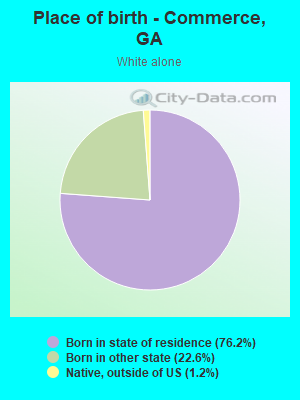
Place of birth - Born in state of residence (%) - White
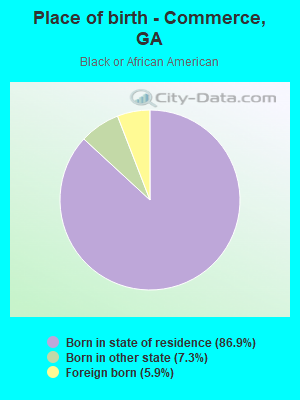
Place of birth - Born in state of residence (%) - Black or African American
Place of birth - Born in state of residence (%) - Asian
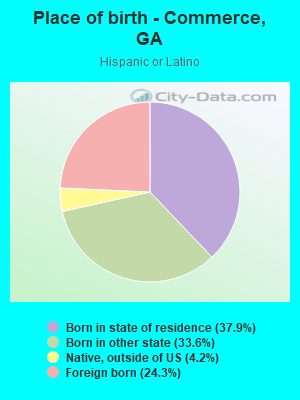
Place of birth - Born in state of residence (%) - Hispanic or Latino
Place of birth - Born in state of residence (%) - American Indian and Alaska Native
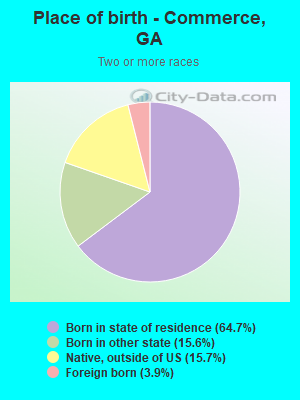
Place of birth - Born in state of residence (%) - Multirace
Place of birth - Born in state of residence (%) - Other Race
Place of birth - Born in other state (%)
Place of birth - Born in other state (%) - White
Place of birth - Born in other state (%) - Black or African American
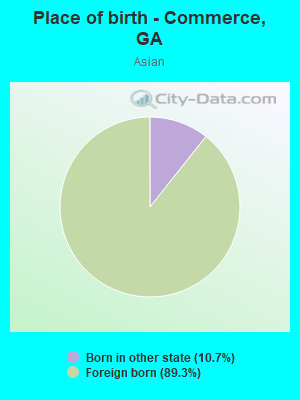
Place of birth - Born in other state (%) - Asian
Place of birth - Born in other state (%) - Hispanic or Latino
Place of birth - Born in other state (%) - American Indian and Alaska Native
Place of birth - Born in other state (%) - Multirace
Place of birth - Born in other state (%) - Other Race
Place of birth - Native, outside of US (%)
Place of birth - Native, outside of US (%) - White
Place of birth - Native, outside of US (%) - Black or African American
Place of birth - Native, outside of US (%) - Asian
Place of birth - Native, outside of US (%) - Hispanic or Latino
Place of birth - Native, outside of US (%) - American Indian and Alaska Native
Place of birth - Native, outside of US (%) - Multirace
Place of birth - Native, outside of US (%) - Other Race
Place of birth - Foreign born (%)
Place of birth - Foreign born (%) - White
Place of birth - Foreign born (%) - Black or African American
Place of birth - Foreign born (%) - Asian
Place of birth - Foreign born (%) - Hispanic or Latino
Place of birth - Foreign born (%) - American Indian and Alaska Native
Place of birth - Foreign born (%) - Multirace
Place of birth - Foreign born (%) - Other Race
Residents speaking English at home (%)
Residents speaking English at home - Born in the United States (%)
Residents speaking English at home - Native, born elsewhere (%)
Residents speaking English at home - Foreign born (%)
Residents speaking Spanish at home (%)
Residents speaking Spanish at home - Born in the United States (%)
Residents speaking Spanish at home - Native, born elsewhere (%)
Residents speaking Spanish at home - Foreign born (%)
Residents speaking other language at home (%)
Residents speaking other language at home - Born in the United States (%)
Residents speaking other language at home - Native, born elsewhere (%)
Residents speaking other language at home - Foreign born (%)
Marital status - Never married (%)
Marital status - Now married (%)
Marital status - Separated (%)
Marital status - Widowed (%)
Marital status - Divorced (%)
Ancestries Reported - Arab (%)
Ancestries Reported - Czech (%)
Ancestries Reported - Danish (%)
Ancestries Reported - Dutch (%)
Ancestries Reported - English (%)
Ancestries Reported - French (%)
Ancestries Reported - French Canadian (%)
Ancestries Reported - German (%)
Ancestries Reported - Greek (%)
Ancestries Reported - Hungarian (%)
Ancestries Reported - Irish (%)
Ancestries Reported - Italian (%)
Ancestries Reported - Lithuanian (%)
Ancestries Reported - Norwegian (%)
Ancestries Reported - Polish (%)
Ancestries Reported - Portuguese (%)
Ancestries Reported - Russian (%)
Ancestries Reported - Scotch-Irish (%)
Ancestries Reported - Scottish (%)
Ancestries Reported - Slovak (%)
Ancestries Reported - Subsaharan African (%)
Ancestries Reported - Swedish (%)
Ancestries Reported - Swiss (%)
Ancestries Reported - Ukrainian (%)
Ancestries Reported - United States (%)
Ancestries Reported - Welsh (%)
Ancestries Reported - West Indian (%)
Ancestries Reported - Other (%)
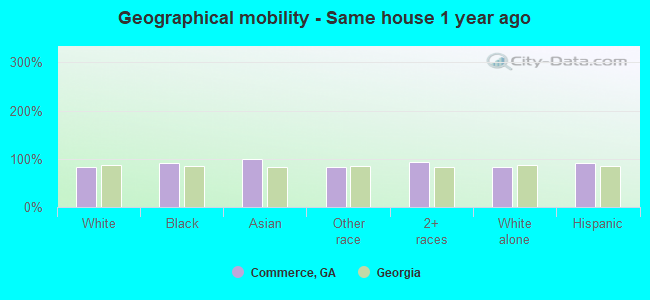
Geographical mobility - Same house 1 year ago (%)
Geographical mobility - Same house 1 year ago (%) - White
Geographical mobility - Same house 1 year ago (%) - Black or African American
Geographical mobility - Same house 1 year ago (%) - Asian
Geographical mobility - Same house 1 year ago (%) - Hispanic or Latino
Geographical mobility - Same house 1 year ago (%) - American Indian and Alaska Native
Geographical mobility - Same house 1 year ago (%) - Multirace
Geographical mobility - Same house 1 year ago (%) - Other Race
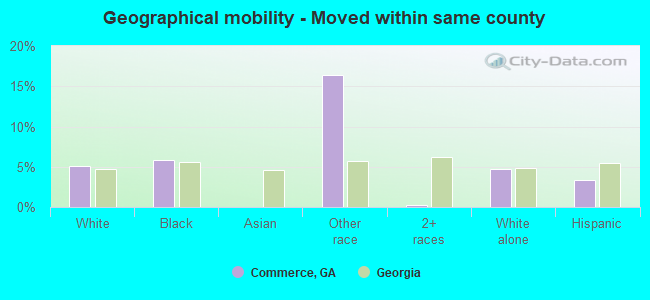
Geographical mobility - Moved within same county (%)
Geographical mobility - Moved within same county (%) - White
Geographical mobility - Moved within same county (%) - Black or African American
Geographical mobility - Moved within same county (%) - Asian
Geographical mobility - Moved within same county (%) - Hispanic or Latino
Geographical mobility - Moved within same county (%) - American Indian and Alaska Native
Geographical mobility - Moved within same county (%) - Multirace
Geographical mobility - Moved within same county (%) - Other Race
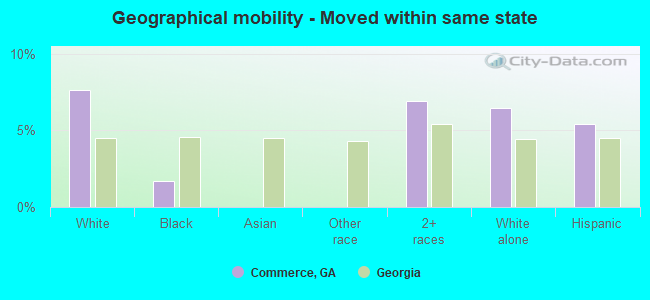
Geographical mobility - Moved from different county within same state (%)
Geographical mobility - Moved from different county within same state (%) - White
Geographical mobility - Moved from different county within same state (%) - Black or African American
Geographical mobility - Moved from different county within same state (%) - Asian
Geographical mobility - Moved from different county within same state (%) - Hispanic or Latino
Geographical mobility - Moved from different county within same state (%) - American Indian and Alaska Native
Geographical mobility - Moved from different county within same state (%) - Multirace
Geographical mobility - Moved from different county within same state (%) - Other Race
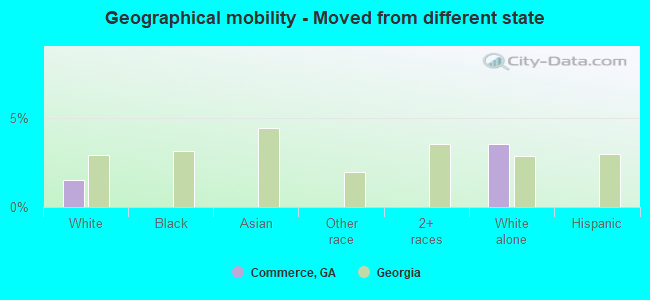
Geographical mobility - Moved from different state (%)
Geographical mobility - Moved from different state (%) - White
Geographical mobility - Moved from different state (%) - Black or African American
Geographical mobility - Moved from different state (%) - Asian
Geographical mobility - Moved from different state (%) - Hispanic or Latino
Geographical mobility - Moved from different state (%) - American Indian and Alaska Native
Geographical mobility - Moved from different state (%) - Multirace
Geographical mobility - Moved from different state (%) - Other Race
Geographical mobility - Moved from abroad (%)
Geographical mobility - Moved from abroad (%) - White
Geographical mobility - Moved from abroad (%) - Black or African American
Geographical mobility - Moved from abroad (%) - Asian
Geographical mobility - Moved from abroad (%) - Hispanic or Latino
Geographical mobility - Moved from abroad (%) - American Indian and Alaska Native
Geographical mobility - Moved from abroad (%) - Multirace
Geographical mobility - Moved from abroad (%) - Other Race
Place of birth for the foreign-born population - Ireland (%)
Place of birth for the foreign-born population - Denmark (%)
Place of birth for the foreign-born population - Norway (%)
Place of birth for the foreign-born population - Sweden (%)
Place of birth for the foreign-born population - United Kingdom (%)
Place of birth for the foreign-born population - England (%)
Place of birth for the foreign-born population - Scotland (%)
Place of birth for the foreign-born population - Other Northern Europe (%)
Place of birth for the foreign-born population - Austria (%)
Place of birth for the foreign-born population - Belgium (%)
Place of birth for the foreign-born population - France (%)
Place of birth for the foreign-born population - Germany (%)
Place of birth for the foreign-born population - Netherlands (%)
Place of birth for the foreign-born population - Switzerland (%)
Place of birth for the foreign-born population - Other Western Europe (%)
Place of birth for the foreign-born population - Greece (%)
Place of birth for the foreign-born population - Italy (%)
Place of birth for the foreign-born population - Portugal (%)
Place of birth for the foreign-born population - Spain (%)
Place of birth for the foreign-born population - Other Southern Europe (%)
Place of birth for the foreign-born population - Albania (%)
Place of birth for the foreign-born population - Belarus (%)
Place of birth for the foreign-born population - Bosnia and Herzegovina (%)
Place of birth for the foreign-born population - Bulgaria (%)
Place of birth for the foreign-born population - Croatia (%)
Place of birth for the foreign-born population - Czechoslovakia (%)
Place of birth for the foreign-born population - Hungary (%)
Place of birth for the foreign-born population - Latvia (%)
Place of birth for the foreign-born population - Lithuania (%)
Place of birth for the foreign-born population - North Macedonia (Macedonia) (%)
Place of birth for the foreign-born population - Moldova (%)
Place of birth for the foreign-born population - Poland (%)
Place of birth for the foreign-born population - Romania (%)
Place of birth for the foreign-born population - Russia (%)
Place of birth for the foreign-born population - Serbia (%)
Place of birth for the foreign-born population - Ukraine (%)
Place of birth for the foreign-born population - Other Eastern Europe (%)
Place of birth for the foreign-born population - China (%)
Place of birth for the foreign-born population - Hong Kong (%)
Place of birth for the foreign-born population - Taiwan (%)
Place of birth for the foreign-born population - Japan (%)
Place of birth for the foreign-born population - Korea (%)
Place of birth for the foreign-born population - Other Eastern Asia (%)
Place of birth for the foreign-born population - Afghanistan (%)
Place of birth for the foreign-born population - Bangladesh (%)
Place of birth for the foreign-born population - India (%)
Place of birth for the foreign-born population - Iran (%)
Place of birth for the foreign-born population - Kazakhstan (%)
Place of birth for the foreign-born population - Nepal (%)
Place of birth for the foreign-born population - Pakistan (%)
Place of birth for the foreign-born population - Sri Lanka (%)
Place of birth for the foreign-born population - Uzbekistan (%)
Place of birth for the foreign-born population - Other South Central Asia (%)
Place of birth for the foreign-born population - Burma (%)
Place of birth for the foreign-born population - Cambodia (%)
Place of birth for the foreign-born population - Indonesia (%)
Place of birth for the foreign-born population - Laos (%)
Place of birth for the foreign-born population - Malaysia (%)
Place of birth for the foreign-born population - Philippines (%)
Place of birth for the foreign-born population - Singapore (%)
Place of birth for the foreign-born population - Thailand (%)
Place of birth for the foreign-born population - Vietnam (%)
Place of birth for the foreign-born population - Other South Eastern Asia (%)
Place of birth for the foreign-born population - Armenia (%)
Place of birth for the foreign-born population - Iraq (%)
Place of birth for the foreign-born population - Israel (%)
Place of birth for the foreign-born population - Jordan (%)
Place of birth for the foreign-born population - Kuwait (%)
Place of birth for the foreign-born population - Lebanon (%)
Place of birth for the foreign-born population - Saudi Arabia (%)
Place of birth for the foreign-born population - Syria (%)
Place of birth for the foreign-born population - Turkey (%)
Place of birth for the foreign-born population - Yemen (%)
Place of birth for the foreign-born population - Other Western Asia (%)
Place of birth for the foreign-born population - Eritrea (%)
Place of birth for the foreign-born population - Ethiopia (%)
Place of birth for the foreign-born population - Kenya (%)
Place of birth for the foreign-born population - Somalia (%)
Place of birth for the foreign-born population - Uganda (%)
Place of birth for the foreign-born population - Zimbabwe (%)
Place of birth for the foreign-born population - Other Eastern Africa (%)
Place of birth for the foreign-born population - Cameroon (%)
Place of birth for the foreign-born population - Congo (%)
Place of birth for the foreign-born population - Democratic Republic of Congo (Zaire) (%)
Place of birth for the foreign-born population - Other Middle Africa (%)
Place of birth for the foreign-born population - Egypt (%)
Place of birth for the foreign-born population - Morocco (%)
Place of birth for the foreign-born population - Sudan (%)
Place of birth for the foreign-born population - Other Northern Africa (%)
Place of birth for the foreign-born population - South Africa (%)
Place of birth for the foreign-born population - Other Southern Africa (%)
Place of birth for the foreign-born population - Cabo Verde (%)
Place of birth for the foreign-born population - Ghana (%)
Place of birth for the foreign-born population - Liberia (%)
Place of birth for the foreign-born population - Nigeria (%)
Place of birth for the foreign-born population - Senegal (%)
Place of birth for the foreign-born population - Sierra Leone (%)
Place of birth for the foreign-born population - Other Western Africa (%)
Place of birth for the foreign-born population - Australia (%)
Place of birth for the foreign-born population - New Zealand (%)
Place of birth for the foreign-born population - Fiji (%)
Place of birth for the foreign-born population - Micronesia (%)
Place of birth for the foreign-born population - Bahamas (%)
Place of birth for the foreign-born population - Barbados (%)
Place of birth for the foreign-born population - Cuba (%)
Place of birth for the foreign-born population - Dominica (%)
Place of birth for the foreign-born population - Dominican Republic (%)
Place of birth for the foreign-born population - Grenada (%)
Place of birth for the foreign-born population - Haiti (%)
Place of birth for the foreign-born population - Jamaica (%)
Place of birth for the foreign-born population - St. Vincent and the Grenadines (%)
Place of birth for the foreign-born population - Trinidad and Tobago (%)
Place of birth for the foreign-born population - West Indies (%)
Place of birth for the foreign-born population - Other Caribbean (%)
Place of birth for the foreign-born population - Belize (%)
Place of birth for the foreign-born population - Costa Rica (%)
Place of birth for the foreign-born population - El Salvador (%)
Place of birth for the foreign-born population - Guatemala (%)
Place of birth for the foreign-born population - Honduras (%)
Place of birth for the foreign-born population - Mexico (%)
Place of birth for the foreign-born population - Nicaragua (%)
Place of birth for the foreign-born population - Panama (%)
Place of birth for the foreign-born population - Other Central America (%)
Place of birth for the foreign-born population - Argentina (%)
Place of birth for the foreign-born population - Bolivia (%)
Place of birth for the foreign-born population - Brazil (%)
Place of birth for the foreign-born population - Chile (%)
Place of birth for the foreign-born population - Colombia (%)
Place of birth for the foreign-born population - Ecuador (%)
Place of birth for the foreign-born population - Guyana (%)
Place of birth for the foreign-born population - Peru (%)
Place of birth for the foreign-born population - Uruguay (%)
Place of birth for the foreign-born population - Venezuela (%)
Place of birth for the foreign-born population - Other South America (%)
Place of birth for the foreign-born population - Canada (%)
Place of birth for the foreign-born population - Other Northern America (%)
Place of birth for the foreign-born population - Other (%)
Latest news about races in Commerce, GA collected exclusively by city-data.com from local newspapers, TV, and radio stations
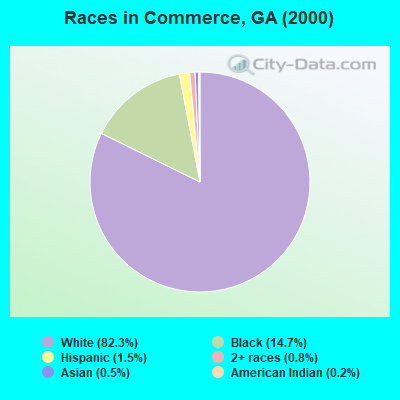
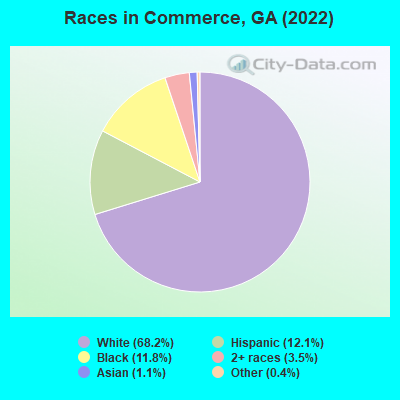
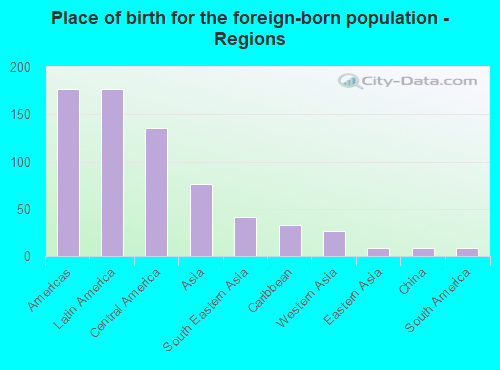
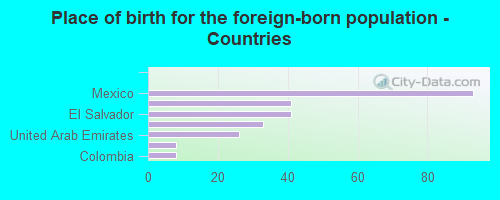
According to 2022 data, the most numerous races in Commerce, GA are White alone (5,495 residents), Black alone (949 residents), and Hispanic (971 residents). 89.3% of Commerce residents speak English at home. 3.1% of Commerce, GA residents are foreign-born (2.3% born in Latin America, 1.0% born in Asia), which is 218.3% less than the foreign-born rate of 10.0% across the entire state of Georgia.
Race distribution in Commerce
2000 2022
5,128,661 62.6% White alone 2,331,465 28.5% Black alone 435,227 5.3% Hispanic 171,513 2.1% Asian alone 87,364 1.1% Two or more races 17,670 0.2% American Indian alone 11,275 0.1% Other race alone 3,278 0.04% Native Hawaiian and Other
5,415,657 49.6% White alone 3,349,240 30.7% Black alone 1,132,604 10.4% Hispanic 479,156 4.4% Asian alone 462,923 4.2% Two or more races 54,416 0.5% Other race alone 11,923 0.1% American Indian alone 6,957 0.06% Native Hawaiian and Other
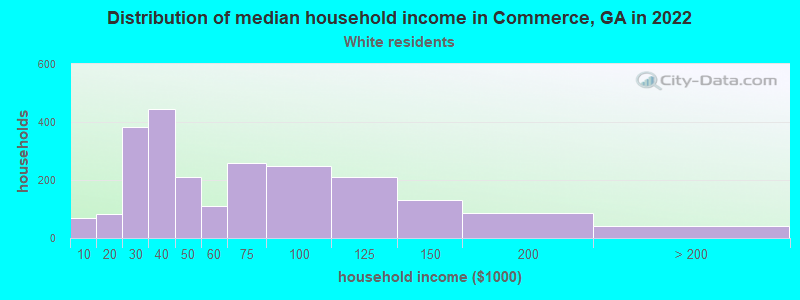
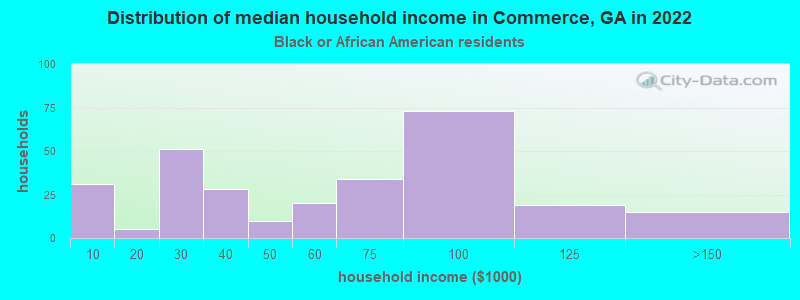
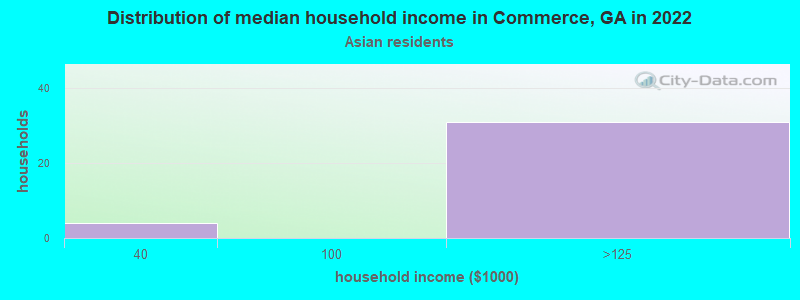
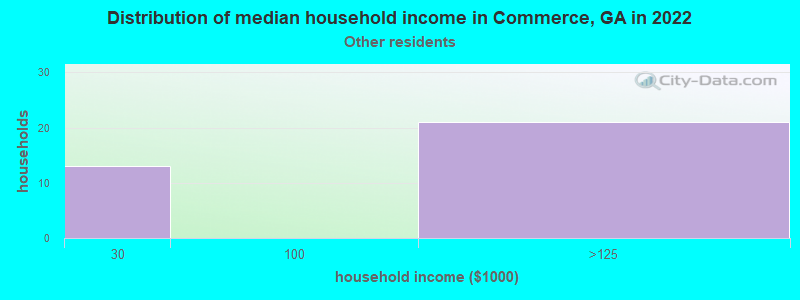
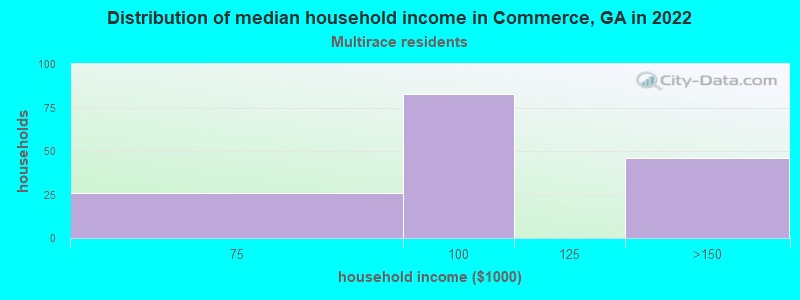
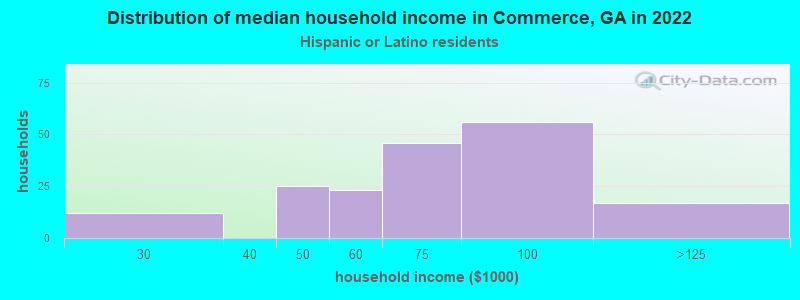
Income and house value in Commerce Median household income in 2022 $60,214 White non-Hispanic householders$40,937 Black householders$76,295 Two or more races householders$58,572 Hispanic or Latino race householdersMedian 2022 house value $277,714 White Non-Hispanic householders$146,437 Black or African American householders$129,209 American Indian or Alaska Native householders$258,419 Some other race householders$320,440 Hispanic or Latino householders
Median age by race in Commerce
34.5 Median age for White residents33.8 35.8 58.1 Median age for Black or African American residents35.1 59.0 -597,462,513.8 Median age for American Indian / Alaska Native residents-666,666,666.0 -666,666,666.0 45.6 Median age for Asian residents-870,748,298.4 41.5 -666,666,666.0 Median age for Native Hawaiian / Pacific Islander residents-666,666,666.0 -666,666,666.0 30.1 Median age for Other race residents-478,808,705.1 32.1 16.7 Median age for Two or more races residents11.6 36.2 35.8 Median age for White alone residents34.6 37.1 23.5 Median age for Hispanic or Latino residents17.6 33.1
Owner/renter occupied households by race in Commerce
House owners and renters - White residents 1,451 67.8% Owner occupied688 32.2% Renter occupiedHouse owners and renters - Black or African American residents 177 71.8% Owner occupied70 28.2% Renter occupiedHouse owners and renters - Asian residents 35 100.0% Owner occupiedHouse owners and renters - Other race residents 39 100.0% Owner occupiedHouse owners and renters - Two or more races residents 150 99.6% Owner occupied1 0.4% Renter occupiedHouse owners and renters - White alone residents 1,410 67.1% Owner occupied690 32.9% Renter occupiedHouse owners and renters - Hispanic or Latino residents 169 91.6% Owner occupied15 8.4% Renter occupied
Language usage in Commerce
English speakers - Total 89.3% of residents of Commerce speak English at home.
9.9% of residents speak Spanish at home 537 73.2% Speak English very well197 26.8% Speak English less than very well0.9% of residents speak other language at home 59 89.4% Speak English very well7 10.6% Speak English less than very well
English speakers - Born in the United States 80.1% of residents of Commerce speak English at home.
28.4% of residents speak Spanish at home 410 97.4% Speak English very well11 2.6% Speak English less than very well0.4% of residents speak other language at home 6 100.0% Speak English very well
English speakers - Native, born elsewhere 32.2% of residents of Commerce speak English at home.
16.3% of residents speak Spanish at home 34 100.0% Speak English very well
English speakers - Foreign-born 31.7% of residents of Commerce speak English at home.
57.8% of residents speak Spanish at home 34 14.8% Speak English very well196 85.2% Speak English less than very well15.3% of residents speak other language at home 51 83.6% Speak English very well10 16.4% Speak English less than very well
White (Caucasian) - Speak another language Native:
1.7% (87)Foreign-born:
100.0% (154)
Black or African American - Speak only English Native:
99.8% (1,078)Foreign-born:
97.7% (35)
Asian - Speak another language Native:
100.0% (9)Foreign-born:
66.6% (50)
Other race - Speak another language Native:
83.1% (150)Foreign-born:
99.0% (34)
Two or more races - Speak another language Native:
43.2% (259)Foreign-born:
70.5% (20)
Hispanic or Latino - Speak another language Native:
82.5% (476)Foreign-born:
100.0% (222)
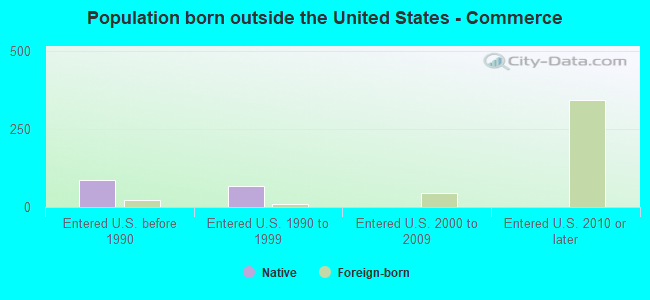
Foreign-born residents in Commerce 253 residents are foreign born (2.3% Latin America , 1.0% Asia ).
This city:
3.1%Georgia:
10.4%
Marital status for residents in Commerce Marital status - White (Caucasian) population 15 years and over
Males 34.4% Never married55.0% Now married0.2% Separated0.2% Widowed10.2% DivorcedFemales 15.1% Never married56.0% Now married0.2% Separated15.8% Widowed12.9% DivorcedWomen who gave birth in the past 12 months Now married:
86.5% (115)Unmarried:
13.5% (18)
Women who did not give birth in the past 12 months Now married:
62.4% (600)Unmarried:
37.6% (362)
Marital status - Black or African American population 15 years and over
Males 32.9% Never married55.5% Now married0.0% Separated0.0% Widowed11.6% DivorcedFemales 57.1% Never married28.4% Now married3.7% Separated10.8% Widowed0.0% DivorcedWomen who did not give birth in the past 12 months Now married:
28.2% (121)Unmarried:
71.8% (308)
Marital status - Asian population 15 years and over
Males 20.0% Never married80.0% Now married0.0% Separated0.0% Widowed0.0% DivorcedFemales 12.2% Never married87.8% Now married0.0% Separated0.0% Widowed0.0% DivorcedWomen who did not give birth in the past 12 months Now married:
87.8% (37)Unmarried:
12.2% (5)
Marital status - Other race population 15 years and over
Males 68.4% Never married31.6% Now married0.0% Separated0.0% Widowed0.0% DivorcedFemales 61.7% Never married24.3% Now married0.0% Separated0.0% Widowed13.9% DivorcedWomen who did not give birth in the past 12 months Now married:
32.2% (36)Unmarried:
67.8% (77)
Marital status - Two or more races population 15 years and over
Males 0.0% Never married98.7% Now married0.0% Separated1.3% Widowed0.0% DivorcedFemales 19.4% Never married60.4% Now married0.0% Separated0.0% Widowed20.1% DivorcedWomen who did not give birth in the past 12 months Now married:
75.7% (124)Unmarried:
24.3% (40)
Marital status - White alone, not Hispanic / Latino population 15 years and over
Males 35.7% Never married52.9% Now married0.2% Separated0.2% Widowed10.9% DivorcedFemales 15.6% Never married54.5% Now married0.2% Separated16.3% Widowed13.4% DivorcedWomen who gave birth in the past 12 months Now married:
82.9% (88)Unmarried:
17.1% (18)
Women who did not give birth in the past 12 months Now married:
60.7% (566)Unmarried:
39.3% (367)
Marital status - Hispanic or Latino population 15 years and over
Males 20.4% Never married79.6% Now married0.0% Separated0.0% Widowed0.0% DivorcedFemales 21.7% Never married71.9% Now married0.0% Separated0.0% Widowed6.3% DivorcedWomen who gave birth in the past 12 months Now married:
100.0% (49)Unmarried:
0.0% (0)
Women who did not give birth in the past 12 months Now married:
68.4% (267)Unmarried:
31.6% (123)
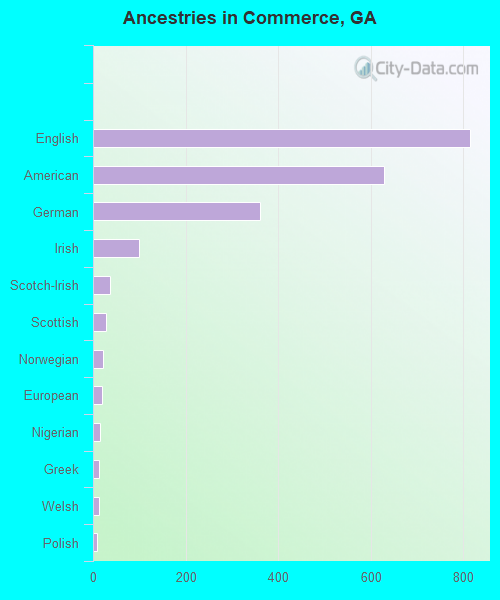
Ancestries in Commerce
815 24.9% English629 19.2% American361 11.0% German99 3.0% Irish36 1.1% Scotch-Irish28 0.9% Scottish21 0.6% Norwegian20 0.6% European16 0.5% Nigerian13 0.4% Greek12 0.4% Welsh9 0.3% Polish5 0.2% French Canadian
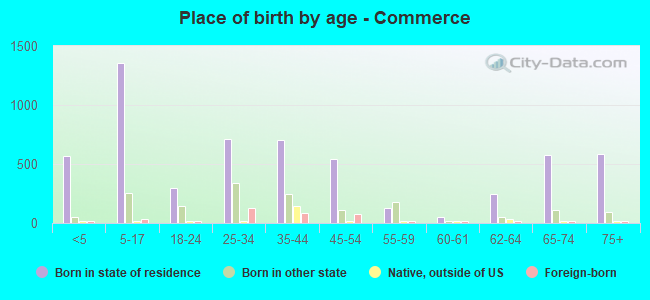
Children Nativity (place of birth) in Commerce
Children under 6 years - Living with two parents Both parents native 447 100.0% NativeOne native, one foreign-born parent 49 100.0% NativeChildren under 6 years - Living with one parent Native parent 93 100.0% NativeChildren 6 to 17 years - Living with two parents Both parents native 647 100.0% NativeBoth parents foreign-born 10 28.0% Native27 72.0% Foreign-bornOne native, one foreign-born parent 267 100.0% NativeChildren 6 to 17 years - Living with one parent Native parent 504 100.0% Native
Grandparents responsible for own grandchildren in Commerce
Grandparents (30 to 59 years) White / Caucasian 18 48.2% Responsible for grandchildren20 51.8% Not responsible for grandchildrenBlack or African American 59 61.0% Responsible for grandchildren38 39.0% Not responsible for grandchildrenWhite alone, not Hispanic / Latino 19 47.3% Responsible for grandchildren21 52.7% Not responsible for grandchildrenGrandparents (60 years and over) White / Caucasian 26 31.3% Responsible for grandchildren57 68.7% Not responsible for grandchildrenBlack or African American 86 100.0% Responsible for grandchildrenWhite alone, not Hispanic / Latino 26 30.3% Responsible for grandchildren60 69.7% Not responsible for grandchildren