Races in Cornish, Maine (ME) Detailed Stats
Ancestries, Foreign-born residents, place of birth

Recent posts about races in Cornish, Maine on our local forum with over 2,400,000 registered users:
 | Potential move (hopefully) (18 replies) |
| The best place to live in Maine. (394 replies) |
| Can anyone tell me about Cornish, Maine? (5 replies) |
| Jokes- Keep em clean please (509 replies) |
| Maine's Own Off-Topic Thread! (2485 replies) |
| How does fall speak to your heart? (60 replies) |
Latest news about races in Cornish, ME collected exclusively by city-data.com from local newspapers, TV, and radio stations
1.2% of Cornish, ME residents are foreign-born , which is 153.8% less than the foreign-born rate of 3.0% across the entire state of Maine.
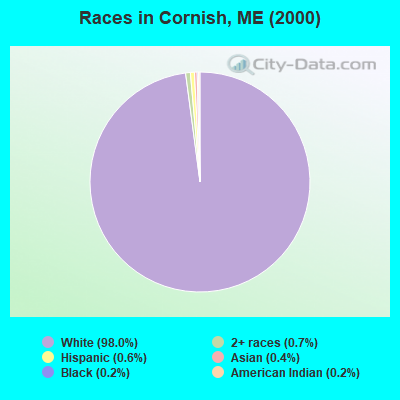
Race distribution in Cornish

- 1,24398.0%White alone
- 90.7%Two or more races
- 70.6%Hispanic
- 50.4%Asian alone
- 30.2%Black alone
- 20.2%American Indian alone
2000
2022
-
- 1,230,29796.5%White alone
- 11,7310.9%Two or more races
- 9,3600.7%Hispanic
- 9,0140.7%Asian alone
- 6,4400.5%Black alone
- 6,9110.5%American Indian alone
- 8360.07%Other race alone
- 3340.03%Native Hawaiian and Other
Pacific Islander alone

-
- 1,249,23390.2%White alone
- 58,3574.2%Two or more races
- 28,7172.1%Hispanic
- 21,5831.6%Black alone
- 16,1511.2%Asian alone
- 5,8730.4%Other race alone
- 5,2050.4%American Indian alone
- 2210.02%Native Hawaiian and Other
Pacific Islander alone

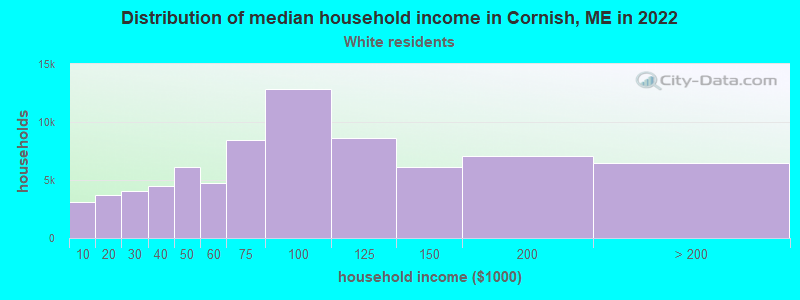
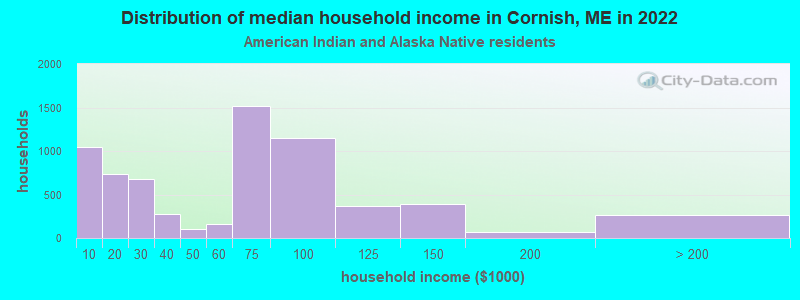
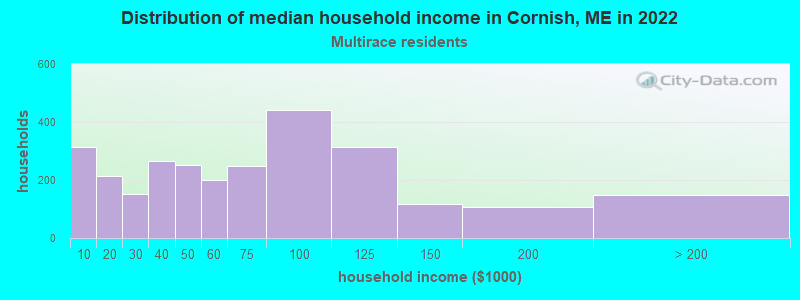
Income and house value in Cornish
- Median household income in 2022
- $72,506White non-Hispanic householders
- $12,526Two or more races householders
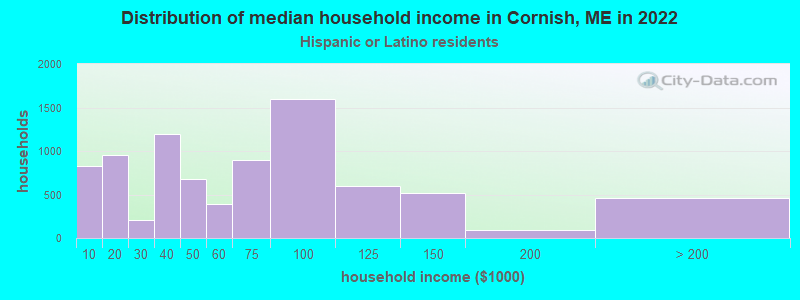
- $39,085Hispanic or Latino race householders
- Median 2022 house value
- $316,539White Non-Hispanic householders
- $303,443Two or more races householders
Household income for White non-Hispanic householders
Household income for American Indian and Alaska Native householders
Household income for Two or more races householders
Household income for Hispanic or Latino race householders
Foreign-born residents in Cornish
15 residents are foreign born
| This city: | 1.2% |
| Maine: | 2.9% |
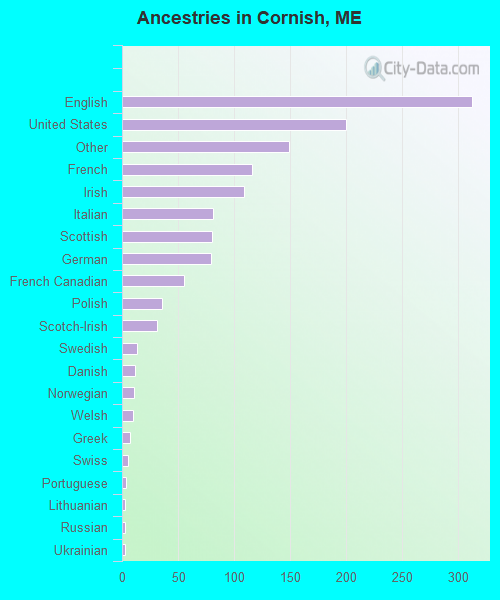
Ancestries in Cornish

- 31223.6%English
- 20015.1%United States
- 14911.3%Other
- 1168.8%French
- 1098.3%Irish
- 816.1%Italian
- 806.1%Scottish
- 796.0%German
- 554.2%French Canadian
- 362.7%Polish
- 312.3%Scotch-Irish
- 131.0%Swedish
- 120.9%Danish
- 110.8%Norwegian
- 100.8%Welsh
- 70.5%Greek
- 50.4%Swiss
- 40.3%Portuguese
- 30.2%Lithuanian
- 30.2%Russian
- 30.2%Ukrainian
- 20.2%Dutch
Zip codes: 04020.