Races in Cornish, New Hampshire (NH) Detailed Stats
Ancestries, Foreign-born residents, place of birth

Recent posts about races in Cornish, New Hampshire on our local forum with over 2,400,000 registered users:
 | First visit to NH (28 replies) |
| Claremont, NH SOS!! (Long . . .) (53 replies) |
| Anyone live in the Eastman community? (20 replies) |
| Things To Do In NH? (8 replies) |
| Where to live near Dartmouth for family? How much do you pay for utilities? (16 replies) |
| ride and rant.. great day over all (11 replies) |
2.5% of Cornish, NH residents are foreign-born (1.1% born in Europe, 0.7% born in North America, 0.4% born in Asia, 0.3% born in Latin America), which is 102.6% less than the foreign-born rate of 5.0% across the entire state of New Hampshire.
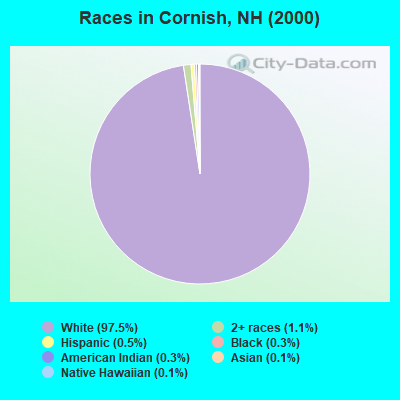
Race distribution in Cornish

- 1,62097.5%White alone
- 191.1%Two or more races
- 80.5%Hispanic
- 50.3%Black alone
- 50.3%American Indian alone
- 20.1%Asian alone
- 20.1%Native Hawaiian and Other
Pacific Islander alone
2000
2022
-
- 1,175,25295.1%White alone
- 20,4891.7%Hispanic
- 15,8031.3%Asian alone
- 11,6060.9%Two or more races
- 8,3540.7%Black alone
- 2,6980.2%American Indian alone
- 1,2540.1%Other race alone
- 3300.03%Native Hawaiian and Other
Pacific Islander alone

-
- 1,208,10186.6%White alone
- 63,4794.5%Hispanic
- 60,7244.4%Two or more races
- 36,5192.6%Asian alone
- 17,9311.3%Black alone
- 6,6150.5%Other race alone
- 1,0140.07%American Indian alone
- 8480.06%Native Hawaiian and Other
Pacific Islander alone

Income and house value in Cornish
- Median household income in 2022
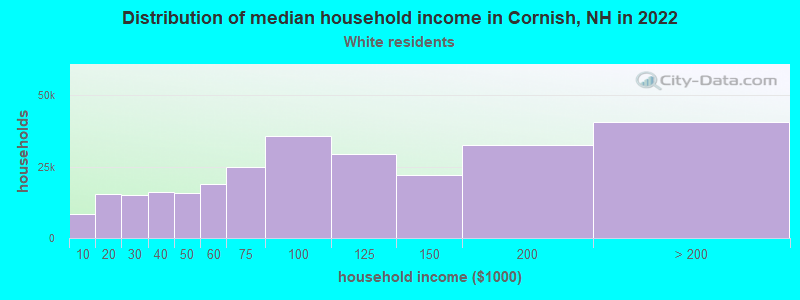
- $104,633White non-Hispanic householders
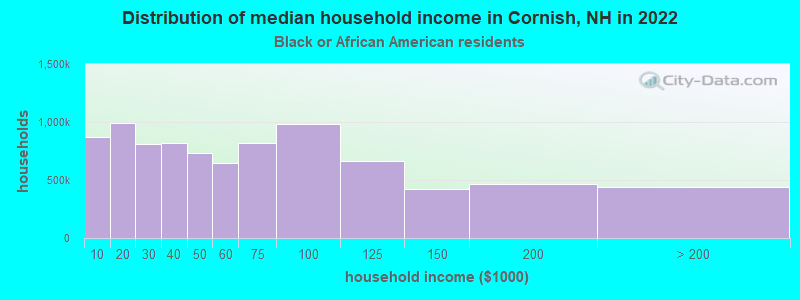
- $23,210Black householders
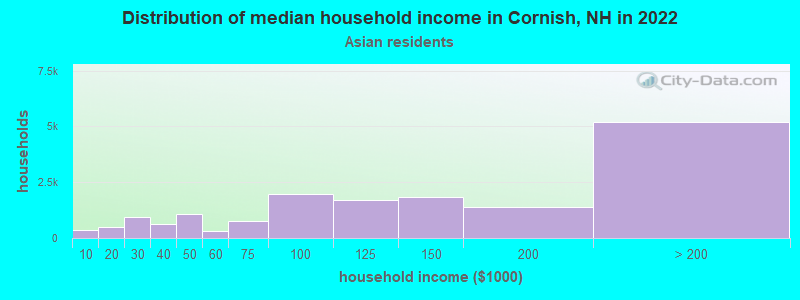
- $159,632Asian householders
- $82,443Two or more races householders
- $54,963Hispanic or Latino race householders
- Median 2022 house value
- $280,292White Non-Hispanic householders
- $302,909Asian householders
- $275,984Two or more races householders
- $201,939Hispanic or Latino householders
Household income for White non-Hispanic householders
Household income for Black householders
Household income for Asian householders
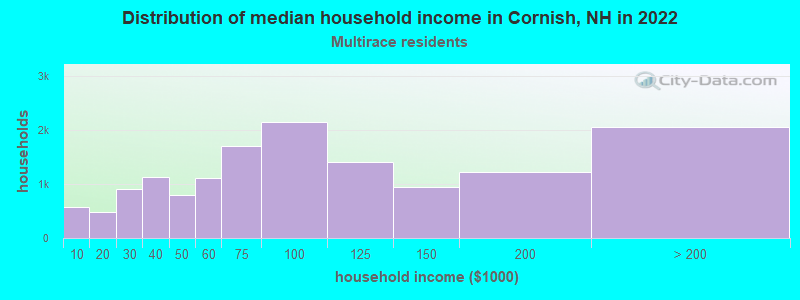
Household income for Two or more races householders
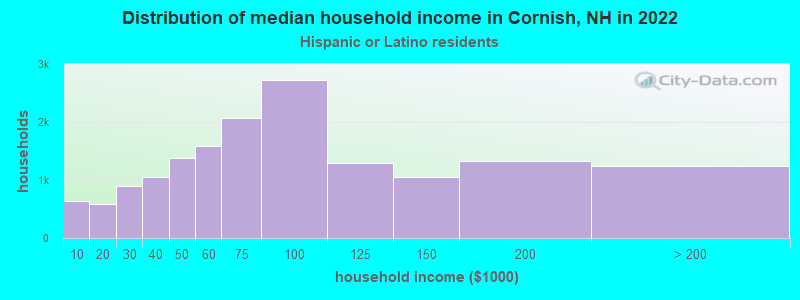
Household income for Hispanic or Latino race householders
Foreign-born residents in Cornish
41 residents are foreign born (1.1% Europe, 0.7% North America, 0.4% Asia, 0.3% Latin America).
| This city: | 2.5% |
| New Hampshire: | 4.4% |
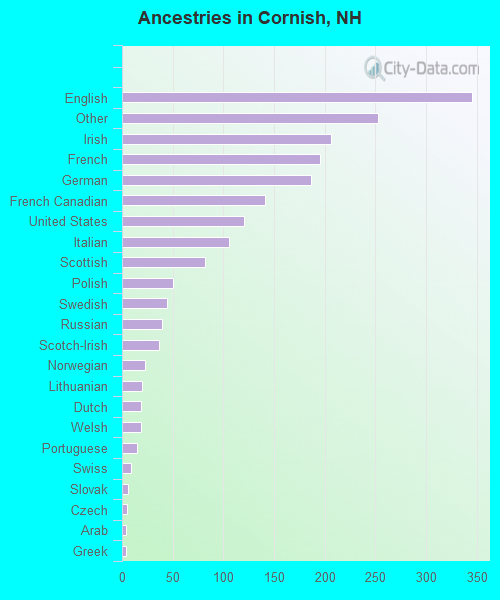
Ancestries in Cornish

- 34517.9%English
- 25313.1%Other
- 20610.7%Irish
- 19510.1%French
- 1879.7%German
- 1417.3%French Canadian
- 1206.2%United States
- 1065.5%Italian
- 824.2%Scottish
- 502.6%Polish
- 442.3%Swedish
- 392.0%Russian
- 371.9%Scotch-Irish
- 231.2%Norwegian
- 201.0%Lithuanian
- 191.0%Dutch
- 191.0%Welsh
- 150.8%Portuguese
- 90.5%Swiss
- 60.3%Slovak
- 50.3%Czech
- 40.2%Arab
- 40.2%Greek
- 20.1%Hungarian
- 10.05%West Indian
Zip codes: 03745.