Races in Cornville, Maine (ME) Detailed Stats
Ancestries, Foreign-born residents, place of birth

Recent posts about races in Cornville, Maine on our local forum with over 2,400,000 registered users:
 | Yard Sale Scores (53 replies) |
1.5% of Cornville, ME residents are foreign-born , which is 101.3% less than the foreign-born rate of 3.0% across the entire state of Maine.
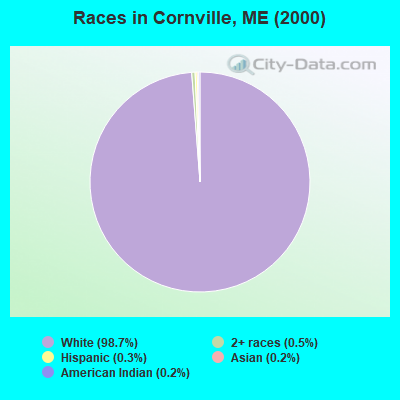
Race distribution in Cornville

- 1,19298.7%White alone
- 60.5%Two or more races
- 40.3%Hispanic
- 30.2%Asian alone
- 20.2%American Indian alone
- 10.08%Black alone
2000
2022
-
- 1,230,29796.5%White alone
- 11,7310.9%Two or more races
- 9,3600.7%Hispanic
- 9,0140.7%Asian alone
- 6,4400.5%Black alone
- 6,9110.5%American Indian alone
- 8360.07%Other race alone
- 3340.03%Native Hawaiian and Other
Pacific Islander alone

-
- 1,249,23390.2%White alone
- 58,3574.2%Two or more races
- 28,7172.1%Hispanic
- 21,5831.6%Black alone
- 16,1511.2%Asian alone
- 5,8730.4%Other race alone
- 5,2050.4%American Indian alone
- 2210.02%Native Hawaiian and Other
Pacific Islander alone

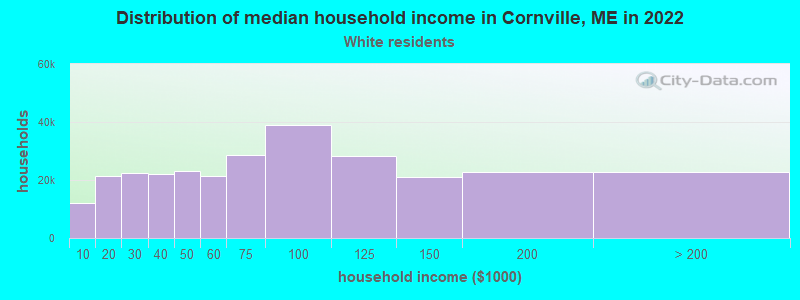
Income and house value in Cornville
- Median household income in 2022
- $71,286White non-Hispanic householders
- Median 2022 house value
- $210,655White Non-Hispanic householders
Household income for White non-Hispanic householders
Foreign-born residents in Cornville
18 residents are foreign born
| This city: | 1.5% |
| Maine: | 2.9% |
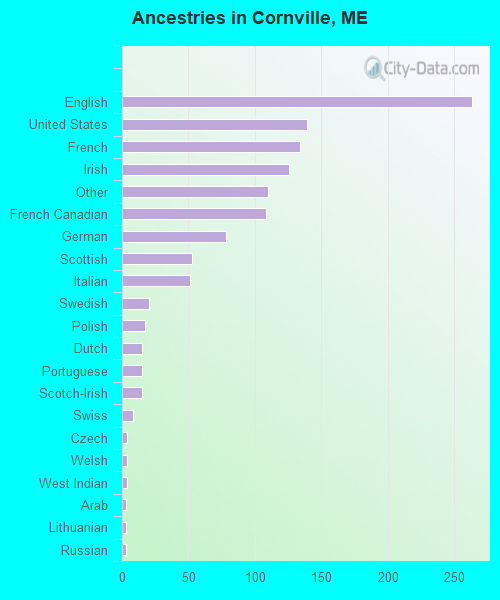
Ancestries in Cornville

- 26322.4%English
- 13911.8%United States
- 13411.4%French
- 12610.7%Irish
- 1109.4%Other
- 1089.2%French Canadian
- 786.6%German
- 534.5%Scottish
- 514.3%Italian
- 201.7%Swedish
- 171.4%Polish
- 151.3%Dutch
- 151.3%Portuguese
- 151.3%Scotch-Irish
- 80.7%Swiss
- 40.3%Czech
- 40.3%Welsh
- 40.3%West Indian
- 30.3%Arab
- 30.3%Lithuanian
- 30.3%Russian
- 20.2%Hungarian
Zip codes: 04976.