Races in Corporation of Ranson, West Virginia (WV) Detailed Stats
Ancestries, Foreign-born residents, place of birth

Discuss Corporation of Ranson, West Virginia races on our local forum with over 2,400,000 registered users
0.4% of Corporation of Ranson, WV residents are foreign-born , which is 168.3% less than the foreign-born rate of 1.0% across the entire state of West Virginia.
Race distribution in Corporation of Ranson

- 2,37280.4%White alone
- 42114.3%Black alone
- 933.2%Hispanic
- 431.5%Two or more races
- 110.4%Asian alone
- 70.2%Other race alone
- 30.1%American Indian alone
- 10.03%Native Hawaiian and Other
Pacific Islander alone
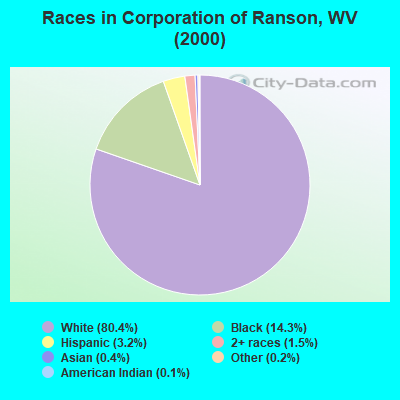
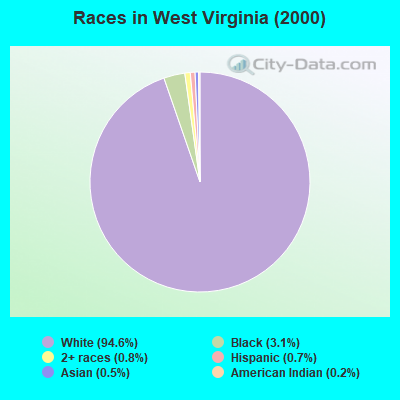
2000
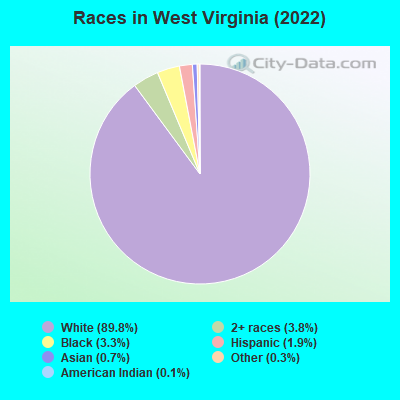
2022
-
- 1,709,96694.6%White alone
- 56,8253.1%Black alone
- 14,9830.8%Two or more races
- 12,2790.7%Hispanic
- 9,3560.5%Asian alone
- 3,4560.2%American Indian alone
- 1,1440.06%Other race alone
- 3350.02%Native Hawaiian and Other
Pacific Islander alone
-
- 1,594,12889.8%White alone
- 66,9323.8%Two or more races
- 59,3903.3%Black alone
- 34,3431.9%Hispanic
- 13,1340.7%Asian alone
- 5,2380.3%Other race alone
- 1,8800.1%American Indian alone
- 1110.01%Native Hawaiian and Other
Pacific Islander alone
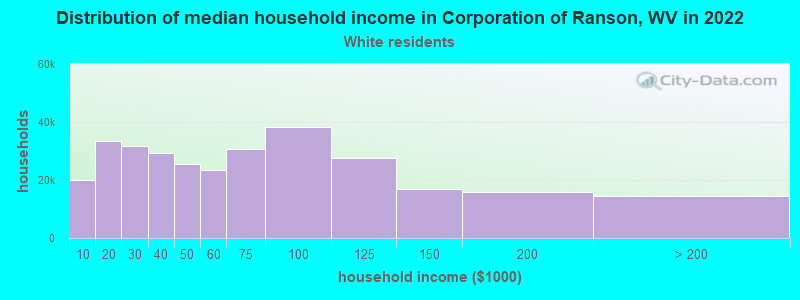
Income and house value in Corporation of Ranson
- Median household income in 2022
- $50,461White non-Hispanic householders
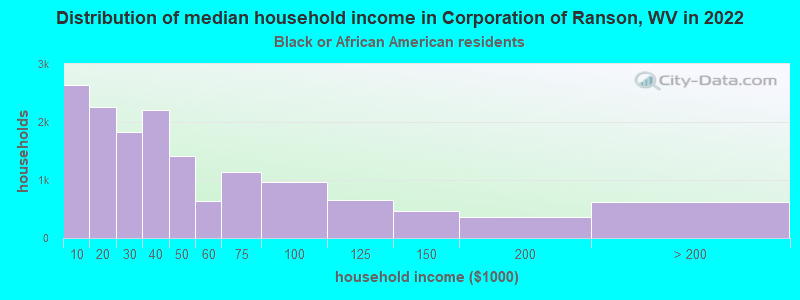
- $26,706Black householders
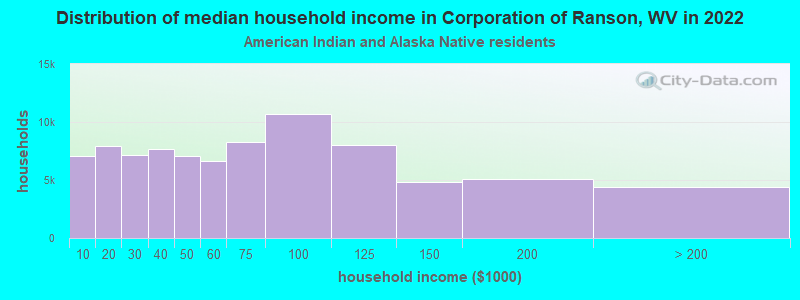
- $3,070American Indian and Alaska Native householders
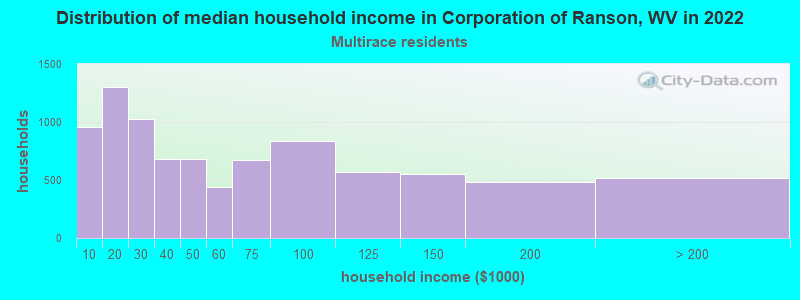
- $28,650Two or more races householders
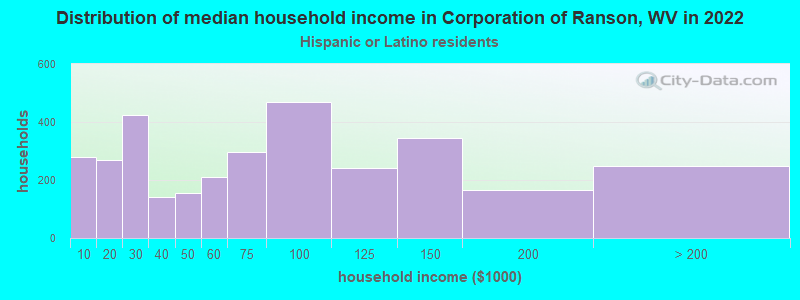
- $27,193Hispanic or Latino race householders
- Median 2022 house value
- $230,454White Non-Hispanic householders
- $240,969Black or African American householders
- $803,230American Indian or Alaska Native householders
- $94,927Two or more races householders
- $750,947Hispanic or Latino householders
Household income for White non-Hispanic householders
Household income for Black householders
Household income for American Indian and Alaska Native householders
Household income for Two or more races householders
Household income for Hispanic or Latino race householders
Foreign-born residents in Corporation of Ranson
11 residents are foreign born
| This city: | 0.4% |
| West Virginia: | 1.1% |
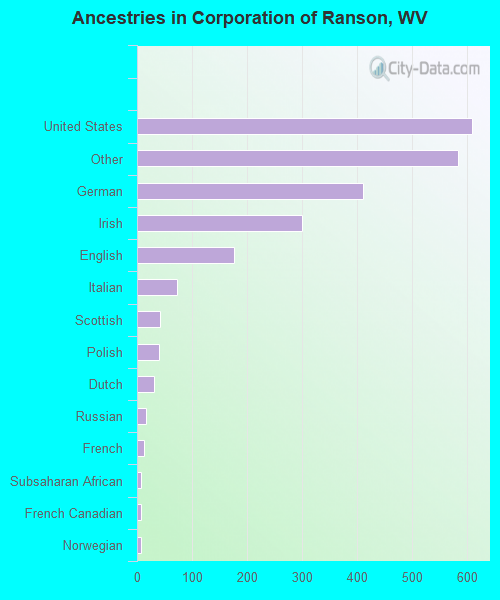
Ancestries in Corporation of Ranson

- 60926.2%United States
- 58425.2%Other
- 41117.7%German
- 30012.9%Irish
- 1767.6%English
- 723.1%Italian
- 421.8%Scottish
- 401.7%Polish
- 311.3%Dutch
- 170.7%Russian
- 120.5%French
- 80.3%Subsaharan African
- 70.3%French Canadian
- 70.3%Norwegian
- 50.2%Welsh
Zip codes: 25438.