Races in Corte Madera, California (CA) Detailed Stats
Ancestries, Foreign-born residents, place of birth
Settings
X


Recent posts about races in Corte Madera, California on our local forum with over 2,400,000 registered users:
 | What's so European about San Francisco? (98 replies) |
| European invasion (38 replies) |
| Vietnamese EV maker VinFast Opens Six "Stores" in California (4 replies) |
| Keep Marin County Beautiful! (13 replies) |
| Orinda vs Piedmont vs Larkspur for city family looking for great schools and a no-car commute to Ferry Bldg (bike okay) (61 replies) |
| Bay Area ethnic communities (84 replies) |
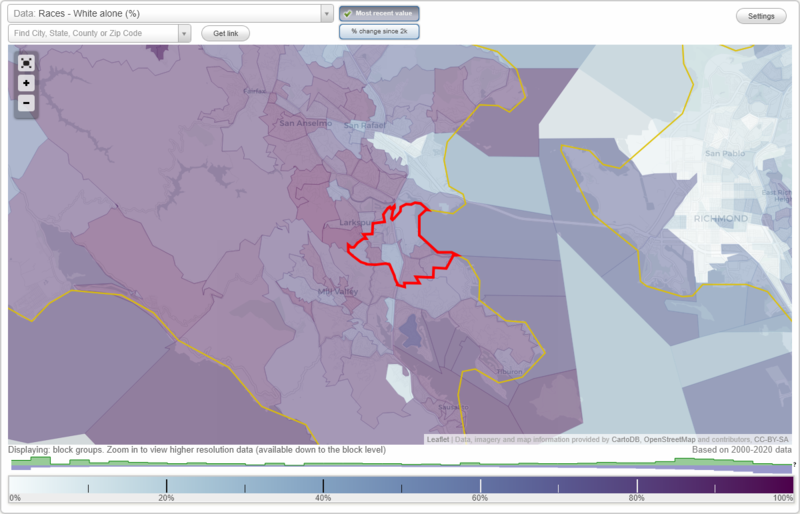
According to 2022 data, the most numerous races in Corte Madera, CA are Hispanic (721 residents), White alone (7,194 residents), and Asian alone (650 residents). 87.3% of Corte Madera residents speak English at home. 12.6% of Corte Madera, CA residents are foreign-born (4.2% born in Europe, 3.1% born in Asia, 2.8% born in Latin America), which is 105.9% less than the foreign-born rate of 26.0% across the entire state of California.
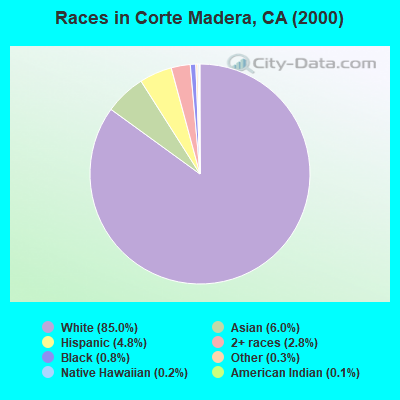
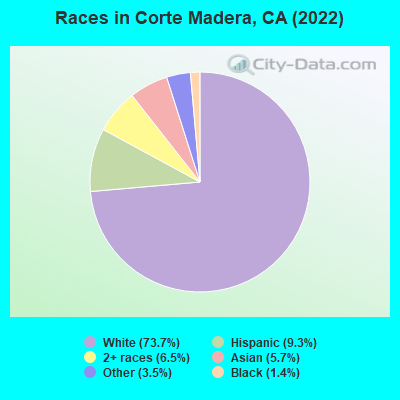
Race distribution in Corte Madera
2000
2022

- 7,73185.0%White alone
- 5496.0%Asian alone
- 4364.8%Hispanic
- 2572.8%Two or more races
- 710.8%Black alone
- 290.3%Other race alone
- 140.2%Native Hawaiian and Other
Pacific Islander alone - 130.1%American Indian alone
-
- 7,19472.6%White alone
- 7217.3%Hispanic
- 6506.6%Asian alone
- 5675.7%Two or more races
- 2892.9%Other race alone
- 2212.2%Black alone
2000
2022
-
- 15,816,79046.7%White alone
- 10,966,55632.4%Hispanic
- 3,648,86010.8%Asian alone
- 2,181,9266.4%Black alone
- 903,1152.7%Two or more races
- 178,9840.5%American Indian alone
- 103,7360.3%Native Hawaiian and Other
Pacific Islander alone - 71,6810.2%Other race alone

-
- 15,732,18440.3%Hispanic
- 13,160,42633.7%White alone
- 5,957,86715.3%Asian alone
- 2,025,2185.2%Black alone
- 1,663,2224.3%Two or more races
- 251,6180.6%Other race alone
- 135,7770.3%Native Hawaiian and Other
Pacific Islander alone - 103,0300.3%American Indian alone

Income and house value in Corte Madera
- Median household income in 2022
- $175,616White non-Hispanic householders
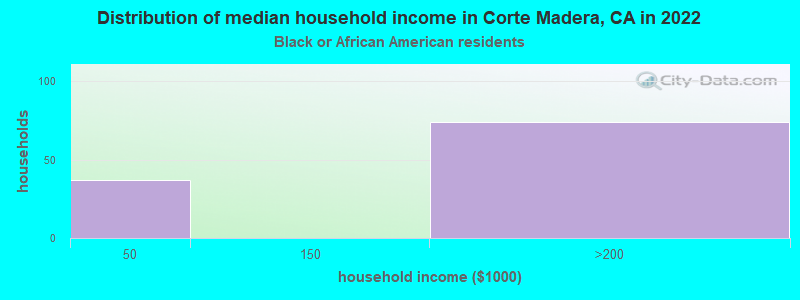
- $68,345Black householders
- over $200,000American Indian and Alaska Native householders
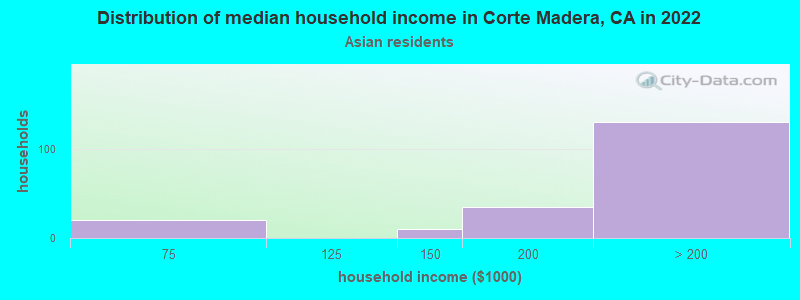
- $186,384Asian householders
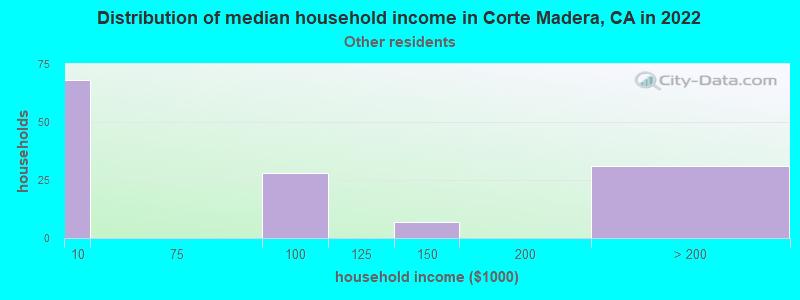
- $157,794Some other race householders
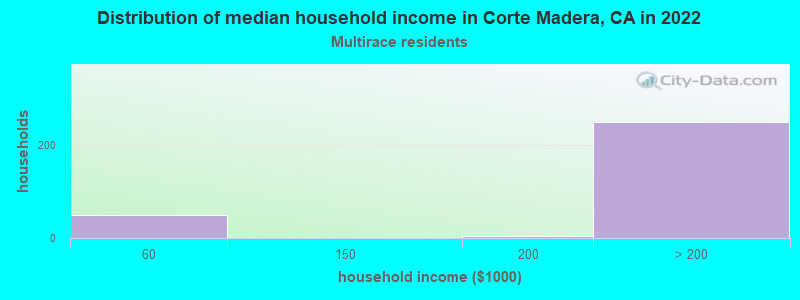
- over $200,000Two or more races householders
- over $200,000Hispanic or Latino race householders
- Median 2022 house value
- over $1,000,000White Non-Hispanic householders
- over $1,000,000Black or African American householders
- over $1,000,000Asian householders
- over $1,000,000Some other race householders
- over $1,000,000Two or more races householders
- over $1,000,000Hispanic or Latino householders
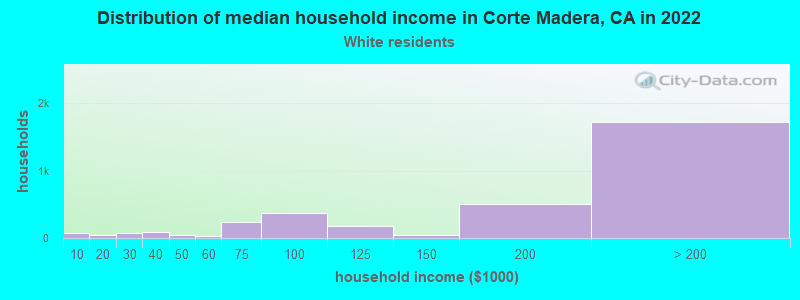
Household income for White non-Hispanic householders
Household income for Black householders
Household income for Asian householders
Household income for Some other race householders
Household income for Two or more races householders
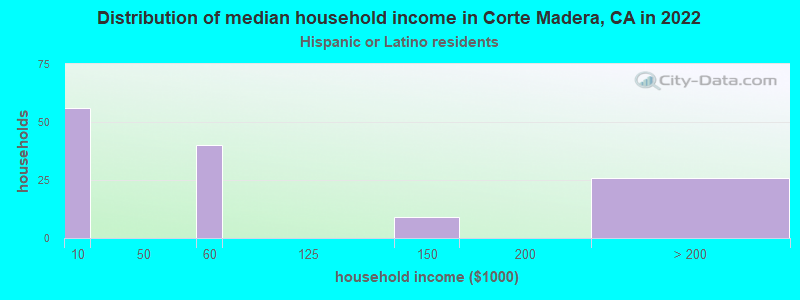
Household income for Hispanic or Latino race householders
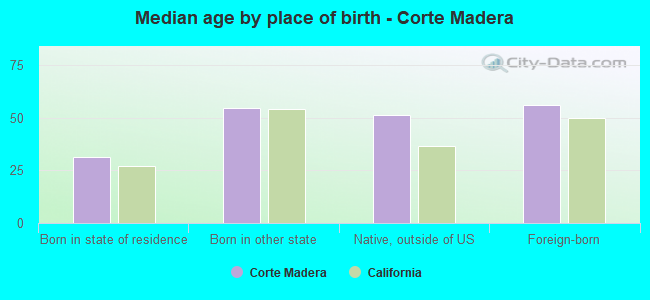
Median age by race in Corte Madera
- 52.2Median age for White residents
- 50.9Males
- 52.8Females
- 22.0Median age for Black or African American residents
- 22.0Males
- 27.7Females
- 49.5Median age for Asian residents
- 37.2Males
- 53.8Females
- 31.7Median age for Other race residents
- 14.9Males
- 49.9Females
- 16.1Median age for Two or more races residents
- 19.2Males
- 9.7Females
- 50.3Median age for White alone residents
- 49.9Males
- 50.8Females
- 41.2Median age for Hispanic or Latino residents
- 41.2Males
- 51.8Females
Owner/renter occupied households by race in Corte Madera
- House owners and renters - White residents
- 2,13069.9%Owner occupied
- 91630.1%Renter occupied
- House owners and renters - Black or African American residents
- 89100.0%Renter occupied
- House owners and renters - Asian residents
- 16066.7%Owner occupied
- 8033.3%Renter occupied
- House owners and renters - Other race residents
- 2836.0%Owner occupied
- 4964.0%Renter occupied
- House owners and renters - Two or more races residents
- 12763.8%Owner occupied
- 7236.2%Renter occupied
- House owners and renters - White alone residents
- 2,29370.5%Owner occupied
- 95829.5%Renter occupied
- House owners and renters - Hispanic or Latino residents
- 174100.0%Renter occupied
Language usage in Corte Madera
- English speakers - Total
- 87.3% of residents of Corte Madera speak English at home.
- 2.0% of residents speak Spanish at home
- 12465.3%Speak English very well
- 6634.7%Speak English less than very well
- 11.4% of residents speak other language at home
- 91786.5%Speak English very well
- 14313.5%Speak English less than very well
- English speakers - Born in the United States
- 96.5% of residents of Corte Madera speak English at home.
- 0.9% of residents speak Spanish at home
- 1550.0%Speak English very well
- 1550.0%Speak English less than very well
- 2.4% of residents speak other language at home
- 84100.0%Speak English very well
All residents speak only English at home
- English speakers - Foreign-born
- 38.1% of residents of Corte Madera speak English at home.
- 8.5% of residents speak Spanish at home
- 5553.4%Speak English very well
- 4846.6%Speak English less than very well
- 58.3% of residents speak other language at home
- 56579.9%Speak English very well
- 14220.1%Speak English less than very well
White (Caucasian) - Speak only English
| Native: | 100.0% (6,042) |
| Foreign-born: | 50.6% (255) |
White (Caucasian) - Speak another language
| Native: | 3.1% (188) |
| Foreign-born: | 59.1% (297) |
Asian - Speak only English
| Native: | 72.8% (362) |
| Foreign-born: | 43.3% (87) |
Asian - Speak another language
| Native: | 27.0% (134) |
| Foreign-born: | 58.9% (118) |
Two or more races - Speak only English
| Native: | 74.3% (582) |
| Foreign-born: | 35.8% (215) |
Two or more races - Speak another language
| Native: | 5.9% (47) |
| Foreign-born: | 41.3% (248) |
White alone - Speak only English
| Native: | 96.2% (6,068) |
| Foreign-born: | 40.2% (271) |
White alone - Speak another language
| Native: | 3.6% (228) |
| Foreign-born: | 57.5% (387) |
Hispanic or Latino - Speak another language
| Native: | 2.0% (10) |
| Foreign-born: | 91.9% (101) |
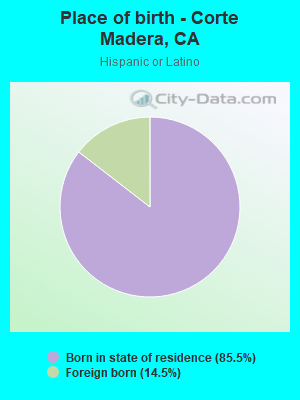
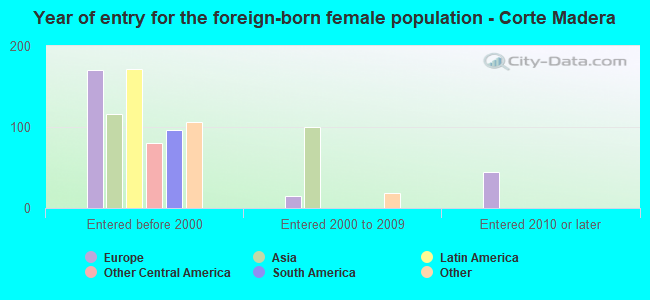
Foreign-born residents in Corte Madera
1,239 residents are foreign born (4.2% Europe, 3.1% Asia, 2.8% Latin America).
| This city: | 12.6% |
| California: | 100.0% |
Marital status for residents in Corte Madera
Marital status - White (Caucasian) population 15 years and over
- Males
- 26.0%Never married
- 59.5%Now married
- 1.2%Separated
- 2.9%Widowed
- 10.5%Divorced
- Females
- 19.0%Never married
- 50.5%Now married
- 1.6%Separated
- 10.9%Widowed
- 18.0%Divorced
Women who gave birth in the past 12 months
| Now married: | 46.3% (24) |
| Unmarried: | 53.7% (28) |
Women who did not give birth in the past 12 months
| Now married: | 50.3% (525) |
| Unmarried: | 49.7% (519) |
Marital status - Black or African American population 15 years and over
- Males
- 100.0%Never married
- 0.0%Now married
- 0.0%Separated
- 0.0%Widowed
- 0.0%Divorced
- Females
- 67.9%Never married
- 19.3%Now married
- 0.0%Separated
- 0.0%Widowed
- 12.8%Divorced
Women who did not give birth in the past 12 months
| Now married: | 22.1% (20) |
| Unmarried: | 77.9% (70) |
Marital status - Asian population 15 years and over
- Males
- 32.8%Never married
- 67.2%Now married
- 0.0%Separated
- 0.0%Widowed
- 0.0%Divorced
- Females
- 45.7%Never married
- 35.8%Now married
- 0.0%Separated
- 0.0%Widowed
- 18.5%Divorced
Women who did not give birth in the past 12 months
| Now married: | 42.2% (77) |
| Unmarried: | 57.8% (106) |
Marital status - Other race population 15 years and over
- Males
- 0.0%Never married
- 100.0%Now married
- 0.0%Separated
- 0.0%Widowed
- 0.0%Divorced
- Females
- 20.1%Never married
- 56.7%Now married
- 0.0%Separated
- 0.0%Widowed
- 23.1%Divorced
Women who did not give birth in the past 12 months
| Now married: | 68.6% (61) |
| Unmarried: | 31.4% (28) |
Marital status - Two or more races population 15 years and over
- Males
- 21.9%Never married
- 60.9%Now married
- 17.2%Separated
- 0.0%Widowed
- 0.0%Divorced
- Females
- 23.5%Never married
- 60.0%Now married
- 0.0%Separated
- 16.5%Widowed
- 0.0%Divorced
Women who gave birth in the past 12 months
| Now married: | 100.0% (33) |
| Unmarried: | 0.0% (0) |
Women who did not give birth in the past 12 months
| Now married: | 67.1% (130) |
| Unmarried: | 32.9% (64) |
Marital status - White alone, not Hispanic / Latino population 15 years and over
- Males
- 27.0%Never married
- 61.1%Now married
- 1.2%Separated
- 3.0%Widowed
- 7.7%Divorced
- Females
- 16.8%Never married
- 51.0%Now married
- 1.7%Separated
- 11.8%Widowed
- 18.5%Divorced
Women who gave birth in the past 12 months
| Now married: | 46.3% (29) |
| Unmarried: | 53.7% (33) |
Women who did not give birth in the past 12 months
| Now married: | 56.2% (616) |
| Unmarried: | 43.8% (481) |
Marital status - Hispanic or Latino population 15 years and over
- Males
- 0.0%Never married
- 38.2%Now married
- 0.0%Separated
- 0.0%Widowed
- 61.8%Divorced
- Females
- 40.3%Never married
- 42.7%Now married
- 0.0%Separated
- 0.0%Widowed
- 17.0%Divorced
Women who did not give birth in the past 12 months
| Now married: | 10.3% (20) |
| Unmarried: | 89.7% (172) |
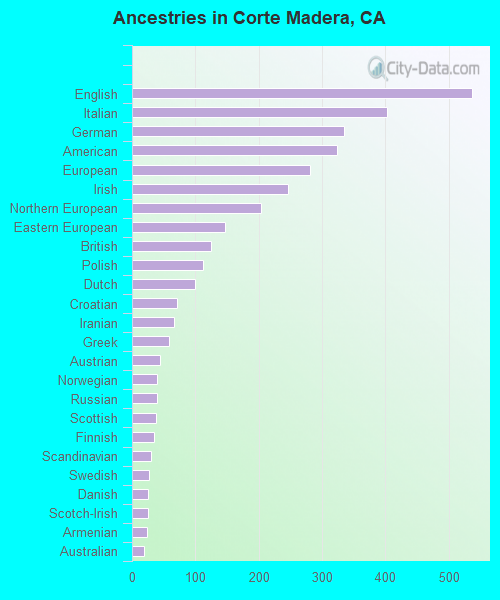
Ancestries in Corte Madera

- 3699.5%European
- 3278.4%Irish
- 2797.2%English
- 2536.5%German
- 2175.6%Eastern European
- 1894.9%American
- 1132.9%Italian
- 962.5%Brazilian
- 782.0%Iranian
- 711.8%British
- 651.7%Polish
- 641.6%Scottish
- 561.4%Russian
- 481.2%Danish
- 401.0%Norwegian
- 401.0%Portuguese
- 391.0%Australian
- 330.8%Armenian
- 330.8%Northern European
- 320.8%Greek
- 260.7%French
- 250.6%Scotch-Irish
- 220.6%Finnish
- 180.5%Swiss
- 170.4%Turkish
- 150.4%Swedish
- 150.4%Ukrainian
- 120.3%Celtic
- 100.3%Dutch
- 90.2%Croatian
- 90.2%Slovene
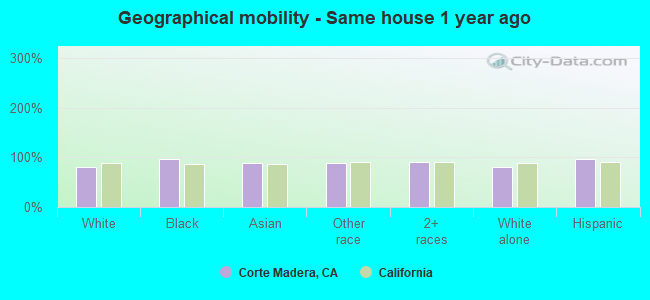
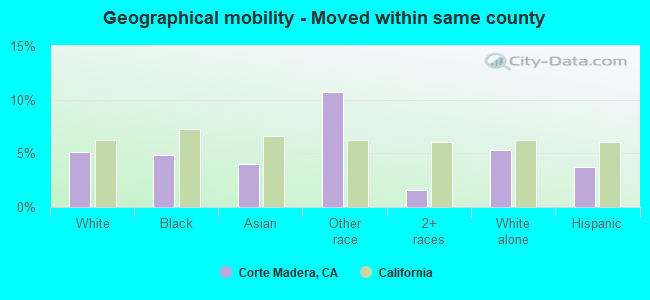
Geographical mobility in Corte Madera

- Same house 1 year ago
- 5,36980.9%White (Caucasian)
- 21496.3%Black or African American
- 55989.0%Asian
- 33688.2%Other race
- 1,19390.9%Two or more races
- 5,81980.2%White alone, not Hispanic / Latino
- 69197.0%Hispanic or Latino
-
- Moved within same county
- 3385.1%White / Caucasian
- 114.8%Black or African American
- 254.0%Asian
- 4110.7%Other race
- 211.6%Two or more races
- 3885.3%White alone, not Hispanic / Latino
- 263.7%Hispanic or Latino
-
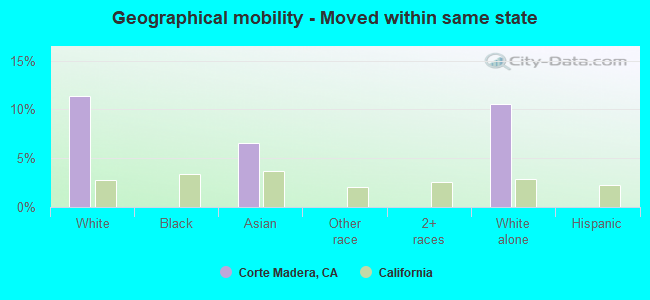
- Moved within same state
- 75511.4%White / Caucasian
- 416.6%Asian
- 76510.5%White alone, not Hispanic / Latino
-
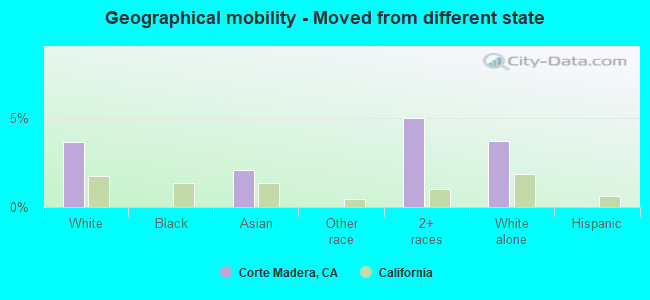
- Moved from different state
- 2403.6%White / Caucasian
- 132.1%Asian
- 655.0%Two or more races
- 2663.7%White alone, not Hispanic / Latino
-
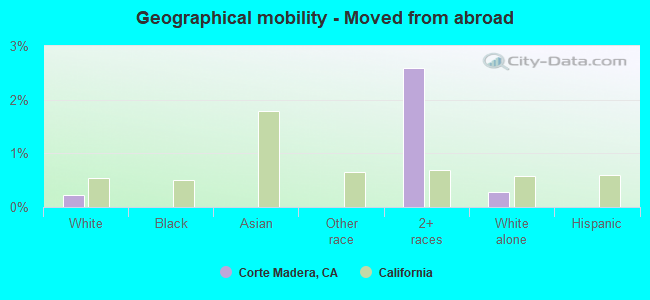
- Moved from abroad
- 140.2%White
- 342.6%Two or more races
- 200.3%White alone, not Hispanic / Latino
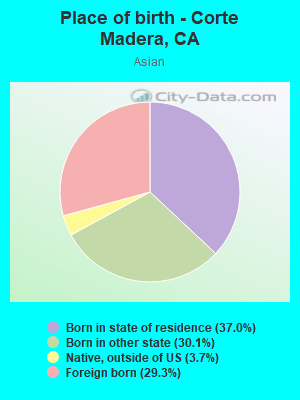
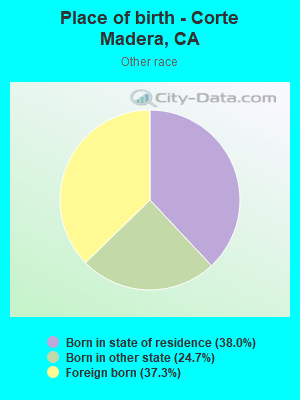
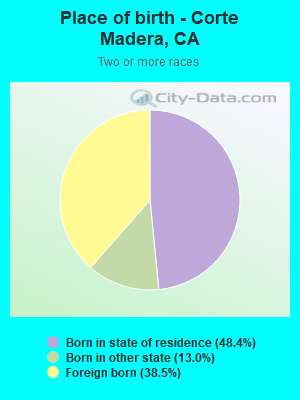
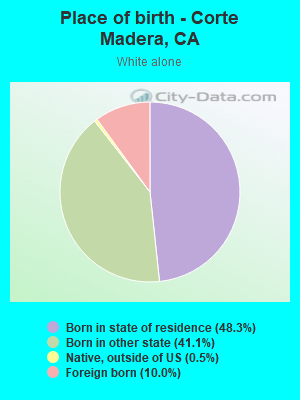
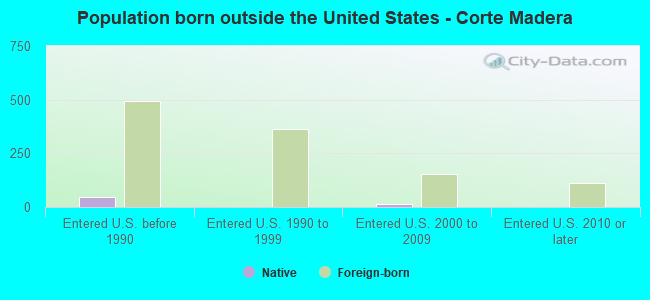
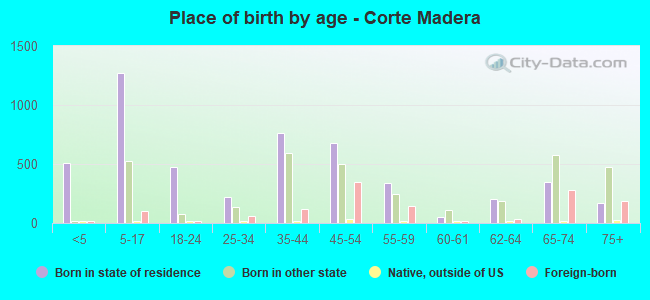
Children Nativity (place of birth) in Corte Madera
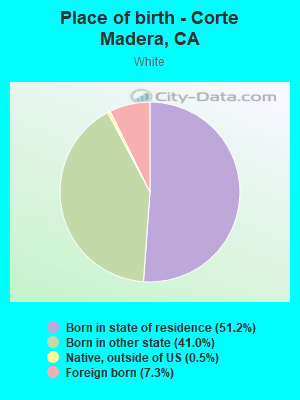
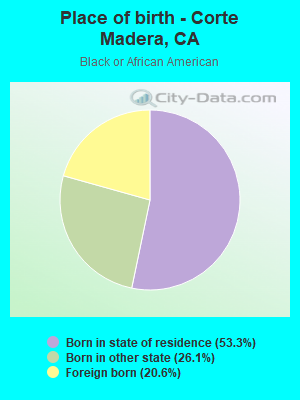
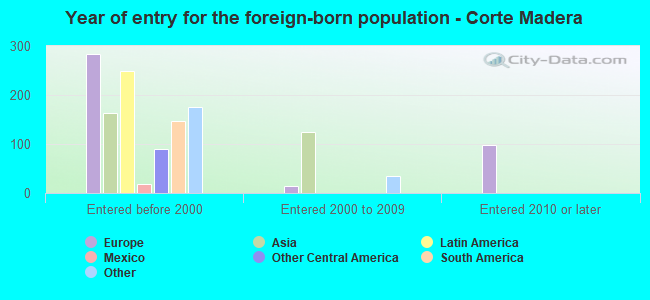
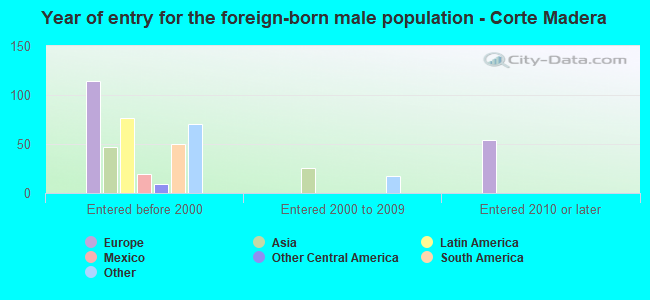
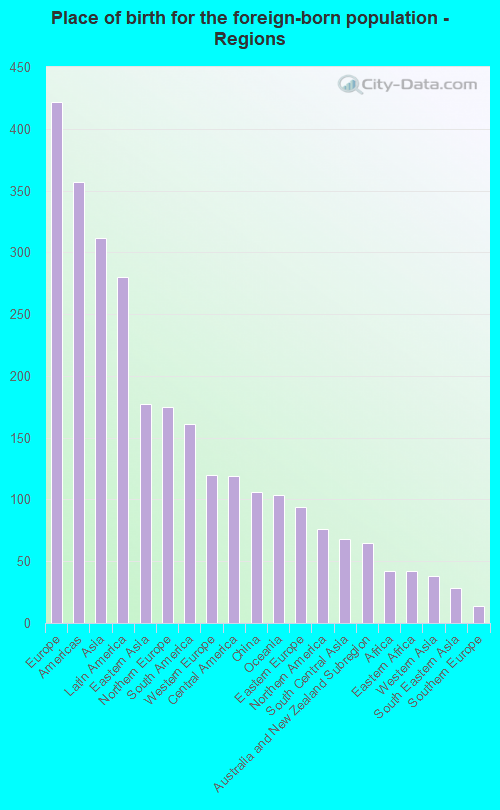
Place of birth for residents in Corte Madera
![Place of birth for the foreign-born population - Regions]()
- 422Europe
- 357Americas
- 312Asia
- 280Latin America
- 177Eastern Asia
- 175Northern Europe
- 161South America
- 120Western Europe
- 119Central America
- 106China
- 104Oceania
- 94Eastern Europe
- 76Northern America
- 68South Central Asia
- 65Australia and New Zealand Subregion
- 42Africa
- 42Eastern Africa
- 38Western Asia
- 28South Eastern Asia
- 14Southern Europe
![Place of birth for the foreign-born population - Countries]()
- 149Brazil
- 106China
- 84Russia
- 82Germany
- 76Canada
- 61Denmark
- 54Korea
- 50El Salvador
- 42Kenya
- 41Australia
- 38France
- 38Iran
- 30Kazakhstan
- 27United Kingdom
- 24New Zealand
- 23Norway
- 23Sweden
- 21Mexico
- 20Costa Rica
- 19Fiji
- 18Israel
- 17Guatemala
- 16Japan
- 15Malaysia
- 14Greece
- 14Ireland
- 13Philippines
- 13Scotland
- 12England
- 11Argentina
- 10Armenia
- 10Croatia
- 10Lebanon
- 10Panama
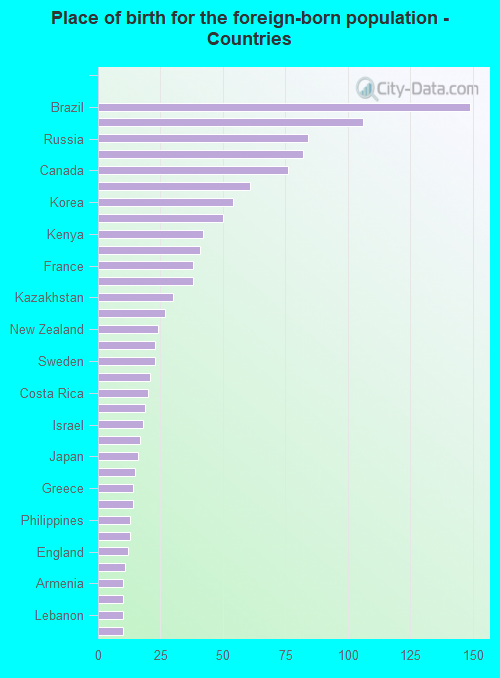
Grandparents responsible for own grandchildren in Corte Madera
Zip codes: 94925.