Races in Cortlandt, New York (NY) Detailed Stats
Ancestries, Foreign-born residents, place of birth
11.4% of Cortlandt, NY residents are foreign-born (4.9% born in Europe, 3.6% born in Latin America, 2.3% born in Asia), which is 93.6% less than the foreign-born rate of 22.0% across the entire state of New York.
Race distribution in Cortlandt

- 32,47084.4%White alone
- 2,7667.2%Hispanic
- 1,6724.3%Black alone
- 9782.5%Asian alone
- 4501.2%Two or more races
- 790.2%Other race alone
- 510.1%American Indian alone
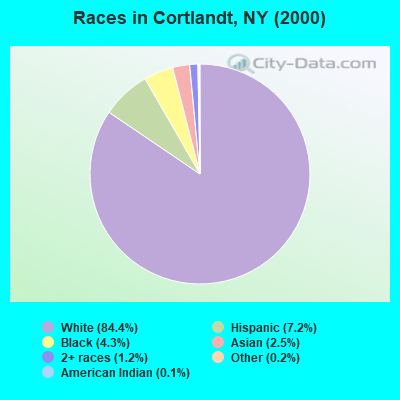
2000
2022
-
- 11,760,98162.0%White alone
- 2,867,58315.1%Hispanic
- 2,812,62314.8%Black alone
- 1,035,9265.5%Asian alone
- 366,1161.9%Two or more races
- 75,4990.4%Other race alone
- 52,4990.3%American Indian alone
- 5,2300.03%Native Hawaiian and Other
Pacific Islander alone

-
- 10,408,93352.9%White alone
- 3,867,29919.7%Hispanic
- 2,633,84013.4%Black alone
- 1,776,2869.0%Asian alone
- 732,6703.7%Two or more races
- 216,1101.1%Other race alone
- 35,0820.2%American Indian alone
- 6,9310.04%Native Hawaiian and Other
Pacific Islander alone

Income and house value in Cortlandt
- Median household income in 2022
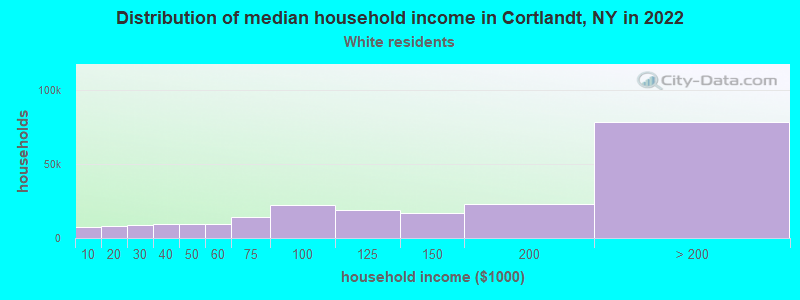
- $138,040White non-Hispanic householders
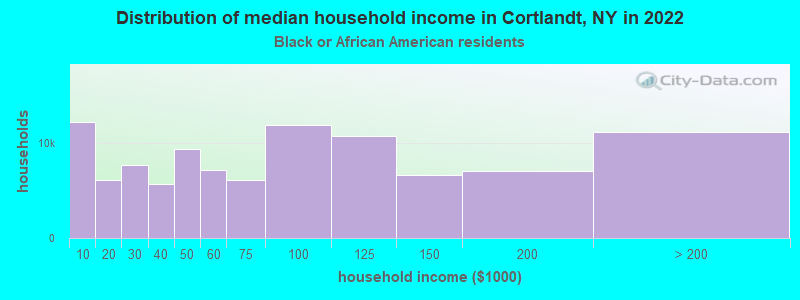
- $123,166Black householders
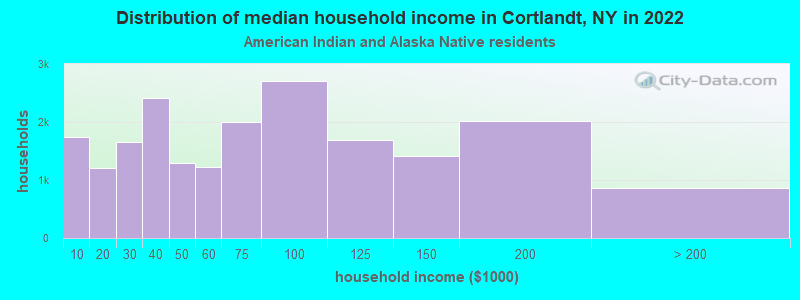
- $100,925American Indian and Alaska Native householders
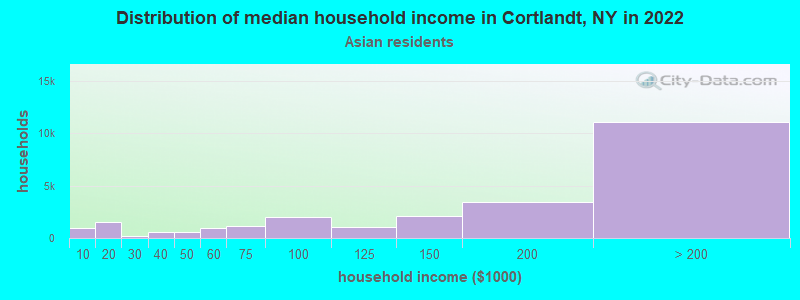
- $190,349Asian householders
- $100,923Some other race householders
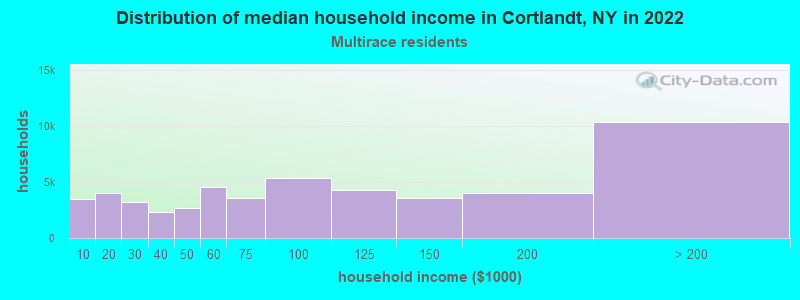
- $113,588Two or more races householders
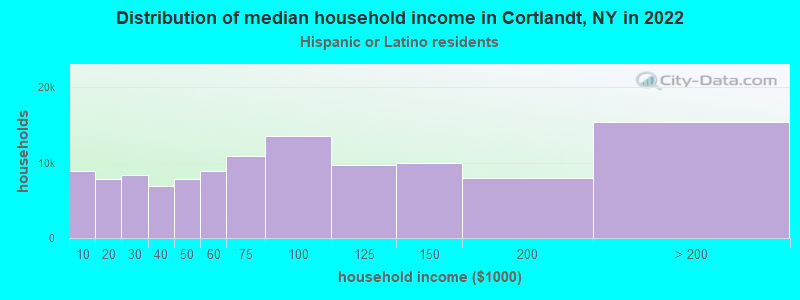
- $102,664Hispanic or Latino race householders
- Median 2022 house value
- $521,300White Non-Hispanic householders
- $482,208Black or African American householders
- $629,247American Indian or Alaska Native householders
- $660,565Asian householders
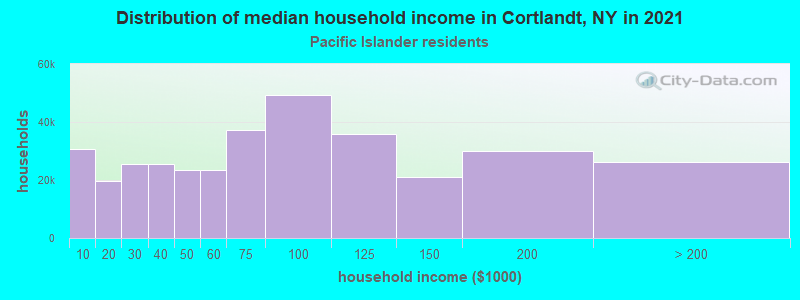
- $416,462Native Hawaiian and other Pacific Islander householders
- $501,531Some other race householders
- $581,937Two or more races householders
- $456,887Hispanic or Latino householders
Household income for White non-Hispanic householders
Household income for Black householders
Household income for American Indian and Alaska Native householders
Household income for Asian householders
Household income for Native Hawaiian and other Pacific Islander householders
Household income for Two or more races householders
Household income for Hispanic or Latino race householders
Foreign-born residents in Cortlandt
4,371 residents are foreign born (4.9% Europe, 3.6% Latin America, 2.3% Asia).
| This city: | 11.4% |
| New York: | 20.4% |
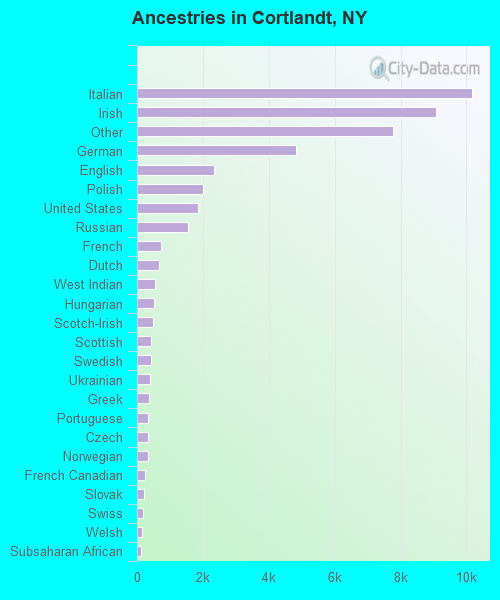
Ancestries in Cortlandt

- 10,17722.0%Italian
- 9,08419.6%Irish
- 7,77416.8%Other
- 4,82910.4%German
- 2,3405.0%English
- 1,9964.3%Polish
- 1,8594.0%United States
- 1,5623.4%Russian
- 7231.6%French
- 6681.4%Dutch
- 5321.1%West Indian
- 5171.1%Hungarian
- 4831.0%Scotch-Irish
- 4220.9%Scottish
- 4130.9%Swedish
- 4040.9%Ukrainian
- 3710.8%Greek
- 3380.7%Portuguese
- 3340.7%Czech
- 3340.7%Norwegian
- 2380.5%French Canadian
- 2020.4%Slovak
- 1830.4%Swiss
- 1660.4%Welsh
- 1290.3%Subsaharan African
- 1210.3%Lithuanian
- 1040.2%Danish
- 470.1%Arab
Zip codes: 10567.