Races in Country Club, Florida (FL) Detailed Stats
Data:
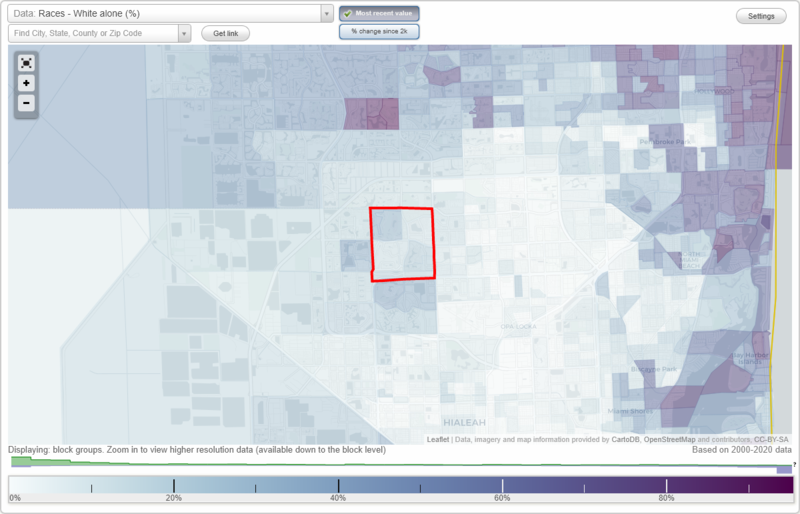
Races - White alone (%)
Races - White alone (% change since 2000)
Races - Black alone (%)
Races - Black alone (% change since 2000)
Races - American Indian alone (%)
Races - American Indian alone (% change since 2000)
Races - Asian alone (%)
Races - Asian alone (% change since 2000)
Races - Hispanic (%)
Races - Hispanic (% change since 2000)
Races - Native Hawaiian and Other Pacific Islander alone (%)
Races - Native Hawaiian and Other Pacific Islander alone (% change since 2000)
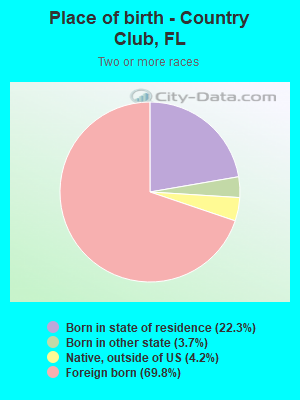
Races - Two or more races(%)
Races - Two or more races(% change since 2000)
Races - Other race alone (%)
Races - Other race alone (% change since 2000)
Racial diversity
Place of birth - Born in state of residence (%)
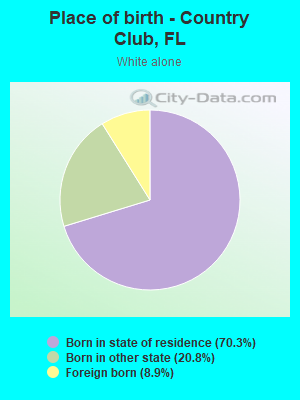
Place of birth - Born in state of residence (%) - White
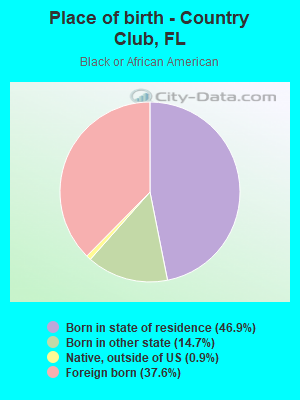
Place of birth - Born in state of residence (%) - Black or African American
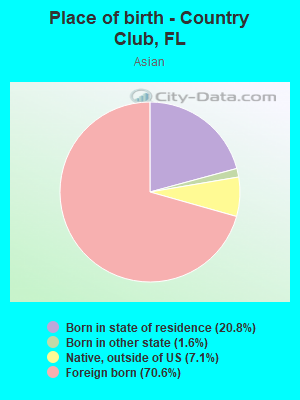
Place of birth - Born in state of residence (%) - Asian
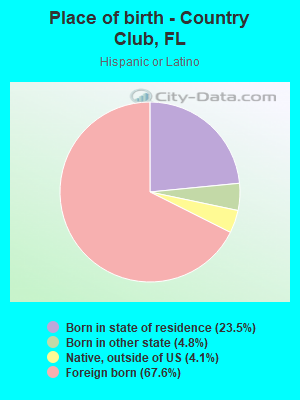
Place of birth - Born in state of residence (%) - Hispanic or Latino
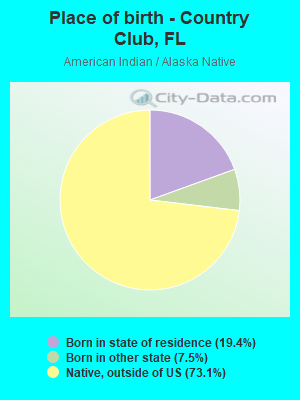
Place of birth - Born in state of residence (%) - American Indian and Alaska Native
Place of birth - Born in state of residence (%) - Multirace
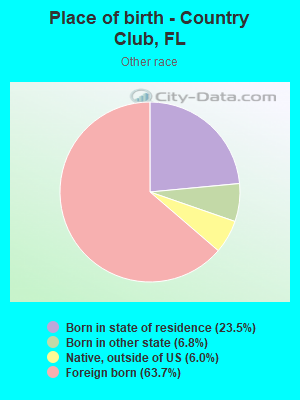
Place of birth - Born in state of residence (%) - Other Race
Place of birth - Born in other state (%)
Place of birth - Born in other state (%) - White
Place of birth - Born in other state (%) - Black or African American
Place of birth - Born in other state (%) - Asian
Place of birth - Born in other state (%) - Hispanic or Latino
Place of birth - Born in other state (%) - American Indian and Alaska Native
Place of birth - Born in other state (%) - Multirace
Place of birth - Born in other state (%) - Other Race
Place of birth - Native, outside of US (%)
Place of birth - Native, outside of US (%) - White
Place of birth - Native, outside of US (%) - Black or African American
Place of birth - Native, outside of US (%) - Asian
Place of birth - Native, outside of US (%) - Hispanic or Latino
Place of birth - Native, outside of US (%) - American Indian and Alaska Native
Place of birth - Native, outside of US (%) - Multirace
Place of birth - Native, outside of US (%) - Other Race
Place of birth - Foreign born (%)
Place of birth - Foreign born (%) - White
Place of birth - Foreign born (%) - Black or African American
Place of birth - Foreign born (%) - Asian
Place of birth - Foreign born (%) - Hispanic or Latino
Place of birth - Foreign born (%) - American Indian and Alaska Native
Place of birth - Foreign born (%) - Multirace
Place of birth - Foreign born (%) - Other Race
Residents speaking English at home (%)
Residents speaking English at home - Born in the United States (%)
Residents speaking English at home - Native, born elsewhere (%)
Residents speaking English at home - Foreign born (%)
Residents speaking Spanish at home (%)
Residents speaking Spanish at home - Born in the United States (%)
Residents speaking Spanish at home - Native, born elsewhere (%)
Residents speaking Spanish at home - Foreign born (%)
Residents speaking other language at home (%)
Residents speaking other language at home - Born in the United States (%)
Residents speaking other language at home - Native, born elsewhere (%)
Residents speaking other language at home - Foreign born (%)
Marital status - Never married (%)
Marital status - Now married (%)
Marital status - Separated (%)
Marital status - Widowed (%)
Marital status - Divorced (%)
Ancestries Reported - Arab (%)
Ancestries Reported - Czech (%)
Ancestries Reported - Danish (%)
Ancestries Reported - Dutch (%)
Ancestries Reported - English (%)
Ancestries Reported - French (%)
Ancestries Reported - French Canadian (%)
Ancestries Reported - German (%)
Ancestries Reported - Greek (%)
Ancestries Reported - Hungarian (%)
Ancestries Reported - Irish (%)
Ancestries Reported - Italian (%)
Ancestries Reported - Lithuanian (%)
Ancestries Reported - Norwegian (%)
Ancestries Reported - Polish (%)
Ancestries Reported - Portuguese (%)
Ancestries Reported - Russian (%)
Ancestries Reported - Scotch-Irish (%)
Ancestries Reported - Scottish (%)
Ancestries Reported - Slovak (%)
Ancestries Reported - Subsaharan African (%)
Ancestries Reported - Swedish (%)
Ancestries Reported - Swiss (%)
Ancestries Reported - Ukrainian (%)
Ancestries Reported - United States (%)
Ancestries Reported - Welsh (%)
Ancestries Reported - West Indian (%)
Ancestries Reported - Other (%)
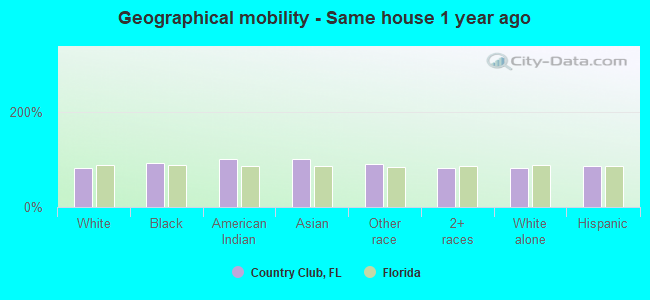
Geographical mobility - Same house 1 year ago (%)
Geographical mobility - Same house 1 year ago (%) - White
Geographical mobility - Same house 1 year ago (%) - Black or African American
Geographical mobility - Same house 1 year ago (%) - Asian
Geographical mobility - Same house 1 year ago (%) - Hispanic or Latino
Geographical mobility - Same house 1 year ago (%) - American Indian and Alaska Native
Geographical mobility - Same house 1 year ago (%) - Multirace
Geographical mobility - Same house 1 year ago (%) - Other Race
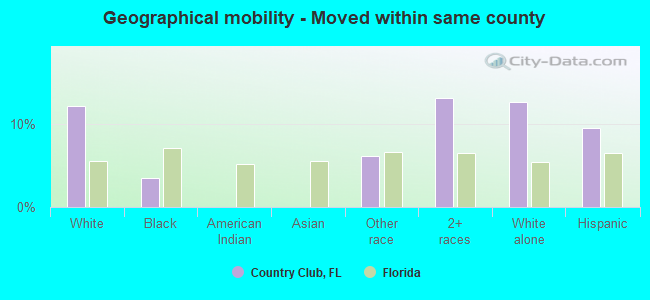
Geographical mobility - Moved within same county (%)
Geographical mobility - Moved within same county (%) - White
Geographical mobility - Moved within same county (%) - Black or African American
Geographical mobility - Moved within same county (%) - Asian
Geographical mobility - Moved within same county (%) - Hispanic or Latino
Geographical mobility - Moved within same county (%) - American Indian and Alaska Native
Geographical mobility - Moved within same county (%) - Multirace
Geographical mobility - Moved within same county (%) - Other Race
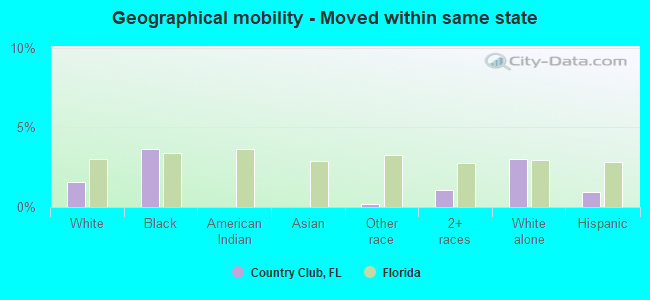
Geographical mobility - Moved from different county within same state (%)
Geographical mobility - Moved from different county within same state (%) - White
Geographical mobility - Moved from different county within same state (%) - Black or African American
Geographical mobility - Moved from different county within same state (%) - Asian
Geographical mobility - Moved from different county within same state (%) - Hispanic or Latino
Geographical mobility - Moved from different county within same state (%) - American Indian and Alaska Native
Geographical mobility - Moved from different county within same state (%) - Multirace
Geographical mobility - Moved from different county within same state (%) - Other Race
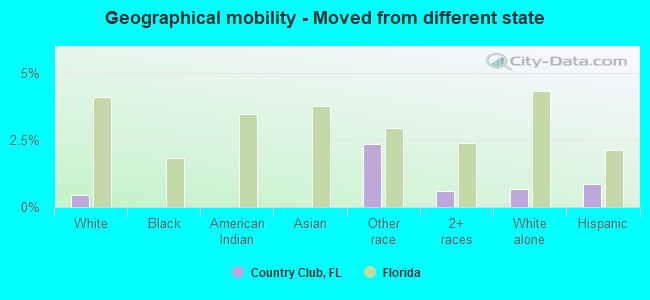
Geographical mobility - Moved from different state (%)
Geographical mobility - Moved from different state (%) - White
Geographical mobility - Moved from different state (%) - Black or African American
Geographical mobility - Moved from different state (%) - Asian
Geographical mobility - Moved from different state (%) - Hispanic or Latino
Geographical mobility - Moved from different state (%) - American Indian and Alaska Native
Geographical mobility - Moved from different state (%) - Multirace
Geographical mobility - Moved from different state (%) - Other Race
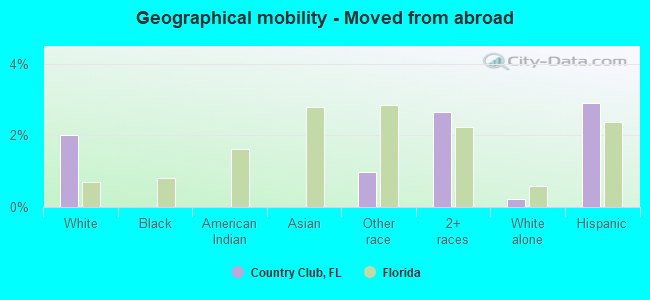
Geographical mobility - Moved from abroad (%)
Geographical mobility - Moved from abroad (%) - White
Geographical mobility - Moved from abroad (%) - Black or African American
Geographical mobility - Moved from abroad (%) - Asian
Geographical mobility - Moved from abroad (%) - Hispanic or Latino
Geographical mobility - Moved from abroad (%) - American Indian and Alaska Native
Geographical mobility - Moved from abroad (%) - Multirace
Geographical mobility - Moved from abroad (%) - Other Race
Place of birth for the foreign-born population - Ireland (%)
Place of birth for the foreign-born population - Denmark (%)
Place of birth for the foreign-born population - Norway (%)
Place of birth for the foreign-born population - Sweden (%)
Place of birth for the foreign-born population - United Kingdom (%)
Place of birth for the foreign-born population - England (%)
Place of birth for the foreign-born population - Scotland (%)
Place of birth for the foreign-born population - Other Northern Europe (%)
Place of birth for the foreign-born population - Austria (%)
Place of birth for the foreign-born population - Belgium (%)
Place of birth for the foreign-born population - France (%)
Place of birth for the foreign-born population - Germany (%)
Place of birth for the foreign-born population - Netherlands (%)
Place of birth for the foreign-born population - Switzerland (%)
Place of birth for the foreign-born population - Other Western Europe (%)
Place of birth for the foreign-born population - Greece (%)
Place of birth for the foreign-born population - Italy (%)
Place of birth for the foreign-born population - Portugal (%)
Place of birth for the foreign-born population - Spain (%)
Place of birth for the foreign-born population - Other Southern Europe (%)
Place of birth for the foreign-born population - Albania (%)
Place of birth for the foreign-born population - Belarus (%)
Place of birth for the foreign-born population - Bosnia and Herzegovina (%)
Place of birth for the foreign-born population - Bulgaria (%)
Place of birth for the foreign-born population - Croatia (%)
Place of birth for the foreign-born population - Czechoslovakia (%)
Place of birth for the foreign-born population - Hungary (%)
Place of birth for the foreign-born population - Latvia (%)
Place of birth for the foreign-born population - Lithuania (%)
Place of birth for the foreign-born population - North Macedonia (Macedonia) (%)
Place of birth for the foreign-born population - Moldova (%)
Place of birth for the foreign-born population - Poland (%)
Place of birth for the foreign-born population - Romania (%)
Place of birth for the foreign-born population - Russia (%)
Place of birth for the foreign-born population - Serbia (%)
Place of birth for the foreign-born population - Ukraine (%)
Place of birth for the foreign-born population - Other Eastern Europe (%)
Place of birth for the foreign-born population - China (%)
Place of birth for the foreign-born population - Hong Kong (%)
Place of birth for the foreign-born population - Taiwan (%)
Place of birth for the foreign-born population - Japan (%)
Place of birth for the foreign-born population - Korea (%)
Place of birth for the foreign-born population - Other Eastern Asia (%)
Place of birth for the foreign-born population - Afghanistan (%)
Place of birth for the foreign-born population - Bangladesh (%)
Place of birth for the foreign-born population - India (%)
Place of birth for the foreign-born population - Iran (%)
Place of birth for the foreign-born population - Kazakhstan (%)
Place of birth for the foreign-born population - Nepal (%)
Place of birth for the foreign-born population - Pakistan (%)
Place of birth for the foreign-born population - Sri Lanka (%)
Place of birth for the foreign-born population - Uzbekistan (%)
Place of birth for the foreign-born population - Other South Central Asia (%)
Place of birth for the foreign-born population - Burma (%)
Place of birth for the foreign-born population - Cambodia (%)
Place of birth for the foreign-born population - Indonesia (%)
Place of birth for the foreign-born population - Laos (%)
Place of birth for the foreign-born population - Malaysia (%)
Place of birth for the foreign-born population - Philippines (%)
Place of birth for the foreign-born population - Singapore (%)
Place of birth for the foreign-born population - Thailand (%)
Place of birth for the foreign-born population - Vietnam (%)
Place of birth for the foreign-born population - Other South Eastern Asia (%)
Place of birth for the foreign-born population - Armenia (%)
Place of birth for the foreign-born population - Iraq (%)
Place of birth for the foreign-born population - Israel (%)
Place of birth for the foreign-born population - Jordan (%)
Place of birth for the foreign-born population - Kuwait (%)
Place of birth for the foreign-born population - Lebanon (%)
Place of birth for the foreign-born population - Saudi Arabia (%)
Place of birth for the foreign-born population - Syria (%)
Place of birth for the foreign-born population - Turkey (%)
Place of birth for the foreign-born population - Yemen (%)
Place of birth for the foreign-born population - Other Western Asia (%)
Place of birth for the foreign-born population - Eritrea (%)
Place of birth for the foreign-born population - Ethiopia (%)
Place of birth for the foreign-born population - Kenya (%)
Place of birth for the foreign-born population - Somalia (%)
Place of birth for the foreign-born population - Uganda (%)
Place of birth for the foreign-born population - Zimbabwe (%)
Place of birth for the foreign-born population - Other Eastern Africa (%)
Place of birth for the foreign-born population - Cameroon (%)
Place of birth for the foreign-born population - Congo (%)
Place of birth for the foreign-born population - Democratic Republic of Congo (Zaire) (%)
Place of birth for the foreign-born population - Other Middle Africa (%)
Place of birth for the foreign-born population - Egypt (%)
Place of birth for the foreign-born population - Morocco (%)
Place of birth for the foreign-born population - Sudan (%)
Place of birth for the foreign-born population - Other Northern Africa (%)
Place of birth for the foreign-born population - South Africa (%)
Place of birth for the foreign-born population - Other Southern Africa (%)
Place of birth for the foreign-born population - Cabo Verde (%)
Place of birth for the foreign-born population - Ghana (%)
Place of birth for the foreign-born population - Liberia (%)
Place of birth for the foreign-born population - Nigeria (%)
Place of birth for the foreign-born population - Senegal (%)
Place of birth for the foreign-born population - Sierra Leone (%)
Place of birth for the foreign-born population - Other Western Africa (%)
Place of birth for the foreign-born population - Australia (%)
Place of birth for the foreign-born population - New Zealand (%)
Place of birth for the foreign-born population - Fiji (%)
Place of birth for the foreign-born population - Micronesia (%)
Place of birth for the foreign-born population - Bahamas (%)
Place of birth for the foreign-born population - Barbados (%)
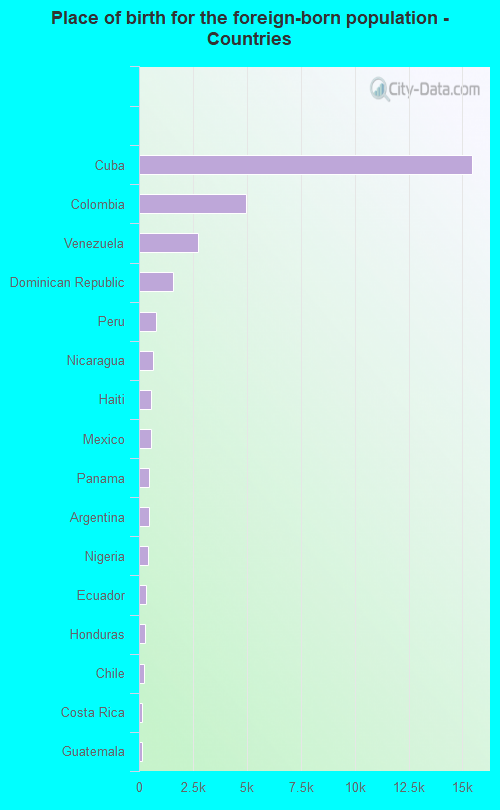
Place of birth for the foreign-born population - Cuba (%)
Place of birth for the foreign-born population - Dominica (%)
Place of birth for the foreign-born population - Dominican Republic (%)
Place of birth for the foreign-born population - Grenada (%)
Place of birth for the foreign-born population - Haiti (%)
Place of birth for the foreign-born population - Jamaica (%)
Place of birth for the foreign-born population - St. Vincent and the Grenadines (%)
Place of birth for the foreign-born population - Trinidad and Tobago (%)
Place of birth for the foreign-born population - West Indies (%)
Place of birth for the foreign-born population - Other Caribbean (%)
Place of birth for the foreign-born population - Belize (%)
Place of birth for the foreign-born population - Costa Rica (%)
Place of birth for the foreign-born population - El Salvador (%)
Place of birth for the foreign-born population - Guatemala (%)
Place of birth for the foreign-born population - Honduras (%)
Place of birth for the foreign-born population - Mexico (%)
Place of birth for the foreign-born population - Nicaragua (%)
Place of birth for the foreign-born population - Panama (%)
Place of birth for the foreign-born population - Other Central America (%)
Place of birth for the foreign-born population - Argentina (%)
Place of birth for the foreign-born population - Bolivia (%)
Place of birth for the foreign-born population - Brazil (%)
Place of birth for the foreign-born population - Chile (%)
Place of birth for the foreign-born population - Colombia (%)
Place of birth for the foreign-born population - Ecuador (%)
Place of birth for the foreign-born population - Guyana (%)
Place of birth for the foreign-born population - Peru (%)
Place of birth for the foreign-born population - Uruguay (%)
Place of birth for the foreign-born population - Venezuela (%)
Place of birth for the foreign-born population - Other South America (%)
Place of birth for the foreign-born population - Canada (%)
Place of birth for the foreign-born population - Other Northern America (%)
Place of birth for the foreign-born population - Other (%)
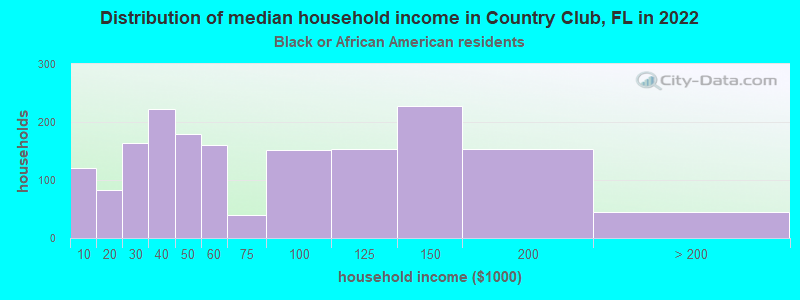
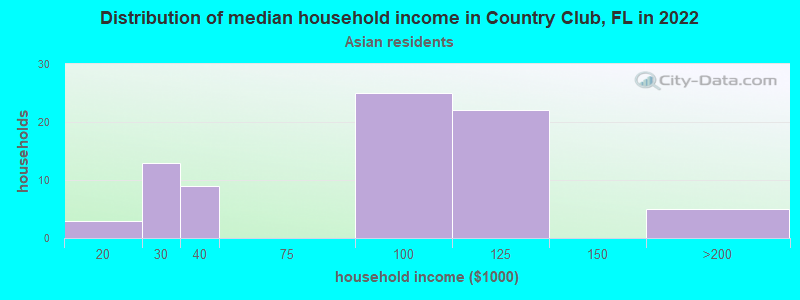
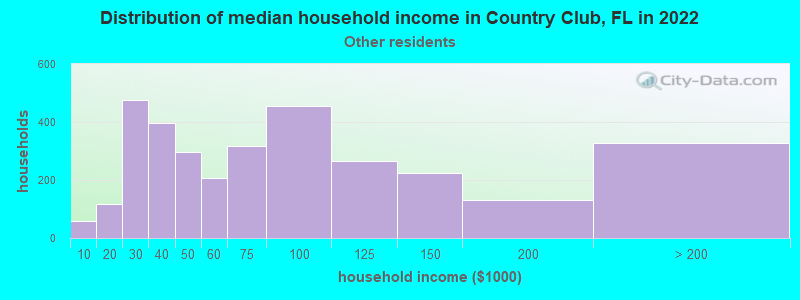
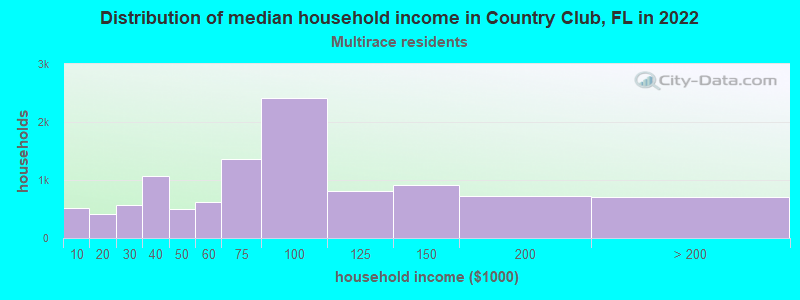
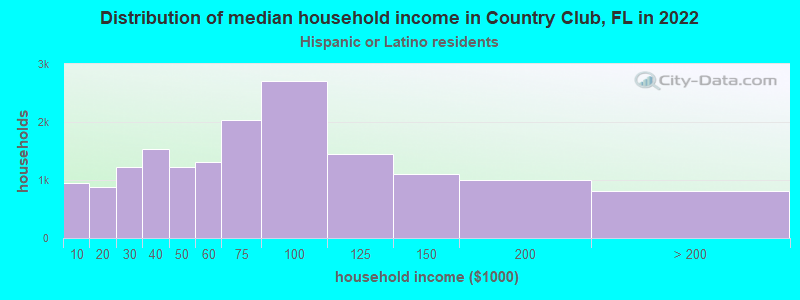
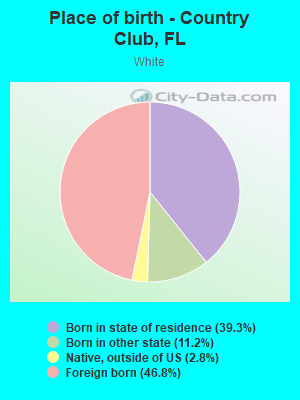
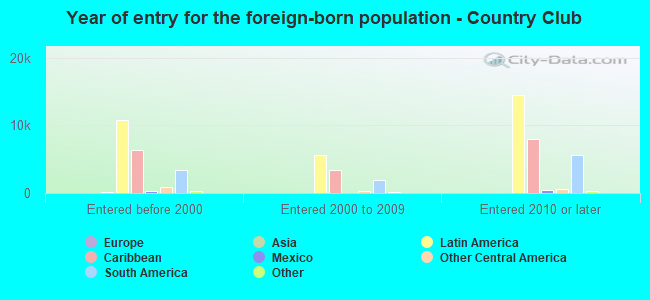
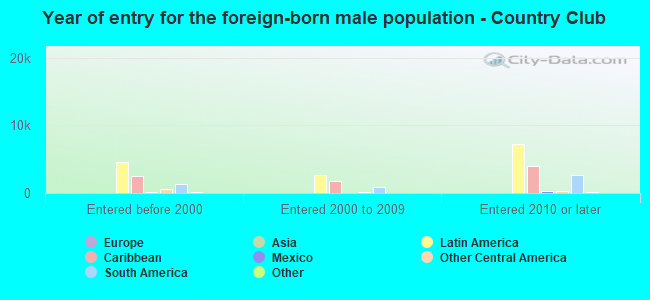
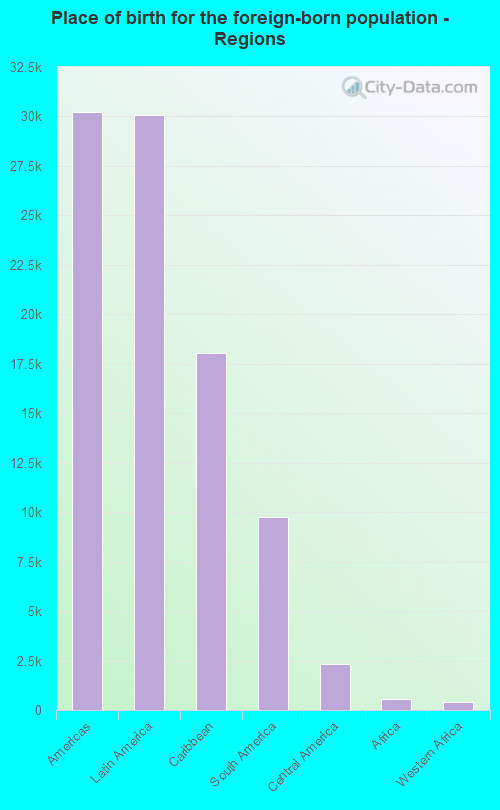
According to 2022 data, the most numerous races in Country Club, FL are White alone (2,577 residents), Hispanic (42,869 residents), and Black alone (3,930 residents). 13.7% of Country Club residents speak English at home. 61.4% of Country Club, FL residents are foreign-born (59.1% born in Latin America), which is 65.8% greater than the foreign-born rate of 21.0% across the entire state of Florida.
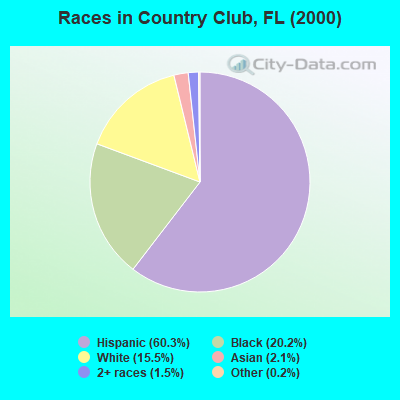
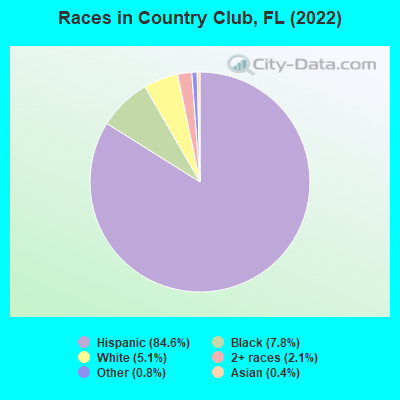
Race distribution in Country Club
2000 2022
10,458,509 65.4% White alone 2,682,715 16.8% Hispanic 2,264,268 14.2% Black alone 261,693 1.6% Asian alone 236,954 1.5% Two or more races 42,358 0.3% American Indian alone 28,994 0.2% Other race alone 6,887 0.04% Native Hawaiian and Other
11,309,403 50.8% White alone 6,025,039 27.1% Hispanic 3,241,015 14.6% Black alone 861,630 3.9% Two or more races 623,692 2.8% Asian alone 152,054 0.7% Other race alone 22,504 0.1% American Indian alone 9,486 0.04% Native Hawaiian and Other
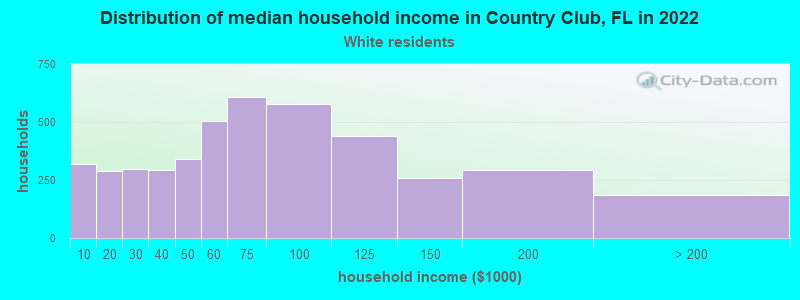
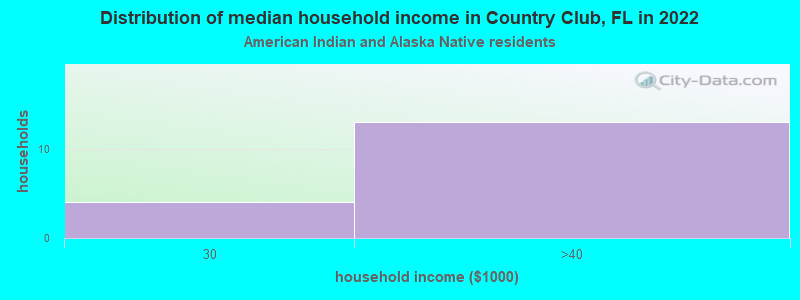
Income and house value in Country Club Median household income in 2022 $78,597 White non-Hispanic householders$54,487 Black householders$61,790 Some other race householders$76,893 Two or more races householders$69,243 Hispanic or Latino race householdersMedian 2022 house value $391,845 White Non-Hispanic householders$439,277 Black or African American householders$336,272 American Indian or Alaska Native householders $403,880 Asian householders$336,272 Native Hawaiian and other Pacific Islander householders$380,872 Some other race householders$401,756 Two or more races householders$385,474 Hispanic or Latino householders
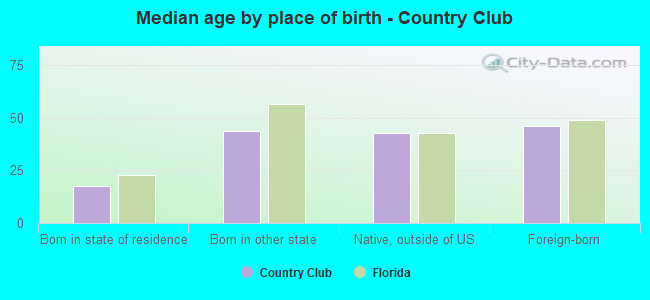
Median age by race in Country Club
33.8 Median age for White residents31.6 36.7 40.3 Median age for Black or African American residents40.2 40.9 37.5 Median age for American Indian / Alaska Native residents16.1 -762,696,213.5 52.1 Median age for Asian residents56.4 50.3 -679,849,340.2 Median age for Native Hawaiian / Pacific Islander residents-858,307,848.3 -443,298,968.6 39.9 Median age for Other race residents40.3 39.5 43.6 Median age for Two or more races residents36.6 46.2 19.8 Median age for White alone residents16.5 21.7 41.3 Median age for Hispanic or Latino residents38.2 43.6
Owner/renter occupied households by race in Country Club
House owners and renters - White residents 1,888 41.3% Owner occupied2,686 58.7% Renter occupiedHouse owners and renters - Black or African American residents 697 41.8% Owner occupied971 58.2% Renter occupiedHouse owners and renters - American Indian / Alaska Native residents 14 72.3% Owner occupied5 27.7% Renter occupiedHouse owners and renters - Asian residents 52 77.3% Owner occupied15 22.7% Renter occupiedHouse owners and renters - Other race residents 1,108 32.7% Owner occupied2,286 67.3% Renter occupiedHouse owners and renters - Two or more races residents 5,992 57.0% Owner occupied4,529 43.0% Renter occupiedHouse owners and renters - White alone residents 363 61.1% Owner occupied231 38.9% Renter occupiedHouse owners and renters - Hispanic or Latino residents 7,273 45.1% Owner occupied8,857 54.9% Renter occupied
Language usage in Country Club
English speakers - Total 13.7% of residents of Country Club speak English at home.
82.5% of residents speak Spanish at home 19,718 49.4% Speak English very well20,183 50.6% Speak English less than very well3.8% of residents speak other language at home 1,521 82.3% Speak English very well327 17.7% Speak English less than very well
English speakers - Born in the United States 45.9% of residents of Country Club speak English at home.
52.2% of residents speak Spanish at home 1,660 97.1% Speak English very well49 2.9% Speak English less than very well1.0% of residents speak other language at home 32 100.0% Speak English very well
English speakers - Native, born elsewhere 7.8% of residents of Country Club speak English at home.
89.7% of residents speak Spanish at home 692 41.7% Speak English very well966 58.3% Speak English less than very well0.9% of residents speak other language at home 16 100.0% Speak English very well
English speakers - Foreign-born 4.5% of residents of Country Club speak English at home.
90.3% of residents speak Spanish at home 9,215 33.0% Speak English very well18,711 67.0% Speak English less than very well5.3% of residents speak other language at home 1,354 82.3% Speak English very well291 17.7% Speak English less than very well
White (Caucasian) - Speak only English Native:
28.1% (1,520)Foreign-born:
8.7% (458)
White (Caucasian) - Speak another language Native:
62.5% (3,378)Foreign-born:
91.0% (4,815)
Black or African American - Speak only English Native:
91.0% (2,376)Foreign-born:
17.1% (277)
Black or African American - Speak another language Native:
9.0% (235)Foreign-born:
81.7% (1,322)
Asian - Speak another language Native:
97.1% (77)Foreign-born:
92.9% (160)
Other race - Speak only English Native:
23.8% (777)Foreign-born:
2.6% (153)
Other race - Speak another language Native:
76.2% (2,487)Foreign-born:
97.5% (5,815)
Two or more races - Speak only English Native:
10.2% (791)Foreign-born:
1.9% (382)
Two or more races - Speak another language Native:
90.1% (7,010)Foreign-born:
97.7% (19,494)
White alone - Speak only English Native:
46.4% (888)Foreign-born:
39.0% (85)
White alone - Speak another language Native:
51.7% (990)Foreign-born:
64.1% (140)
Hispanic or Latino - Speak only English Native:
13.1% (1,617)Foreign-born:
3.5% (998)
Hispanic or Latino - Speak another language Native:
86.7% (10,680)Foreign-born:
96.5% (27,791)
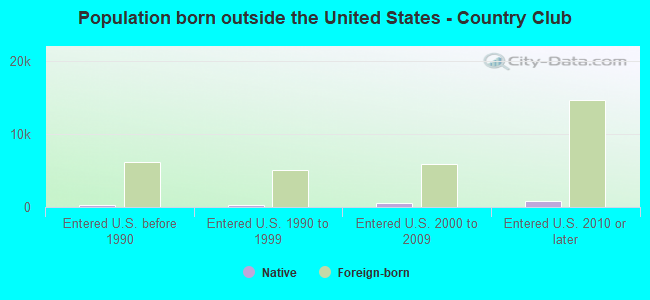
Foreign-born residents in Country Club 31,116 residents are foreign born (59.1% Latin America ).
This city:
61.4%Florida:
21.1%
Marital status for residents in Country Club Marital status - White (Caucasian) population 15 years and over
Males 40.9% Never married43.1% Now married2.3% Separated2.3% Widowed11.6% DivorcedFemales 32.5% Never married34.1% Now married3.7% Separated7.9% Widowed21.8% DivorcedWomen who gave birth in the past 12 months Now married:
48.8% (77)Unmarried:
51.2% (81)
Women who did not give birth in the past 12 months Now married:
35.3% (992)Unmarried:
64.7% (1,818)
Marital status - Black or African American population 15 years and over
Males 46.6% Never married42.7% Now married0.2% Separated0.8% Widowed9.6% DivorcedFemales 49.7% Never married19.3% Now married4.7% Separated16.8% Widowed9.4% DivorcedWomen who did not give birth in the past 12 months Now married:
19.3% (219)Unmarried:
80.7% (918)
Marital status - American Indian / Alaska Native population 15 years and over
Males 100.0% Never married0.0% Now married0.0% Separated0.0% Widowed0.0% DivorcedFemales 10.3% Never married0.0% Now married89.7% Separated0.0% Widowed0.0% DivorcedWomen who did not give birth in the past 12 months Now married:
89.7% (41)Unmarried:
10.3% (5)
Marital status - Asian population 15 years and over
Males 33.7% Never married66.3% Now married0.0% Separated0.0% Widowed0.0% DivorcedFemales 11.3% Never married88.7% Now married0.0% Separated0.0% Widowed0.0% DivorcedWomen who did not give birth in the past 12 months Now married:
70.7% (30)Unmarried:
29.3% (13)
Marital status - Other race population 15 years and over
Males 37.3% Never married46.4% Now married5.7% Separated0.8% Widowed9.9% DivorcedFemales 44.0% Never married30.3% Now married4.4% Separated8.8% Widowed12.5% DivorcedWomen who gave birth in the past 12 months Now married:
0.0% (0)Unmarried:
100.0% (17)
Women who did not give birth in the past 12 months Now married:
35.7% (947)Unmarried:
64.3% (1,705)
Marital status - Two or more races population 15 years and over
Males 39.5% Never married46.3% Now married0.5% Separated1.3% Widowed12.3% DivorcedFemales 23.8% Never married40.9% Now married3.0% Separated7.5% Widowed24.8% DivorcedWomen who gave birth in the past 12 months Now married:
53.1% (108)Unmarried:
46.9% (96)
Women who did not give birth in the past 12 months Now married:
47.3% (3,263)Unmarried:
52.7% (3,632)
Marital status - White alone, not Hispanic / Latino population 15 years and over
Males 54.7% Never married36.0% Now married0.0% Separated1.8% Widowed7.4% DivorcedFemales 51.0% Never married17.2% Now married8.4% Separated5.8% Widowed17.7% DivorcedWomen who gave birth in the past 12 months Now married:
63.2% (23)Unmarried:
36.8% (13)
Women who did not give birth in the past 12 months Now married:
22.9% (93)Unmarried:
77.1% (315)
Marital status - Hispanic or Latino population 15 years and over
Males 38.1% Never married46.2% Now married2.3% Separated1.7% Widowed11.7% DivorcedFemales 29.8% Never married37.0% Now married3.2% Separated8.0% Widowed22.0% DivorcedWomen who gave birth in the past 12 months Now married:
47.3% (180)Unmarried:
52.7% (200)
Women who did not give birth in the past 12 months Now married:
40.0% (4,232)Unmarried:
60.0% (6,340)
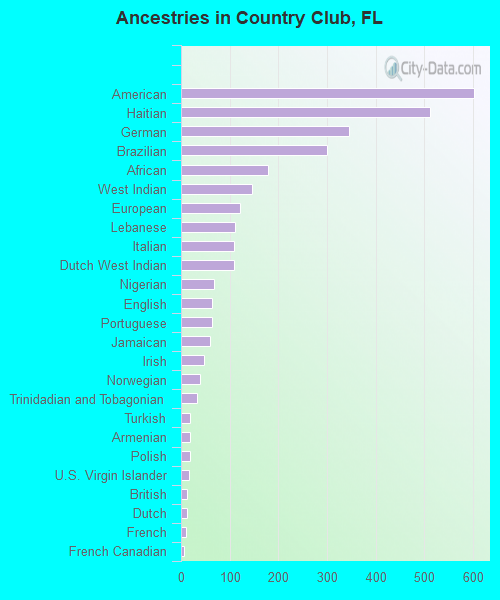
Ancestries in Country Club
603 1.7% American511 1.4% Haitian346 1.0% German300 0.8% Brazilian178 0.5% African145 0.4% West Indian122 0.3% European112 0.3% Lebanese109 0.3% Italian109 0.3% Dutch West Indian68 0.2% Nigerian64 0.2% English63 0.2% Portuguese59 0.2% Jamaican48 0.1% Irish40 0.1% Norwegian32 0.09% Trinidadian and Tobagonian19 0.05% Turkish18 0.05% Armenian18 0.05% Polish17 0.05% U.S. Virgin Islander12 0.03% British12 0.03% Dutch10 0.03% French6 0.02% French Canadian3 0.01% Slovene
Geographical mobility in Country Club Same house 1 year ago 9,853 82.4% White (Caucasian)4,013 92.1% Black or African American92 100.0% American Indian / Alaska Native261 100.0% Asian8,550 89.9% Other race23,099 80.7% Two or more races2,039 82.3% White alone, not Hispanic / Latino36,223 85.0% Hispanic or LatinoMoved within same county 1,464 12.2% White / Caucasian153 3.5% Black or African American582 6.1% Other race3,785 13.2% Two or more races314 12.7% White alone, not Hispanic / Latino4,062 9.5% Hispanic or LatinoMoved within same state 188 1.6% White / Caucasian159 3.7% Black or African American19 0.2% Other race304 1.1% Two or more races75 3.0% White alone, not Hispanic / Latino401 0.9% Hispanic or LatinoMoved from different state 54 0.4% White / Caucasian222 2.3% Other race172 0.6% Two or more races17 0.7% White alone, not Hispanic / Latino360 0.8% Hispanic or LatinoMoved from abroad 241 2.0% White94 1.0% Other race763 2.7% Two or more races5 0.2% White alone, not Hispanic / Latino1,241 2.9% Hispanic or Latino
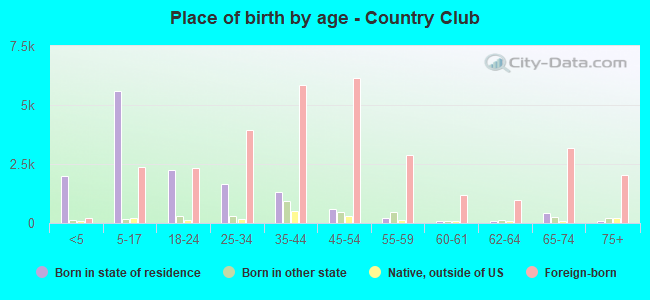
Children Nativity (place of birth) in Country Club
Children under 6 years - Living with two parents Both parents native 172 100.0% NativeBoth parents foreign-born 602 76.4% Native186 23.6% Foreign-bornOne native, one foreign-born parent 206 100.0% NativeChildren under 6 years - Living with one parent Native parent 219 100.0% NativeForeign-born parent 1,148 100.0% NativeChildren 6 to 17 years - Living with two parents Both parents native 426 94.3% Native25 5.7% Foreign-bornBoth parents foreign-born 1,051 40.1% Native1,567 59.9% Foreign-bornOne native, one foreign-born parent 531 94.3% Native32 5.7% Foreign-bornChildren 6 to 17 years - Living with one parent Native parent 816 100.0% NativeForeign-born parent 2,516 56.2% Native1,959 43.8% Foreign-born
Grandparents responsible for own grandchildren in Country Club
Grandparents (30 to 59 years) White / Caucasian 4 8.3% Responsible for grandchildren47 91.7% Not responsible for grandchildrenBlack or African American 13 100.0% Responsible for grandchildrenOther race 104 58.0% Responsible for grandchildren75 42.0% Not responsible for grandchildrenTwo or more races 10 4.3% Responsible for grandchildren218 95.7% Not responsible for grandchildrenHispanic or Latino 97 28.7% Responsible for grandchildren241 71.3% Not responsible for grandchildrenGrandparents (60 years and over) White / Caucasian 139 100.0% Not responsible for grandchildrenBlack or African American 60 100.0% Not responsible for grandchildrenOther race 27 12.6% Responsible for grandchildren184 87.4% Not responsible for grandchildrenTwo or more races 100 9.3% Responsible for grandchildren981 90.7% Not responsible for grandchildrenHispanic or Latino 107 10.8% Responsible for grandchildren884 89.2% Not responsible for grandchildren