Races in Countryside, Virginia (VA) Detailed Stats
Data:
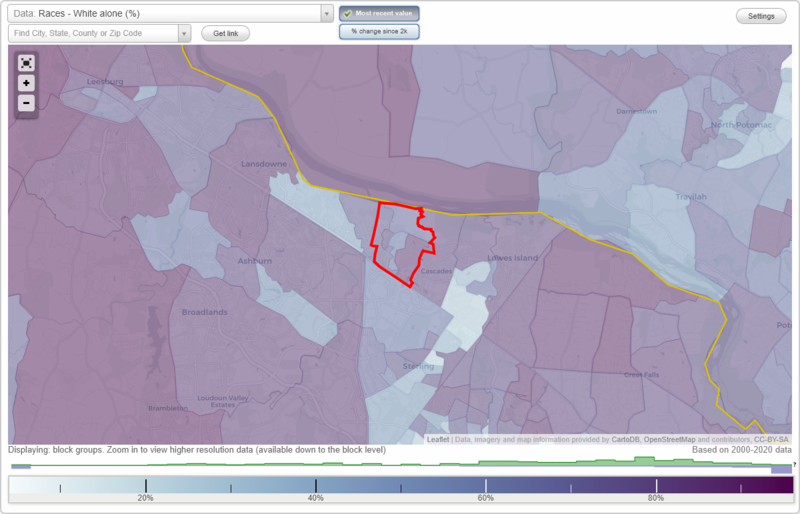
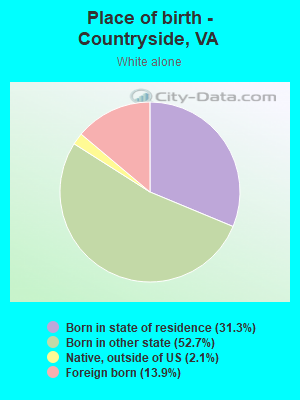
Races - White alone (%)
Races - White alone (% change since 2000)
Races - Black alone (%)
Races - Black alone (% change since 2000)
Races - American Indian alone (%)
Races - American Indian alone (% change since 2000)
Races - Asian alone (%)
Races - Asian alone (% change since 2000)
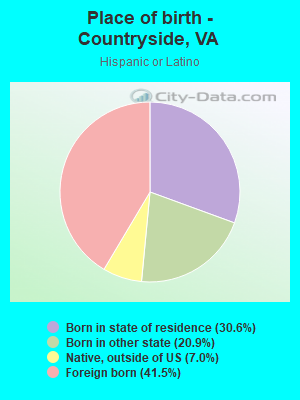
Races - Hispanic (%)
Races - Hispanic (% change since 2000)
Races - Native Hawaiian and Other Pacific Islander alone (%)
Races - Native Hawaiian and Other Pacific Islander alone (% change since 2000)
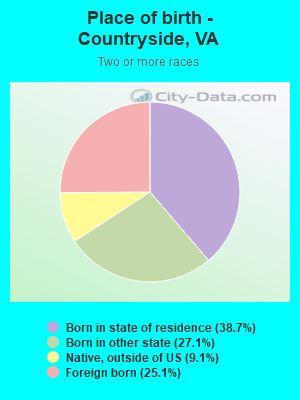
Races - Two or more races(%)
Races - Two or more races(% change since 2000)
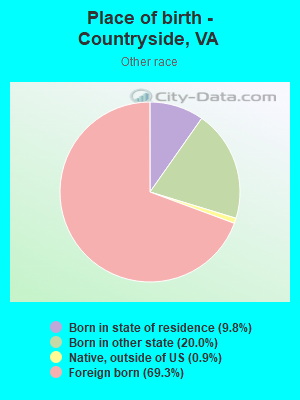
Races - Other race alone (%)
Races - Other race alone (% change since 2000)
Racial diversity
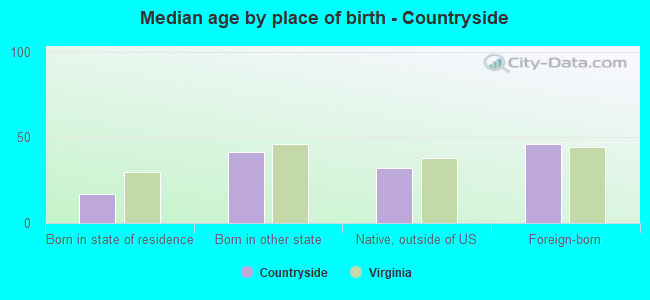
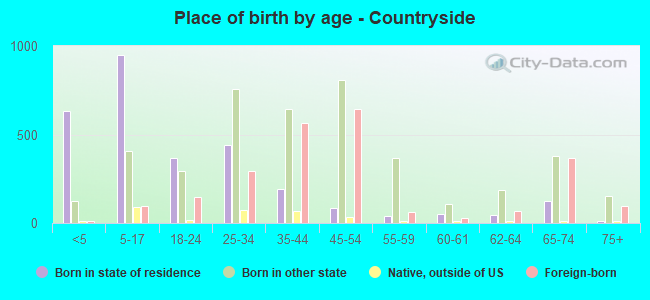
Place of birth - Born in state of residence (%)
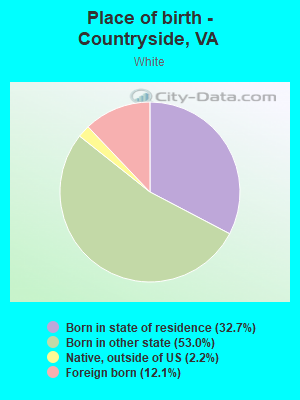
Place of birth - Born in state of residence (%) - White
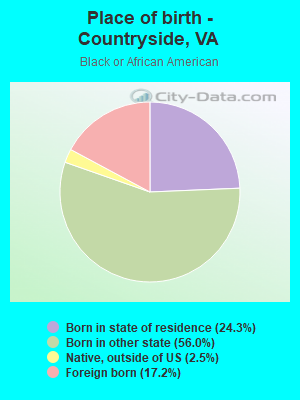
Place of birth - Born in state of residence (%) - Black or African American
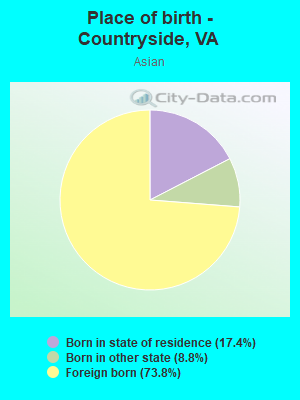
Place of birth - Born in state of residence (%) - Asian
Place of birth - Born in state of residence (%) - Hispanic or Latino
Place of birth - Born in state of residence (%) - American Indian and Alaska Native
Place of birth - Born in state of residence (%) - Multirace
Place of birth - Born in state of residence (%) - Other Race
Place of birth - Born in other state (%)
Place of birth - Born in other state (%) - White
Place of birth - Born in other state (%) - Black or African American
Place of birth - Born in other state (%) - Asian
Place of birth - Born in other state (%) - Hispanic or Latino
Place of birth - Born in other state (%) - American Indian and Alaska Native
Place of birth - Born in other state (%) - Multirace
Place of birth - Born in other state (%) - Other Race
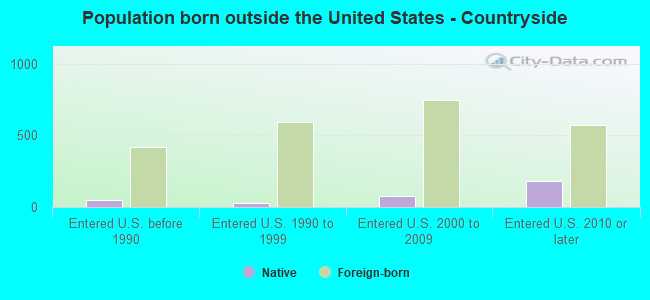
Place of birth - Native, outside of US (%)
Place of birth - Native, outside of US (%) - White
Place of birth - Native, outside of US (%) - Black or African American
Place of birth - Native, outside of US (%) - Asian
Place of birth - Native, outside of US (%) - Hispanic or Latino
Place of birth - Native, outside of US (%) - American Indian and Alaska Native
Place of birth - Native, outside of US (%) - Multirace
Place of birth - Native, outside of US (%) - Other Race
Place of birth - Foreign born (%)
Place of birth - Foreign born (%) - White
Place of birth - Foreign born (%) - Black or African American
Place of birth - Foreign born (%) - Asian
Place of birth - Foreign born (%) - Hispanic or Latino
Place of birth - Foreign born (%) - American Indian and Alaska Native
Place of birth - Foreign born (%) - Multirace
Place of birth - Foreign born (%) - Other Race
Residents speaking English at home (%)
Residents speaking English at home - Born in the United States (%)
Residents speaking English at home - Native, born elsewhere (%)
Residents speaking English at home - Foreign born (%)
Residents speaking Spanish at home (%)
Residents speaking Spanish at home - Born in the United States (%)
Residents speaking Spanish at home - Native, born elsewhere (%)
Residents speaking Spanish at home - Foreign born (%)
Residents speaking other language at home (%)
Residents speaking other language at home - Born in the United States (%)
Residents speaking other language at home - Native, born elsewhere (%)
Residents speaking other language at home - Foreign born (%)
Marital status - Never married (%)
Marital status - Now married (%)
Marital status - Separated (%)
Marital status - Widowed (%)
Marital status - Divorced (%)
Ancestries Reported - Arab (%)
Ancestries Reported - Czech (%)
Ancestries Reported - Danish (%)
Ancestries Reported - Dutch (%)
Ancestries Reported - English (%)
Ancestries Reported - French (%)
Ancestries Reported - French Canadian (%)
Ancestries Reported - German (%)
Ancestries Reported - Greek (%)
Ancestries Reported - Hungarian (%)
Ancestries Reported - Irish (%)
Ancestries Reported - Italian (%)
Ancestries Reported - Lithuanian (%)
Ancestries Reported - Norwegian (%)
Ancestries Reported - Polish (%)
Ancestries Reported - Portuguese (%)
Ancestries Reported - Russian (%)
Ancestries Reported - Scotch-Irish (%)
Ancestries Reported - Scottish (%)
Ancestries Reported - Slovak (%)
Ancestries Reported - Subsaharan African (%)
Ancestries Reported - Swedish (%)
Ancestries Reported - Swiss (%)
Ancestries Reported - Ukrainian (%)
Ancestries Reported - United States (%)
Ancestries Reported - Welsh (%)
Ancestries Reported - West Indian (%)
Ancestries Reported - Other (%)
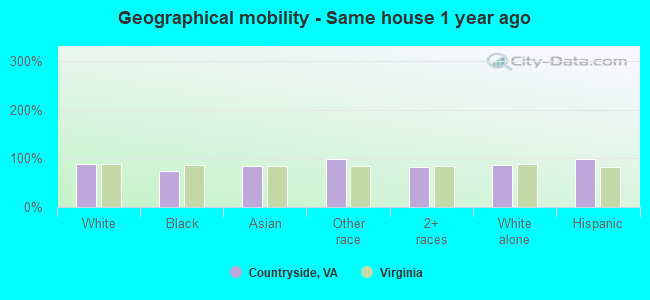
Geographical mobility - Same house 1 year ago (%)
Geographical mobility - Same house 1 year ago (%) - White
Geographical mobility - Same house 1 year ago (%) - Black or African American
Geographical mobility - Same house 1 year ago (%) - Asian
Geographical mobility - Same house 1 year ago (%) - Hispanic or Latino
Geographical mobility - Same house 1 year ago (%) - American Indian and Alaska Native
Geographical mobility - Same house 1 year ago (%) - Multirace
Geographical mobility - Same house 1 year ago (%) - Other Race
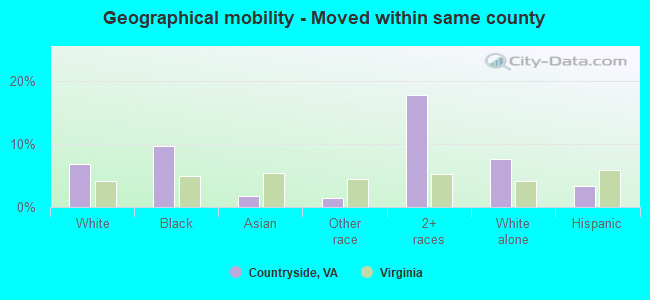
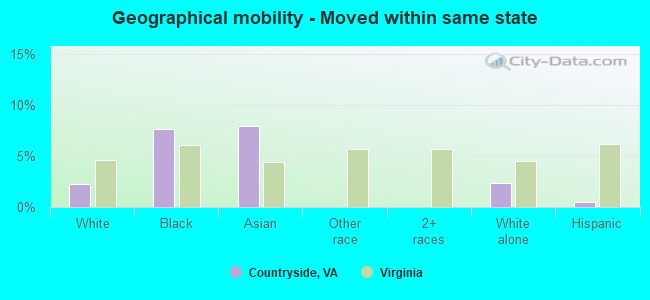
Geographical mobility - Moved within same county (%)
Geographical mobility - Moved within same county (%) - White
Geographical mobility - Moved within same county (%) - Black or African American
Geographical mobility - Moved within same county (%) - Asian
Geographical mobility - Moved within same county (%) - Hispanic or Latino
Geographical mobility - Moved within same county (%) - American Indian and Alaska Native
Geographical mobility - Moved within same county (%) - Multirace
Geographical mobility - Moved within same county (%) - Other Race
Geographical mobility - Moved from different county within same state (%)
Geographical mobility - Moved from different county within same state (%) - White
Geographical mobility - Moved from different county within same state (%) - Black or African American
Geographical mobility - Moved from different county within same state (%) - Asian
Geographical mobility - Moved from different county within same state (%) - Hispanic or Latino
Geographical mobility - Moved from different county within same state (%) - American Indian and Alaska Native
Geographical mobility - Moved from different county within same state (%) - Multirace
Geographical mobility - Moved from different county within same state (%) - Other Race
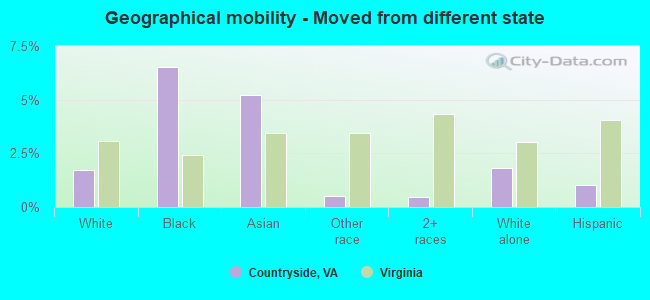
Geographical mobility - Moved from different state (%)
Geographical mobility - Moved from different state (%) - White
Geographical mobility - Moved from different state (%) - Black or African American
Geographical mobility - Moved from different state (%) - Asian
Geographical mobility - Moved from different state (%) - Hispanic or Latino
Geographical mobility - Moved from different state (%) - American Indian and Alaska Native
Geographical mobility - Moved from different state (%) - Multirace
Geographical mobility - Moved from different state (%) - Other Race
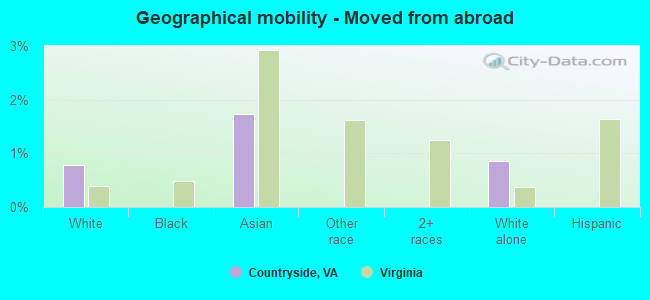
Geographical mobility - Moved from abroad (%)
Geographical mobility - Moved from abroad (%) - White
Geographical mobility - Moved from abroad (%) - Black or African American
Geographical mobility - Moved from abroad (%) - Asian
Geographical mobility - Moved from abroad (%) - Hispanic or Latino
Geographical mobility - Moved from abroad (%) - American Indian and Alaska Native
Geographical mobility - Moved from abroad (%) - Multirace
Geographical mobility - Moved from abroad (%) - Other Race
Place of birth for the foreign-born population - Ireland (%)
Place of birth for the foreign-born population - Denmark (%)
Place of birth for the foreign-born population - Norway (%)
Place of birth for the foreign-born population - Sweden (%)
Place of birth for the foreign-born population - United Kingdom (%)
Place of birth for the foreign-born population - England (%)
Place of birth for the foreign-born population - Scotland (%)
Place of birth for the foreign-born population - Other Northern Europe (%)
Place of birth for the foreign-born population - Austria (%)
Place of birth for the foreign-born population - Belgium (%)
Place of birth for the foreign-born population - France (%)
Place of birth for the foreign-born population - Germany (%)
Place of birth for the foreign-born population - Netherlands (%)
Place of birth for the foreign-born population - Switzerland (%)
Place of birth for the foreign-born population - Other Western Europe (%)
Place of birth for the foreign-born population - Greece (%)
Place of birth for the foreign-born population - Italy (%)
Place of birth for the foreign-born population - Portugal (%)
Place of birth for the foreign-born population - Spain (%)
Place of birth for the foreign-born population - Other Southern Europe (%)
Place of birth for the foreign-born population - Albania (%)
Place of birth for the foreign-born population - Belarus (%)
Place of birth for the foreign-born population - Bosnia and Herzegovina (%)
Place of birth for the foreign-born population - Bulgaria (%)
Place of birth for the foreign-born population - Croatia (%)
Place of birth for the foreign-born population - Czechoslovakia (%)
Place of birth for the foreign-born population - Hungary (%)
Place of birth for the foreign-born population - Latvia (%)
Place of birth for the foreign-born population - Lithuania (%)
Place of birth for the foreign-born population - North Macedonia (Macedonia) (%)
Place of birth for the foreign-born population - Moldova (%)
Place of birth for the foreign-born population - Poland (%)
Place of birth for the foreign-born population - Romania (%)
Place of birth for the foreign-born population - Russia (%)
Place of birth for the foreign-born population - Serbia (%)
Place of birth for the foreign-born population - Ukraine (%)
Place of birth for the foreign-born population - Other Eastern Europe (%)
Place of birth for the foreign-born population - China (%)
Place of birth for the foreign-born population - Hong Kong (%)
Place of birth for the foreign-born population - Taiwan (%)
Place of birth for the foreign-born population - Japan (%)
Place of birth for the foreign-born population - Korea (%)
Place of birth for the foreign-born population - Other Eastern Asia (%)
Place of birth for the foreign-born population - Afghanistan (%)
Place of birth for the foreign-born population - Bangladesh (%)
Place of birth for the foreign-born population - India (%)
Place of birth for the foreign-born population - Iran (%)
Place of birth for the foreign-born population - Kazakhstan (%)
Place of birth for the foreign-born population - Nepal (%)
Place of birth for the foreign-born population - Pakistan (%)
Place of birth for the foreign-born population - Sri Lanka (%)
Place of birth for the foreign-born population - Uzbekistan (%)
Place of birth for the foreign-born population - Other South Central Asia (%)
Place of birth for the foreign-born population - Burma (%)
Place of birth for the foreign-born population - Cambodia (%)
Place of birth for the foreign-born population - Indonesia (%)
Place of birth for the foreign-born population - Laos (%)
Place of birth for the foreign-born population - Malaysia (%)
Place of birth for the foreign-born population - Philippines (%)
Place of birth for the foreign-born population - Singapore (%)
Place of birth for the foreign-born population - Thailand (%)
Place of birth for the foreign-born population - Vietnam (%)
Place of birth for the foreign-born population - Other South Eastern Asia (%)
Place of birth for the foreign-born population - Armenia (%)
Place of birth for the foreign-born population - Iraq (%)
Place of birth for the foreign-born population - Israel (%)
Place of birth for the foreign-born population - Jordan (%)
Place of birth for the foreign-born population - Kuwait (%)
Place of birth for the foreign-born population - Lebanon (%)
Place of birth for the foreign-born population - Saudi Arabia (%)
Place of birth for the foreign-born population - Syria (%)
Place of birth for the foreign-born population - Turkey (%)
Place of birth for the foreign-born population - Yemen (%)
Place of birth for the foreign-born population - Other Western Asia (%)
Place of birth for the foreign-born population - Eritrea (%)
Place of birth for the foreign-born population - Ethiopia (%)
Place of birth for the foreign-born population - Kenya (%)
Place of birth for the foreign-born population - Somalia (%)
Place of birth for the foreign-born population - Uganda (%)
Place of birth for the foreign-born population - Zimbabwe (%)
Place of birth for the foreign-born population - Other Eastern Africa (%)
Place of birth for the foreign-born population - Cameroon (%)
Place of birth for the foreign-born population - Congo (%)
Place of birth for the foreign-born population - Democratic Republic of Congo (Zaire) (%)
Place of birth for the foreign-born population - Other Middle Africa (%)
Place of birth for the foreign-born population - Egypt (%)
Place of birth for the foreign-born population - Morocco (%)
Place of birth for the foreign-born population - Sudan (%)
Place of birth for the foreign-born population - Other Northern Africa (%)
Place of birth for the foreign-born population - South Africa (%)
Place of birth for the foreign-born population - Other Southern Africa (%)
Place of birth for the foreign-born population - Cabo Verde (%)
Place of birth for the foreign-born population - Ghana (%)
Place of birth for the foreign-born population - Liberia (%)
Place of birth for the foreign-born population - Nigeria (%)
Place of birth for the foreign-born population - Senegal (%)
Place of birth for the foreign-born population - Sierra Leone (%)
Place of birth for the foreign-born population - Other Western Africa (%)
Place of birth for the foreign-born population - Australia (%)
Place of birth for the foreign-born population - New Zealand (%)
Place of birth for the foreign-born population - Fiji (%)
Place of birth for the foreign-born population - Micronesia (%)
Place of birth for the foreign-born population - Bahamas (%)
Place of birth for the foreign-born population - Barbados (%)
Place of birth for the foreign-born population - Cuba (%)
Place of birth for the foreign-born population - Dominica (%)
Place of birth for the foreign-born population - Dominican Republic (%)
Place of birth for the foreign-born population - Grenada (%)
Place of birth for the foreign-born population - Haiti (%)
Place of birth for the foreign-born population - Jamaica (%)
Place of birth for the foreign-born population - St. Vincent and the Grenadines (%)
Place of birth for the foreign-born population - Trinidad and Tobago (%)
Place of birth for the foreign-born population - West Indies (%)
Place of birth for the foreign-born population - Other Caribbean (%)
Place of birth for the foreign-born population - Belize (%)
Place of birth for the foreign-born population - Costa Rica (%)
Place of birth for the foreign-born population - El Salvador (%)
Place of birth for the foreign-born population - Guatemala (%)
Place of birth for the foreign-born population - Honduras (%)
Place of birth for the foreign-born population - Mexico (%)
Place of birth for the foreign-born population - Nicaragua (%)
Place of birth for the foreign-born population - Panama (%)
Place of birth for the foreign-born population - Other Central America (%)
Place of birth for the foreign-born population - Argentina (%)
Place of birth for the foreign-born population - Bolivia (%)
Place of birth for the foreign-born population - Brazil (%)
Place of birth for the foreign-born population - Chile (%)
Place of birth for the foreign-born population - Colombia (%)
Place of birth for the foreign-born population - Ecuador (%)
Place of birth for the foreign-born population - Guyana (%)
Place of birth for the foreign-born population - Peru (%)
Place of birth for the foreign-born population - Uruguay (%)
Place of birth for the foreign-born population - Venezuela (%)
Place of birth for the foreign-born population - Other South America (%)
Place of birth for the foreign-born population - Canada (%)
Place of birth for the foreign-born population - Other Northern America (%)
Place of birth for the foreign-born population - Other (%)
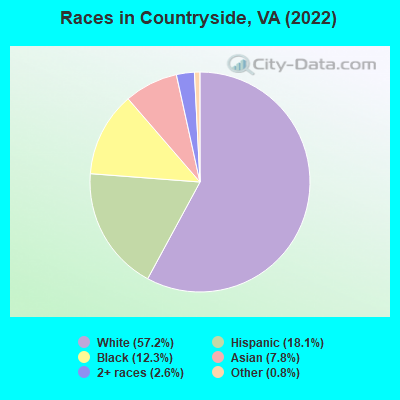
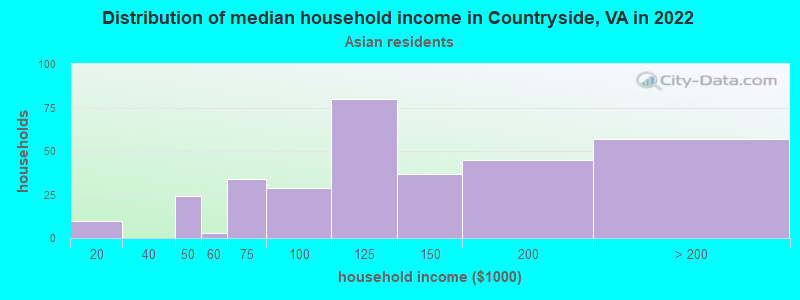
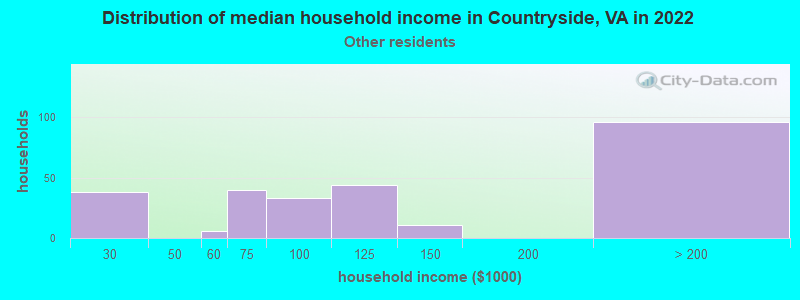
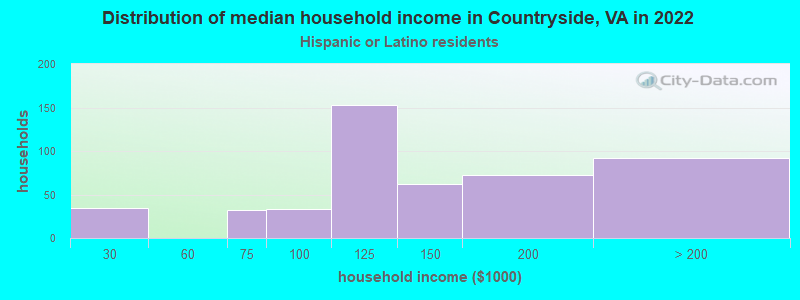
According to 2022 data, the most numerous races in Countryside, VA are White alone (5,661 residents), Black alone (1,216 residents), and Hispanic (1,795 residents). 67.8% of Countryside residents speak English at home.
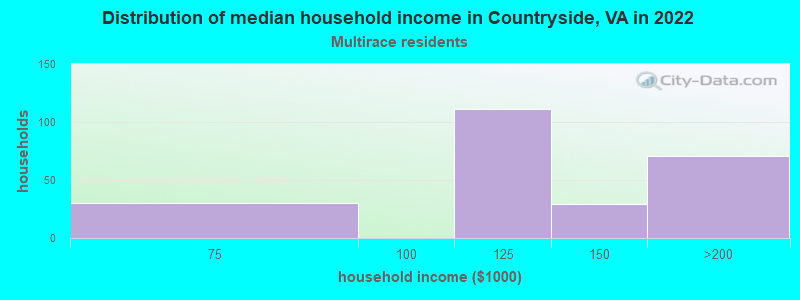
Race distribution in Countryside 5,661 57.2% White alone 1,795 18.1% Hispanic 1,216 12.3% Black alone 776 7.8% Asian alone 254 2.6% Two or more races 78 0.8% Other race alone
2000 2022
4,965,637 70.2% White alone 1,376,378 19.4% Black alone 329,540 4.7% Hispanic 259,277 3.7% Asian alone 114,022 1.6% Two or more races 18,596 0.3% American Indian alone 11,685 0.2% Other race alone 3,380 0.05% Native Hawaiian and Other
5,095,130 58.7% White alone 1,594,785 18.4% Black alone 905,750 10.4% Hispanic 602,881 6.9% Asian alone 406,047 4.7% Two or more races 60,419 0.7% Other race alone 11,738 0.1% American Indian alone 6,869 0.08% Native Hawaiian and Other
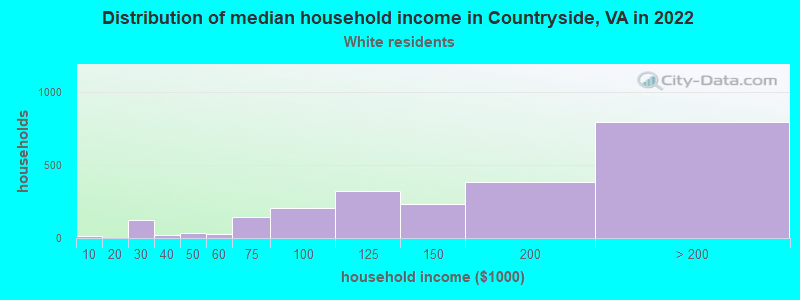
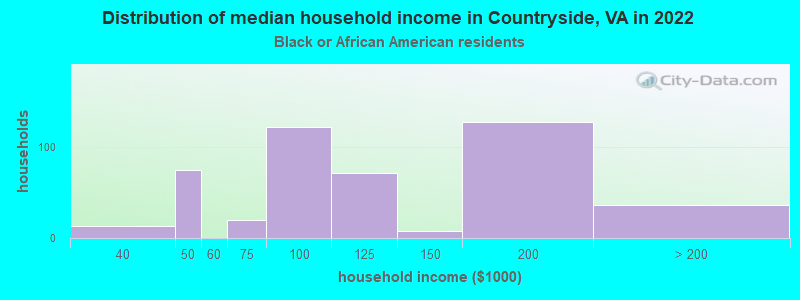
Income and house value in Countryside Median household income in 2022 $157,043 White non-Hispanic householders$129,874 Black householders$100,243 Asian householders$103,152 Some other race householders$118,999 Two or more races householders$139,374 Hispanic or Latino race householders
Median age by race in Countryside
37.9 Median age for White residents37.5 38.1 33.5 Median age for Black or African American residents30.8 30.3 -792,063,491.3 Median age for American Indian / Alaska Native residents-862,921,347.5 -673,154,906.1 44.4 Median age for Asian residents44.2 45.2 -1,157,453,935.2 Median age for Native Hawaiian / Pacific Islander residents-541,531,822.5 -714,150,046.8 32.7 Median age for Other race residents37.7 28.5 22.3 Median age for Two or more races residents11.6 30.1 37.9 Median age for White alone residents39.1 37.7 29.0 Median age for Hispanic or Latino residents23.7 32.1
Owner/renter occupied households by race in Countryside
House owners and renters - White residents 1,735 75.4% Owner occupied566 24.6% Renter occupiedHouse owners and renters - Black or African American residents 290 65.9% Owner occupied150 34.1% Renter occupiedHouse owners and renters - Asian residents 241 77.6% Owner occupied70 22.4% Renter occupiedHouse owners and renters - Other race residents 151 63.0% Owner occupied89 37.0% Renter occupiedHouse owners and renters - Two or more races residents 171 73.8% Owner occupied61 26.2% Renter occupiedHouse owners and renters - White alone residents 1,714 76.1% Owner occupied539 23.9% Renter occupiedHouse owners and renters - Hispanic or Latino residents 313 66.4% Owner occupied159 33.6% Renter occupied
Language usage in Countryside
English speakers - Total 67.8% of residents of Countryside speak English at home.
12.7% of residents speak Spanish at home 706 61.1% Speak English very well449 38.9% Speak English less than very well18.6% of residents speak other language at home 993 58.7% Speak English very well699 41.3% Speak English less than very well
English speakers - Born in the United States 92.2% of residents of Countryside speak English at home.
5.0% of residents speak Spanish at home 145 70.7% Speak English very well60 29.3% Speak English less than very well2.1% of residents speak other language at home 73 84.9% Speak English very well13 15.1% Speak English less than very well
English speakers - Native, born elsewhere 43.4% of residents of Countryside speak English at home.
43.1% of residents speak Spanish at home 122 97.6% Speak English very well3 2.4% Speak English less than very well12.4% of residents speak other language at home 36 100.0% Speak English less than very well
English speakers - Foreign-born 12.5% of residents of Countryside speak English at home.
29.9% of residents speak Spanish at home 335 47.0% Speak English very well378 53.0% Speak English less than very well57.1% of residents speak other language at home 729 53.6% Speak English very well631 46.4% Speak English less than very well
White (Caucasian) - Speak only English Native:
94.6% (4,427)Foreign-born:
18.7% (130)
White (Caucasian) - Speak another language Native:
5.4% (254)Foreign-born:
81.4% (564)
Black or African American - Speak only English Native:
90.9% (787)Foreign-born:
6.4% (14)
Black or African American - Speak another language Native:
9.9% (86)Foreign-born:
100.0% (213)
Asian - Speak only English Native:
16.7% (33)Foreign-born:
13.2% (73)
Asian - Speak another language Native:
90.9% (182)Foreign-born:
86.8% (482)
Other race - Speak only English Native:
81.0% (214)Foreign-born:
4.2% (26)
Other race - Speak another language Native:
18.0% (48)Foreign-born:
97.0% (602)
Two or more races - Speak only English Native:
67.2% (433)Foreign-born:
18.3% (53)
Two or more races - Speak another language Native:
32.5% (210)Foreign-born:
82.6% (237)
White alone - Speak only English Native:
94.8% (4,282)Foreign-born:
15.7% (124)
White alone - Speak another language Native:
5.0% (228)Foreign-born:
87.0% (684)
Hispanic or Latino - Speak only English Native:
73.1% (625)Foreign-born:
10.4% (77)
Hispanic or Latino - Speak another language Native:
28.1% (241)Foreign-born:
89.8% (667)
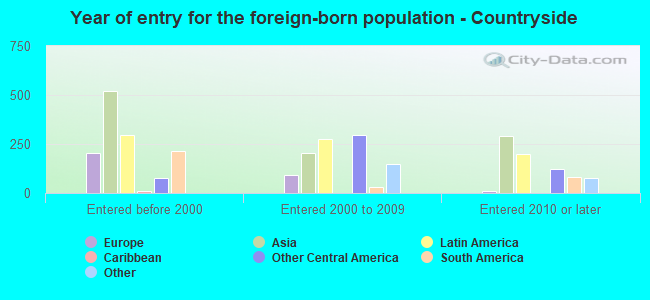
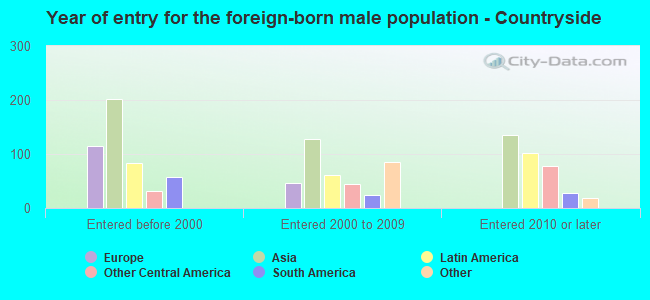
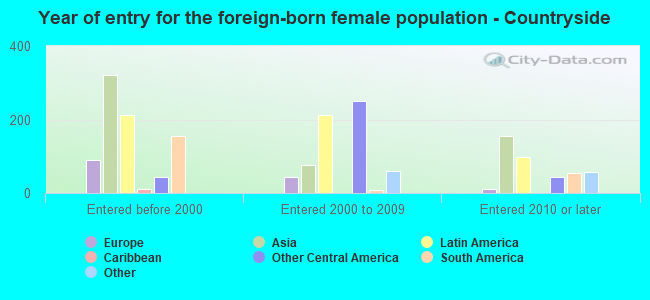
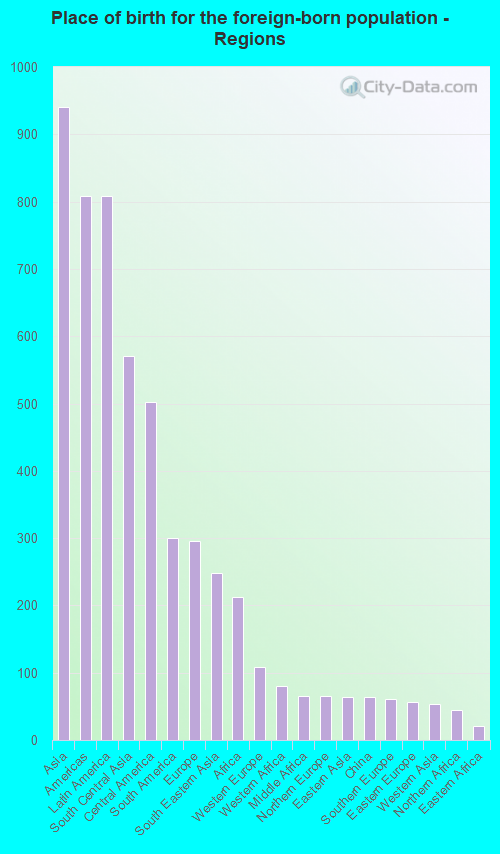
Foreign-born residents in Countryside
Marital status for residents in Countryside Marital status - White (Caucasian) population 15 years and over
Males 31.8% Never married63.9% Now married1.4% Separated0.4% Widowed2.5% DivorcedFemales 21.9% Never married58.0% Now married0.5% Separated7.0% Widowed12.7% DivorcedWomen who gave birth in the past 12 months Now married:
100.0% (169)Unmarried:
0.0% (0)
Women who did not give birth in the past 12 months Now married:
48.3% (585)Unmarried:
51.7% (627)
Marital status - Black or African American population 15 years and over
Males 46.2% Never married42.1% Now married0.0% Separated0.0% Widowed11.8% DivorcedFemales 32.4% Never married44.6% Now married0.0% Separated10.1% Widowed12.9% DivorcedWomen who did not give birth in the past 12 months Now married:
50.2% (139)Unmarried:
49.8% (138)
Marital status - Asian population 15 years and over
Males 36.4% Never married50.2% Now married0.0% Separated0.0% Widowed13.5% DivorcedFemales 22.0% Never married57.7% Now married0.0% Separated7.7% Widowed12.7% DivorcedWomen who did not give birth in the past 12 months Now married:
53.9% (99)Unmarried:
46.1% (85)
Marital status - Other race population 15 years and over
Males 30.3% Never married19.7% Now married5.8% Separated11.1% Widowed33.2% DivorcedFemales 49.3% Never married15.7% Now married0.0% Separated8.1% Widowed26.8% DivorcedWomen who did not give birth in the past 12 months Now married:
19.7% (74)Unmarried:
80.3% (301)
Marital status - Two or more races population 15 years and over
Males 38.4% Never married20.0% Now married32.1% Separated0.0% Widowed9.5% DivorcedFemales 43.0% Never married37.4% Now married0.0% Separated5.4% Widowed14.2% DivorcedWomen who gave birth in the past 12 months Now married:
100.0% (13)Unmarried:
0.0% (0)
Women who did not give birth in the past 12 months Now married:
31.6% (121)Unmarried:
68.4% (263)
Marital status - White alone, not Hispanic / Latino population 15 years and over
Males 30.4% Never married65.4% Now married1.5% Separated0.5% Widowed2.2% DivorcedFemales 21.5% Never married57.6% Now married0.5% Separated7.3% Widowed13.1% DivorcedWomen who gave birth in the past 12 months Now married:
100.0% (179)Unmarried:
0.0% (0)
Women who did not give birth in the past 12 months Now married:
46.9% (560)Unmarried:
53.1% (634)
Marital status - Hispanic or Latino population 15 years and over
Males 38.7% Never married28.5% Now married12.8% Separated4.0% Widowed15.9% DivorcedFemales 47.3% Never married26.5% Now married0.0% Separated4.1% Widowed22.1% DivorcedWomen who did not give birth in the past 12 months Now married:
25.7% (163)Unmarried:
74.3% (470)
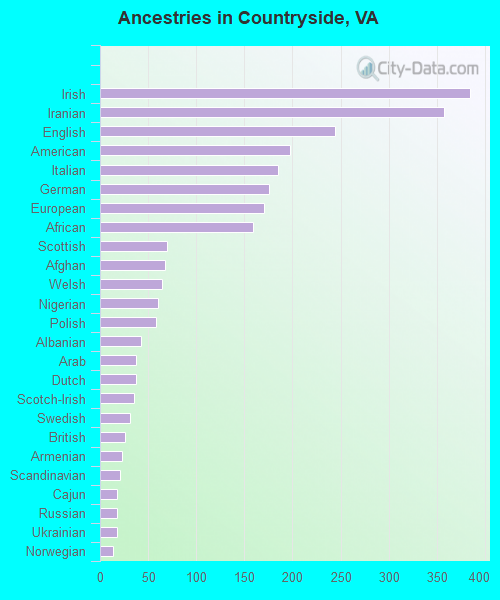
Ancestries in Countryside
385 8.3% Irish357 7.7% Iranian244 5.2% English197 4.2% American185 4.0% Italian176 3.8% German170 3.6% European159 3.4% African70 1.5% Scottish68 1.5% Afghan64 1.4% Welsh60 1.3% Nigerian58 1.2% Polish43 0.9% Albanian37 0.8% Arab37 0.8% Dutch35 0.8% Scotch-Irish31 0.7% Swedish26 0.6% British23 0.5% Armenian21 0.5% Scandinavian18 0.4% Cajun18 0.4% Russian18 0.4% Ukrainian14 0.3% Norwegian13 0.3% Austrian13 0.3% Jamaican10 0.2% Portuguese3 0.06% Danish3 0.06% Liberian2 0.04% French
Children Nativity (place of birth) in Countryside
Children under 6 years - Living with two parents Both parents native 482 100.0% NativeBoth parents foreign-born 66 100.0% NativeOne native, one foreign-born parent 133 100.0% NativeChildren under 6 years - Living with one parent Native parent 120 100.0% NativeForeign-born parent 46 100.0% NativeChildren 6 to 17 years - Living with two parents Both parents native 577 96.1% Native23 3.9% Foreign-bornBoth parents foreign-born 99 80.1% Native25 19.9% Foreign-bornOne native, one foreign-born parent 236 100.0% NativeChildren 6 to 17 years - Living with one parent Native parent 393 100.0% NativeForeign-born parent 88 55.0% Native72 45.0% Foreign-born
Grandparents responsible for own grandchildren in Countryside
Grandparents (30 to 59 years) White / Caucasian 8 100.0% Responsible for grandchildrenTwo or more races 20 100.0% Responsible for grandchildrenHispanic or Latino 38 100.0% Responsible for grandchildrenGrandparents (60 years and over) White / Caucasian 50 69.1% Responsible for grandchildren22 30.9% Not responsible for grandchildrenTwo or more races 9 100.0% Responsible for grandchildrenHispanic or Latino 9 100.0% Responsible for grandchildren