Races in Crystal, Minnesota (MN) Detailed Stats
Data:
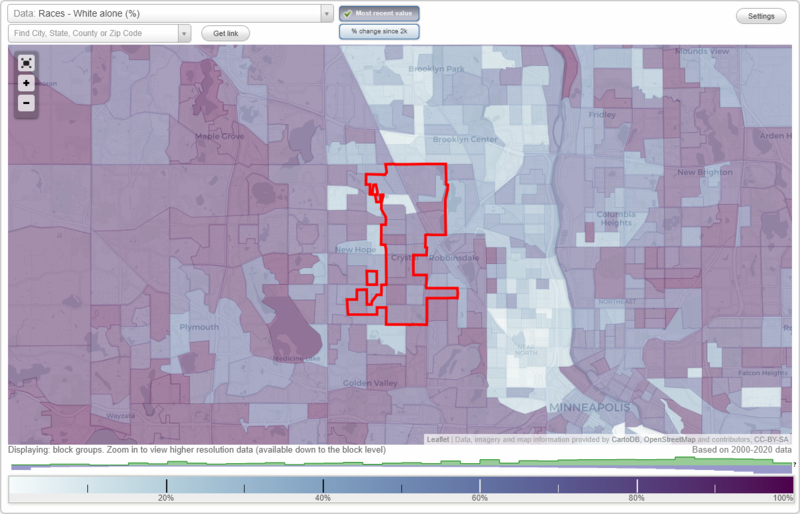
Races - White alone (%)
Races - White alone (% change since 2000)
Races - Black alone (%)
Races - Black alone (% change since 2000)
Races - American Indian alone (%)
Races - American Indian alone (% change since 2000)
Races - Asian alone (%)
Races - Asian alone (% change since 2000)
Races - Hispanic (%)
Races - Hispanic (% change since 2000)
Races - Native Hawaiian and Other Pacific Islander alone (%)
Races - Native Hawaiian and Other Pacific Islander alone (% change since 2000)
Races - Two or more races(%)
Races - Two or more races(% change since 2000)
Races - Other race alone (%)
Races - Other race alone (% change since 2000)
Racial diversity
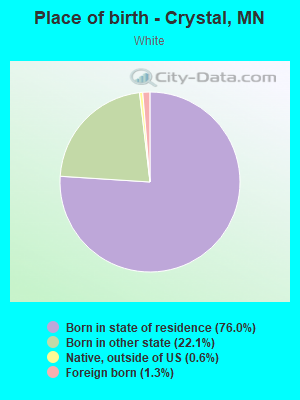
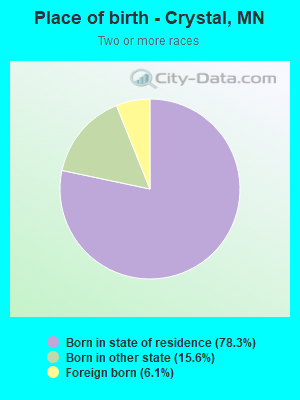
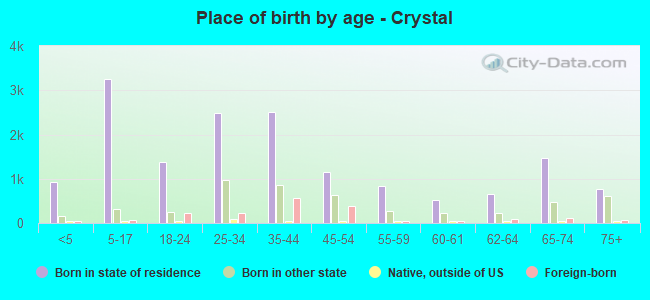
Place of birth - Born in state of residence (%)
Place of birth - Born in state of residence (%) - White
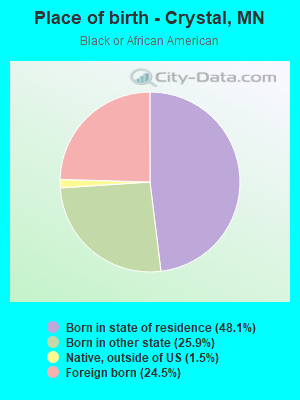
Place of birth - Born in state of residence (%) - Black or African American
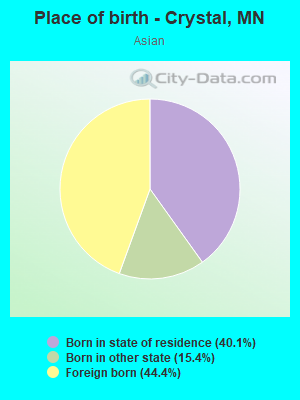
Place of birth - Born in state of residence (%) - Asian
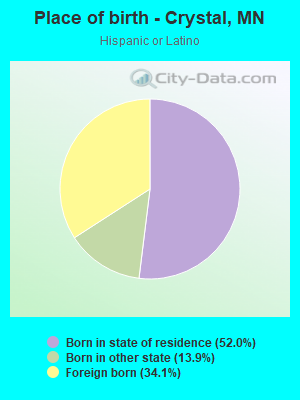
Place of birth - Born in state of residence (%) - Hispanic or Latino
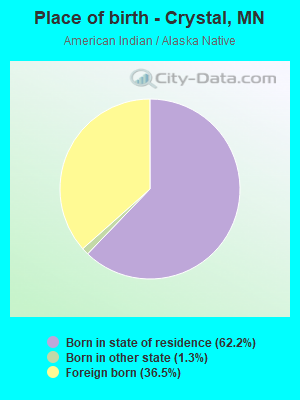
Place of birth - Born in state of residence (%) - American Indian and Alaska Native
Place of birth - Born in state of residence (%) - Multirace
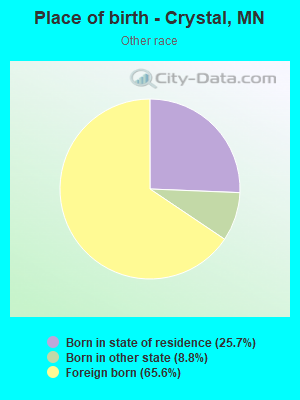
Place of birth - Born in state of residence (%) - Other Race
Place of birth - Born in other state (%)
Place of birth - Born in other state (%) - White
Place of birth - Born in other state (%) - Black or African American
Place of birth - Born in other state (%) - Asian
Place of birth - Born in other state (%) - Hispanic or Latino
Place of birth - Born in other state (%) - American Indian and Alaska Native
Place of birth - Born in other state (%) - Multirace
Place of birth - Born in other state (%) - Other Race
Place of birth - Native, outside of US (%)
Place of birth - Native, outside of US (%) - White
Place of birth - Native, outside of US (%) - Black or African American
Place of birth - Native, outside of US (%) - Asian
Place of birth - Native, outside of US (%) - Hispanic or Latino
Place of birth - Native, outside of US (%) - American Indian and Alaska Native
Place of birth - Native, outside of US (%) - Multirace
Place of birth - Native, outside of US (%) - Other Race
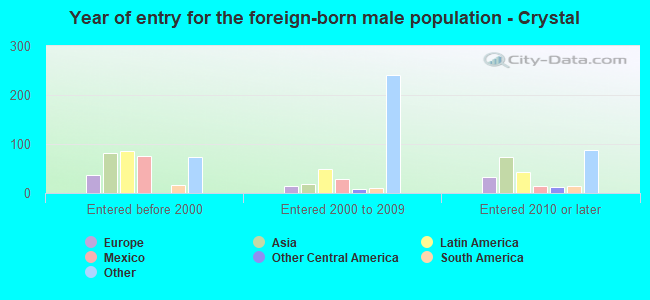
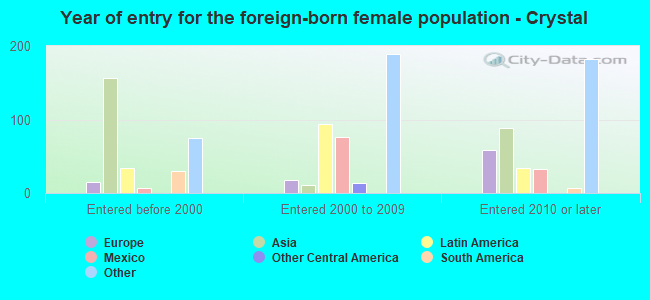
Place of birth - Foreign born (%)
Place of birth - Foreign born (%) - White
Place of birth - Foreign born (%) - Black or African American
Place of birth - Foreign born (%) - Asian
Place of birth - Foreign born (%) - Hispanic or Latino
Place of birth - Foreign born (%) - American Indian and Alaska Native
Place of birth - Foreign born (%) - Multirace
Place of birth - Foreign born (%) - Other Race
Residents speaking English at home (%)
Residents speaking English at home - Born in the United States (%)
Residents speaking English at home - Native, born elsewhere (%)
Residents speaking English at home - Foreign born (%)
Residents speaking Spanish at home (%)
Residents speaking Spanish at home - Born in the United States (%)
Residents speaking Spanish at home - Native, born elsewhere (%)
Residents speaking Spanish at home - Foreign born (%)
Residents speaking other language at home (%)
Residents speaking other language at home - Born in the United States (%)
Residents speaking other language at home - Native, born elsewhere (%)
Residents speaking other language at home - Foreign born (%)
Marital status - Never married (%)
Marital status - Now married (%)
Marital status - Separated (%)
Marital status - Widowed (%)
Marital status - Divorced (%)
Ancestries Reported - Arab (%)
Ancestries Reported - Czech (%)
Ancestries Reported - Danish (%)
Ancestries Reported - Dutch (%)
Ancestries Reported - English (%)
Ancestries Reported - French (%)
Ancestries Reported - French Canadian (%)
Ancestries Reported - German (%)
Ancestries Reported - Greek (%)
Ancestries Reported - Hungarian (%)
Ancestries Reported - Irish (%)
Ancestries Reported - Italian (%)
Ancestries Reported - Lithuanian (%)
Ancestries Reported - Norwegian (%)
Ancestries Reported - Polish (%)
Ancestries Reported - Portuguese (%)
Ancestries Reported - Russian (%)
Ancestries Reported - Scotch-Irish (%)
Ancestries Reported - Scottish (%)
Ancestries Reported - Slovak (%)
Ancestries Reported - Subsaharan African (%)
Ancestries Reported - Swedish (%)
Ancestries Reported - Swiss (%)
Ancestries Reported - Ukrainian (%)
Ancestries Reported - United States (%)
Ancestries Reported - Welsh (%)
Ancestries Reported - West Indian (%)
Ancestries Reported - Other (%)
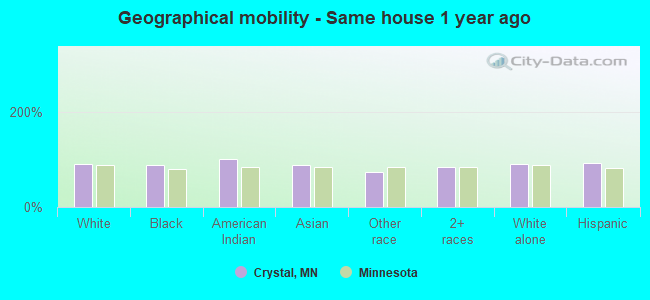
Geographical mobility - Same house 1 year ago (%)
Geographical mobility - Same house 1 year ago (%) - White
Geographical mobility - Same house 1 year ago (%) - Black or African American
Geographical mobility - Same house 1 year ago (%) - Asian
Geographical mobility - Same house 1 year ago (%) - Hispanic or Latino
Geographical mobility - Same house 1 year ago (%) - American Indian and Alaska Native
Geographical mobility - Same house 1 year ago (%) - Multirace
Geographical mobility - Same house 1 year ago (%) - Other Race
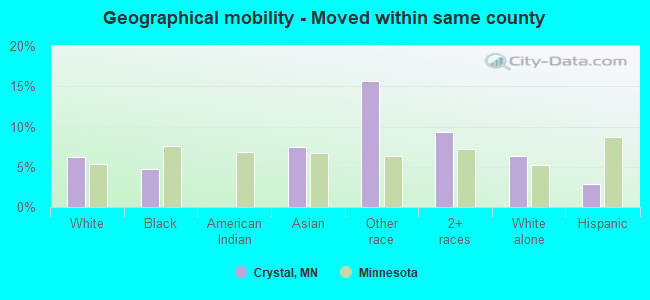
Geographical mobility - Moved within same county (%)
Geographical mobility - Moved within same county (%) - White
Geographical mobility - Moved within same county (%) - Black or African American
Geographical mobility - Moved within same county (%) - Asian
Geographical mobility - Moved within same county (%) - Hispanic or Latino
Geographical mobility - Moved within same county (%) - American Indian and Alaska Native
Geographical mobility - Moved within same county (%) - Multirace
Geographical mobility - Moved within same county (%) - Other Race
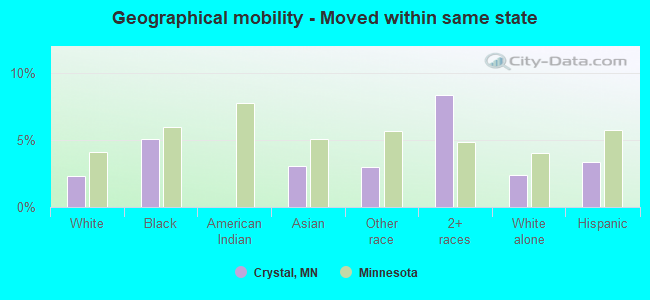
Geographical mobility - Moved from different county within same state (%)
Geographical mobility - Moved from different county within same state (%) - White
Geographical mobility - Moved from different county within same state (%) - Black or African American
Geographical mobility - Moved from different county within same state (%) - Asian
Geographical mobility - Moved from different county within same state (%) - Hispanic or Latino
Geographical mobility - Moved from different county within same state (%) - American Indian and Alaska Native
Geographical mobility - Moved from different county within same state (%) - Multirace
Geographical mobility - Moved from different county within same state (%) - Other Race
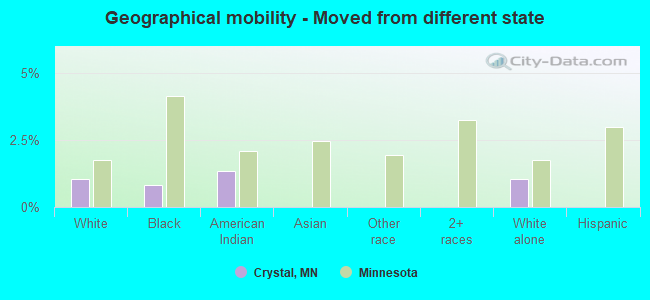
Geographical mobility - Moved from different state (%)
Geographical mobility - Moved from different state (%) - White
Geographical mobility - Moved from different state (%) - Black or African American
Geographical mobility - Moved from different state (%) - Asian
Geographical mobility - Moved from different state (%) - Hispanic or Latino
Geographical mobility - Moved from different state (%) - American Indian and Alaska Native
Geographical mobility - Moved from different state (%) - Multirace
Geographical mobility - Moved from different state (%) - Other Race
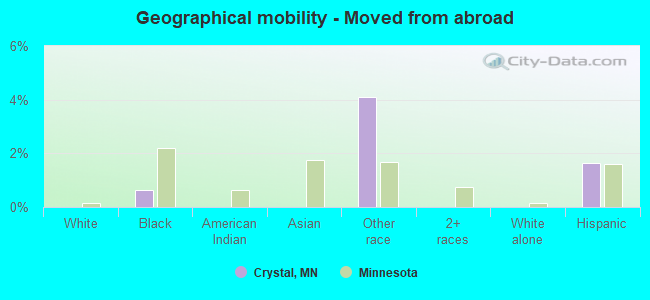
Geographical mobility - Moved from abroad (%)
Geographical mobility - Moved from abroad (%) - White
Geographical mobility - Moved from abroad (%) - Black or African American
Geographical mobility - Moved from abroad (%) - Asian
Geographical mobility - Moved from abroad (%) - Hispanic or Latino
Geographical mobility - Moved from abroad (%) - American Indian and Alaska Native
Geographical mobility - Moved from abroad (%) - Multirace
Geographical mobility - Moved from abroad (%) - Other Race
Place of birth for the foreign-born population - Ireland (%)
Place of birth for the foreign-born population - Denmark (%)
Place of birth for the foreign-born population - Norway (%)
Place of birth for the foreign-born population - Sweden (%)
Place of birth for the foreign-born population - United Kingdom (%)
Place of birth for the foreign-born population - England (%)
Place of birth for the foreign-born population - Scotland (%)
Place of birth for the foreign-born population - Other Northern Europe (%)
Place of birth for the foreign-born population - Austria (%)
Place of birth for the foreign-born population - Belgium (%)
Place of birth for the foreign-born population - France (%)
Place of birth for the foreign-born population - Germany (%)
Place of birth for the foreign-born population - Netherlands (%)
Place of birth for the foreign-born population - Switzerland (%)
Place of birth for the foreign-born population - Other Western Europe (%)
Place of birth for the foreign-born population - Greece (%)
Place of birth for the foreign-born population - Italy (%)
Place of birth for the foreign-born population - Portugal (%)
Place of birth for the foreign-born population - Spain (%)
Place of birth for the foreign-born population - Other Southern Europe (%)
Place of birth for the foreign-born population - Albania (%)
Place of birth for the foreign-born population - Belarus (%)
Place of birth for the foreign-born population - Bosnia and Herzegovina (%)
Place of birth for the foreign-born population - Bulgaria (%)
Place of birth for the foreign-born population - Croatia (%)
Place of birth for the foreign-born population - Czechoslovakia (%)
Place of birth for the foreign-born population - Hungary (%)
Place of birth for the foreign-born population - Latvia (%)
Place of birth for the foreign-born population - Lithuania (%)
Place of birth for the foreign-born population - North Macedonia (Macedonia) (%)
Place of birth for the foreign-born population - Moldova (%)
Place of birth for the foreign-born population - Poland (%)
Place of birth for the foreign-born population - Romania (%)
Place of birth for the foreign-born population - Russia (%)
Place of birth for the foreign-born population - Serbia (%)
Place of birth for the foreign-born population - Ukraine (%)
Place of birth for the foreign-born population - Other Eastern Europe (%)
Place of birth for the foreign-born population - China (%)
Place of birth for the foreign-born population - Hong Kong (%)
Place of birth for the foreign-born population - Taiwan (%)
Place of birth for the foreign-born population - Japan (%)
Place of birth for the foreign-born population - Korea (%)
Place of birth for the foreign-born population - Other Eastern Asia (%)
Place of birth for the foreign-born population - Afghanistan (%)
Place of birth for the foreign-born population - Bangladesh (%)
Place of birth for the foreign-born population - India (%)
Place of birth for the foreign-born population - Iran (%)
Place of birth for the foreign-born population - Kazakhstan (%)
Place of birth for the foreign-born population - Nepal (%)
Place of birth for the foreign-born population - Pakistan (%)
Place of birth for the foreign-born population - Sri Lanka (%)
Place of birth for the foreign-born population - Uzbekistan (%)
Place of birth for the foreign-born population - Other South Central Asia (%)
Place of birth for the foreign-born population - Burma (%)
Place of birth for the foreign-born population - Cambodia (%)
Place of birth for the foreign-born population - Indonesia (%)
Place of birth for the foreign-born population - Laos (%)
Place of birth for the foreign-born population - Malaysia (%)
Place of birth for the foreign-born population - Philippines (%)
Place of birth for the foreign-born population - Singapore (%)
Place of birth for the foreign-born population - Thailand (%)
Place of birth for the foreign-born population - Vietnam (%)
Place of birth for the foreign-born population - Other South Eastern Asia (%)
Place of birth for the foreign-born population - Armenia (%)
Place of birth for the foreign-born population - Iraq (%)
Place of birth for the foreign-born population - Israel (%)
Place of birth for the foreign-born population - Jordan (%)
Place of birth for the foreign-born population - Kuwait (%)
Place of birth for the foreign-born population - Lebanon (%)
Place of birth for the foreign-born population - Saudi Arabia (%)
Place of birth for the foreign-born population - Syria (%)
Place of birth for the foreign-born population - Turkey (%)
Place of birth for the foreign-born population - Yemen (%)
Place of birth for the foreign-born population - Other Western Asia (%)
Place of birth for the foreign-born population - Eritrea (%)
Place of birth for the foreign-born population - Ethiopia (%)
Place of birth for the foreign-born population - Kenya (%)
Place of birth for the foreign-born population - Somalia (%)
Place of birth for the foreign-born population - Uganda (%)
Place of birth for the foreign-born population - Zimbabwe (%)
Place of birth for the foreign-born population - Other Eastern Africa (%)
Place of birth for the foreign-born population - Cameroon (%)
Place of birth for the foreign-born population - Congo (%)
Place of birth for the foreign-born population - Democratic Republic of Congo (Zaire) (%)
Place of birth for the foreign-born population - Other Middle Africa (%)
Place of birth for the foreign-born population - Egypt (%)
Place of birth for the foreign-born population - Morocco (%)
Place of birth for the foreign-born population - Sudan (%)
Place of birth for the foreign-born population - Other Northern Africa (%)
Place of birth for the foreign-born population - South Africa (%)
Place of birth for the foreign-born population - Other Southern Africa (%)
Place of birth for the foreign-born population - Cabo Verde (%)
Place of birth for the foreign-born population - Ghana (%)
Place of birth for the foreign-born population - Liberia (%)
Place of birth for the foreign-born population - Nigeria (%)
Place of birth for the foreign-born population - Senegal (%)
Place of birth for the foreign-born population - Sierra Leone (%)
Place of birth for the foreign-born population - Other Western Africa (%)
Place of birth for the foreign-born population - Australia (%)
Place of birth for the foreign-born population - New Zealand (%)
Place of birth for the foreign-born population - Fiji (%)
Place of birth for the foreign-born population - Micronesia (%)
Place of birth for the foreign-born population - Bahamas (%)
Place of birth for the foreign-born population - Barbados (%)
Place of birth for the foreign-born population - Cuba (%)
Place of birth for the foreign-born population - Dominica (%)
Place of birth for the foreign-born population - Dominican Republic (%)
Place of birth for the foreign-born population - Grenada (%)
Place of birth for the foreign-born population - Haiti (%)
Place of birth for the foreign-born population - Jamaica (%)
Place of birth for the foreign-born population - St. Vincent and the Grenadines (%)
Place of birth for the foreign-born population - Trinidad and Tobago (%)
Place of birth for the foreign-born population - West Indies (%)
Place of birth for the foreign-born population - Other Caribbean (%)
Place of birth for the foreign-born population - Belize (%)
Place of birth for the foreign-born population - Costa Rica (%)
Place of birth for the foreign-born population - El Salvador (%)
Place of birth for the foreign-born population - Guatemala (%)
Place of birth for the foreign-born population - Honduras (%)
Place of birth for the foreign-born population - Mexico (%)
Place of birth for the foreign-born population - Nicaragua (%)
Place of birth for the foreign-born population - Panama (%)
Place of birth for the foreign-born population - Other Central America (%)
Place of birth for the foreign-born population - Argentina (%)
Place of birth for the foreign-born population - Bolivia (%)
Place of birth for the foreign-born population - Brazil (%)
Place of birth for the foreign-born population - Chile (%)
Place of birth for the foreign-born population - Colombia (%)
Place of birth for the foreign-born population - Ecuador (%)
Place of birth for the foreign-born population - Guyana (%)
Place of birth for the foreign-born population - Peru (%)
Place of birth for the foreign-born population - Uruguay (%)
Place of birth for the foreign-born population - Venezuela (%)
Place of birth for the foreign-born population - Other South America (%)
Place of birth for the foreign-born population - Canada (%)
Place of birth for the foreign-born population - Other Northern America (%)
Place of birth for the foreign-born population - Other (%)
Latest news about races in Crystal, MN collected exclusively by city-data.com from local newspapers, TV, and radio stations
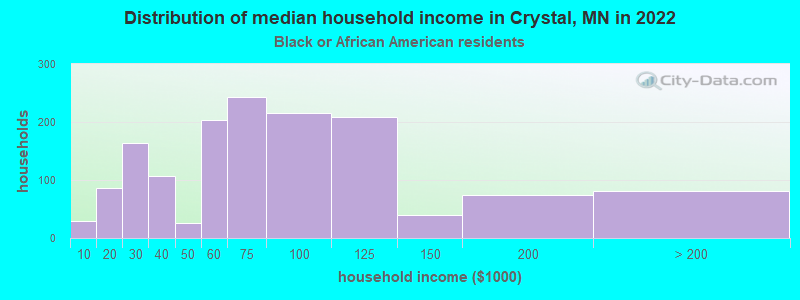
According to 2022 data, the most numerous races in Crystal, MN are White alone (15,768 residents), Black alone (3,489 residents), and Hispanic (1,050 residents). 89.4% of Crystal residents speak English at home. 8.4% of Crystal, MN residents are foreign-born (3.5% born in Africa, 1.9% born in Asia, 1.7% born in Latin America), which is 5.0% greater than the foreign-born rate of 8.0% across the entire state of Minnesota.
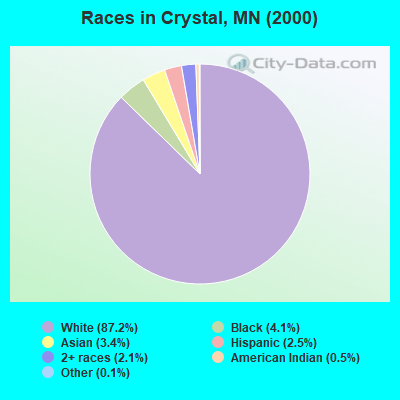
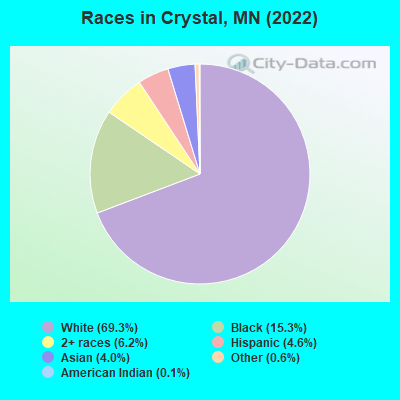
Race distribution in Crystal
2000 2022
4,337,143 88.2% White alone 168,813 3.4% Black alone 143,382 2.9% Hispanic 141,083 2.9% Asian alone 70,304 1.4% Two or more races 52,009 1.1% American Indian alone 5,031 0.1% Other race alone 1,714 0.03% Native Hawaiian and Other
4,356,347 76.2% White alone 395,179 6.9% Black alone 333,830 5.8% Hispanic 294,800 5.2% Asian alone 259,649 4.5% Two or more races 42,125 0.7% American Indian alone 32,976 0.6% Other race alone 2,278 0.04% Native Hawaiian and Other
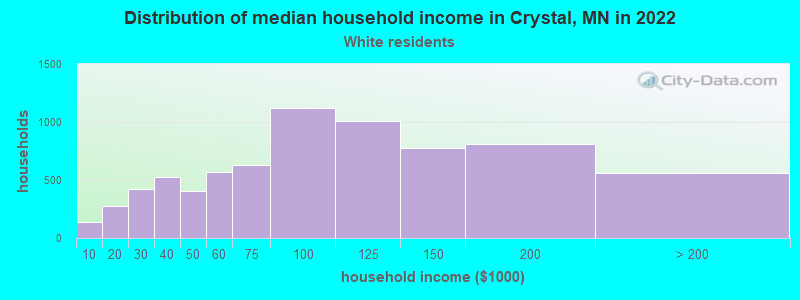
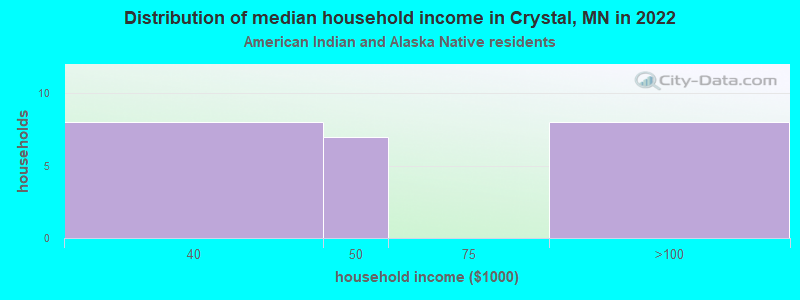
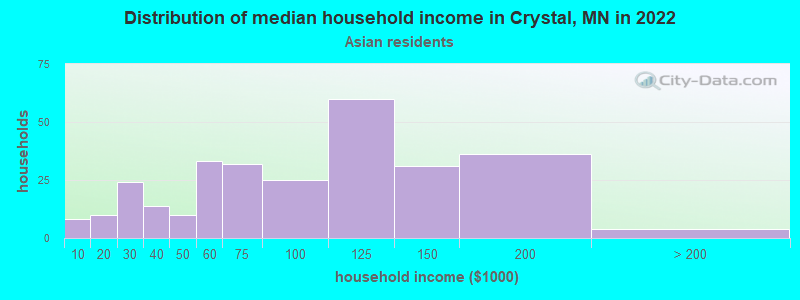
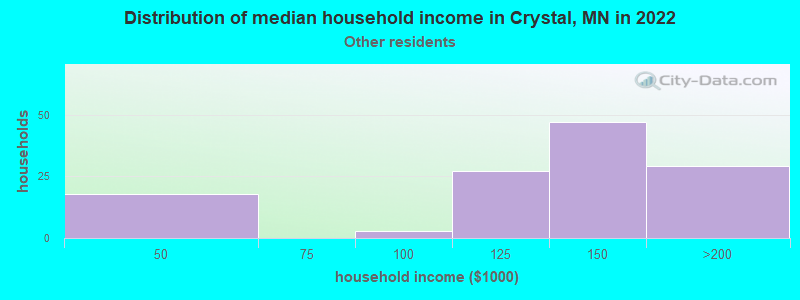
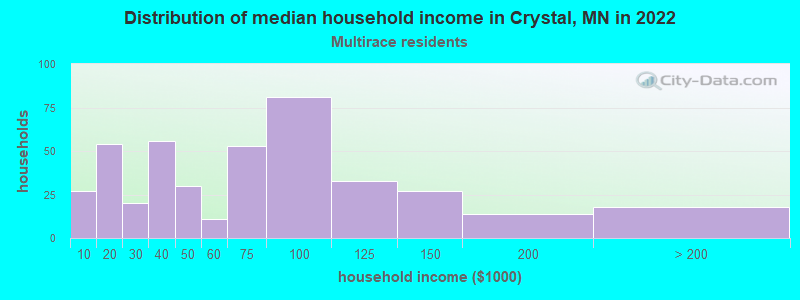
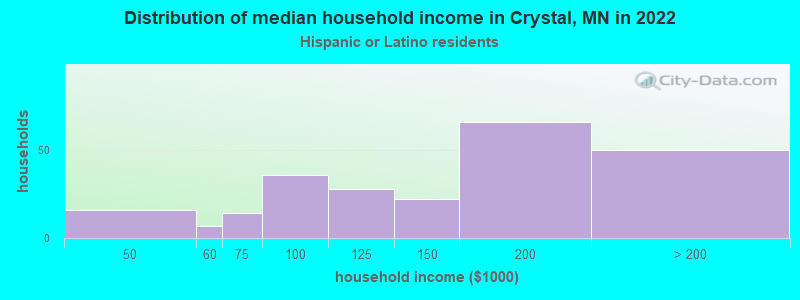
Income and house value in Crystal Median household income in 2022 $87,420 White non-Hispanic householders$73,693 Black householders$89,345 Asian householders$145,401 Some other race householders$67,481 Two or more races householders$137,895 Hispanic or Latino race householdersMedian 2022 house value $276,330 White Non-Hispanic householders$294,719 Black or African American householders$288,590 American Indian or Alaska Native householders $284,667 Asian householders$243,965 Some other race householders$321,936 Two or more races householders$249,359 Hispanic or Latino householders
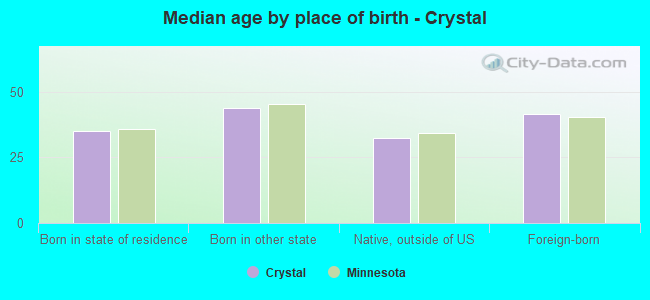
Median age by race in Crystal
40.9 Median age for White residents39.8 43.1 31.9 Median age for Black or African American residents31.5 32.1 16.0 Median age for American Indian / Alaska Native residents4.6 16.5 32.9 Median age for Asian residents32.4 35.6 -790,303,029.5 Median age for Native Hawaiian / Pacific Islander residents-856,799,036.4 -365,948,037.2 40.1 Median age for Other race residents44.9 38.5 17.6 Median age for Two or more races residents22.7 14.3 40.8 Median age for White alone residents39.7 42.8 34.2 Median age for Hispanic or Latino residents39.3 27.7
Owner/renter occupied households by race in Crystal
House owners and renters - White residents 5,933 81.2% Owner occupied1,370 18.8% Renter occupiedHouse owners and renters - Black or African American residents 563 39.5% Owner occupied863 60.5% Renter occupiedHouse owners and renters - American Indian / Alaska Native residents 8 32.4% Owner occupied17 67.6% Renter occupiedHouse owners and renters - Asian residents 206 73.5% Owner occupied74 26.5% Renter occupiedHouse owners and renters - Other race residents 84 80.3% Owner occupied21 19.7% Renter occupiedHouse owners and renters - Two or more races residents 276 66.2% Owner occupied141 33.8% Renter occupiedHouse owners and renters - White alone residents 5,885 81.3% Owner occupied1,350 18.7% Renter occupiedHouse owners and renters - Hispanic or Latino residents 140 59.9% Owner occupied94 40.1% Renter occupied
Language usage in Crystal
English speakers - Total 89.4% of residents of Crystal speak English at home.
3.7% of residents speak Spanish at home 497 61.2% Speak English very well315 38.8% Speak English less than very well6.7% of residents speak other language at home 998 68.4% Speak English very well461 31.6% Speak English less than very well
English speakers - Born in the United States 95.1% of residents of Crystal speak English at home.
1.6% of residents speak Spanish at home 77 100.0% Speak English very well2.7% of residents speak other language at home 123 94.6% Speak English very well7 5.4% Speak English less than very well
English speakers - Native, born elsewhere 81.2% of residents of Crystal speak English at home.
15.3% of residents speak other language at home 27 100.0% Speak English very well
English speakers - Foreign-born 30.7% of residents of Crystal speak English at home.
15.9% of residents speak Spanish at home 134 46.9% Speak English very well152 53.1% Speak English less than very well52.1% of residents speak other language at home 540 57.6% Speak English very well398 42.4% Speak English less than very well
White (Caucasian) - Speak only English Native:
96.8% (14,690)Foreign-born:
39.9% (83)
White (Caucasian) - Speak another language Native:
3.1% (477)Foreign-born:
59.2% (123)
Black or African American - Speak only English Native:
87.5% (2,214)Foreign-born:
32.1% (267)
Black or African American - Speak another language Native:
9.9% (250)Foreign-born:
60.7% (506)
American Indian / Alaska Native - Speak only English Native:
37.4% (16)Foreign-born:
100.0% (32)
American Indian / Alaska Native - Speak another language Native:
94.5% (41)Foreign-born:
3.7% (1)
Asian - Speak only English Native:
67.8% (294)Foreign-born:
13.6% (55)
Asian - Speak another language Native:
36.7% (159)Foreign-born:
86.2% (347)
Other race - Speak only English Native:
84.2% (121)Foreign-born:
30.0% (75)
Other race - Speak another language Native:
23.8% (34)Foreign-born:
69.0% (174)
Two or more races - Speak only English Native:
95.5% (1,477)Foreign-born:
11.8% (13)
Two or more races - Speak another language Native:
5.8% (89)Foreign-born:
87.3% (95)
White alone - Speak only English Native:
98.0% (14,587)Foreign-born:
48.8% (72)
White alone - Speak another language Native:
2.1% (307)Foreign-born:
51.6% (76)
Hispanic or Latino - Speak only English Native:
59.5% (416)Foreign-born:
21.5% (77)
Hispanic or Latino - Speak another language Native:
41.4% (289)Foreign-born:
80.9% (291)
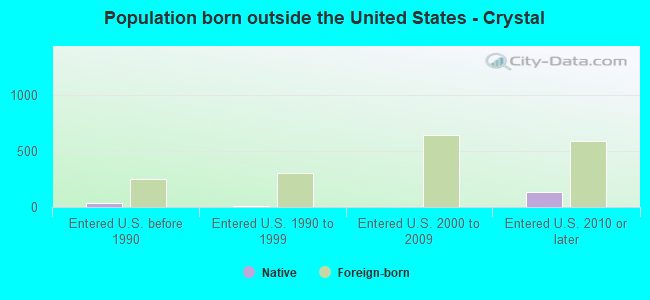
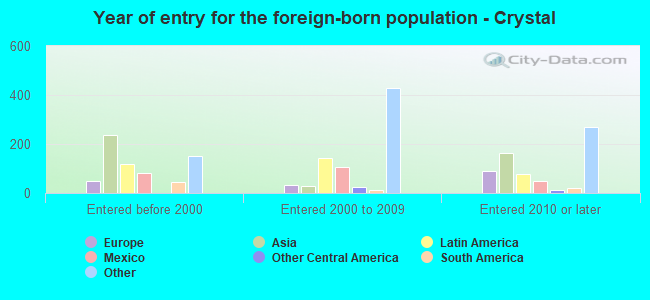
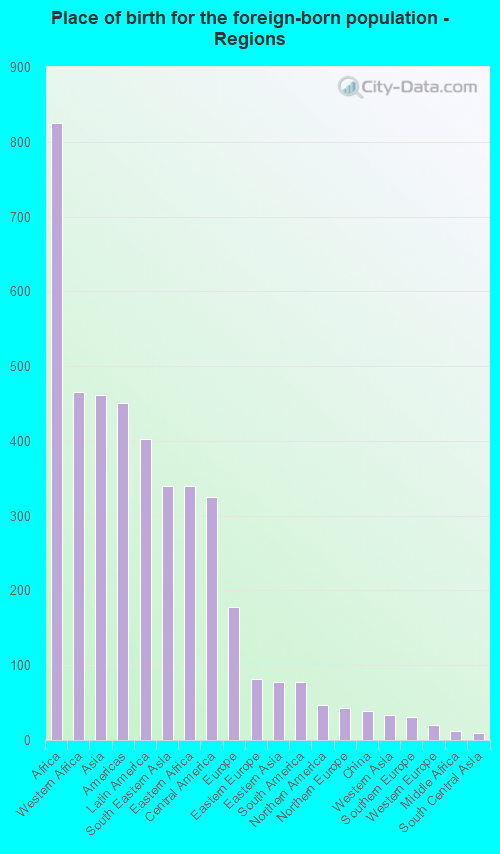
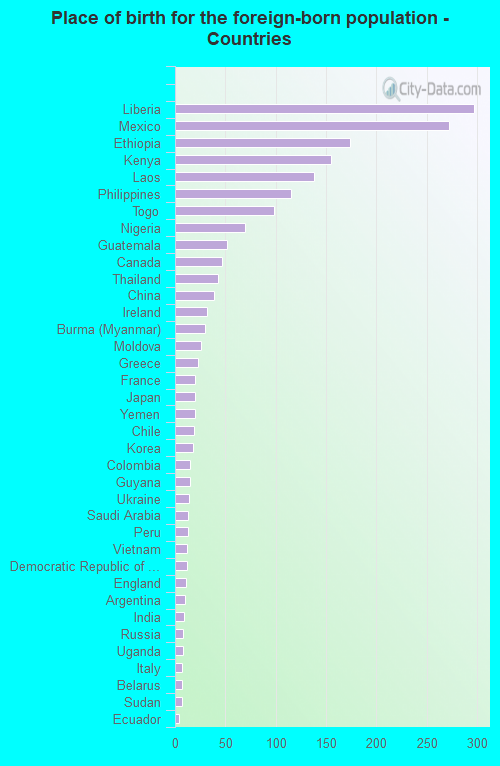
Foreign-born residents in Crystal 1,917 residents are foreign born (3.5% Africa , 1.9% Asia , 1.7% Latin America ).
This city:
8.4%Minnesota:
8.5%
Marital status for residents in Crystal Marital status - White (Caucasian) population 15 years and over
Males 36.6% Never married49.6% Now married1.0% Separated3.2% Widowed9.6% DivorcedFemales 30.4% Never married46.1% Now married0.6% Separated10.1% Widowed12.9% DivorcedWomen who gave birth in the past 12 months Now married:
86.6% (117)Unmarried:
13.4% (18)
Women who did not give birth in the past 12 months Now married:
48.3% (1,709)Unmarried:
51.7% (1,829)
Marital status - Black or African American population 15 years and over
Males 53.5% Never married32.3% Now married2.3% Separated0.0% Widowed11.9% DivorcedFemales 62.7% Never married16.0% Now married0.6% Separated0.8% Widowed19.8% DivorcedWomen who gave birth in the past 12 months Now married:
100.0% (8)Unmarried:
0.0% (0)
Women who did not give birth in the past 12 months Now married:
9.2% (104)Unmarried:
90.8% (1,022)
Marital status - American Indian / Alaska Native population 15 years and over
Males 0.0% Never married93.3% Now married0.0% Separated0.0% Widowed6.7% DivorcedFemales 96.4% Never married0.0% Now married3.6% Separated0.0% Widowed0.0% DivorcedWomen who did not give birth in the past 12 months Now married:
3.6% (1)Unmarried:
96.4% (29)
Marital status - Asian population 15 years and over
Males 55.7% Never married38.3% Now married0.0% Separated0.0% Widowed6.0% DivorcedFemales 40.1% Never married36.2% Now married1.4% Separated9.8% Widowed12.5% DivorcedWomen who gave birth in the past 12 months Now married:
100.0% (13)Unmarried:
0.0% (0)
Women who did not give birth in the past 12 months Now married:
31.9% (87)Unmarried:
68.1% (186)
Marital status - Other race population 15 years and over
Males 21.7% Never married77.2% Now married0.0% Separated1.1% Widowed0.0% DivorcedFemales 34.0% Never married54.7% Now married0.0% Separated11.3% Widowed0.0% DivorcedWomen who did not give birth in the past 12 months Now married:
51.4% (55)Unmarried:
48.6% (52)
Marital status - Two or more races population 15 years and over
Males 60.3% Never married16.7% Now married7.0% Separated1.6% Widowed14.5% DivorcedFemales 56.8% Never married35.0% Now married0.0% Separated4.6% Widowed3.6% DivorcedWomen who gave birth in the past 12 months Now married:
50.0% (13)Unmarried:
50.0% (13)
Women who did not give birth in the past 12 months Now married:
26.0% (77)Unmarried:
74.0% (218)
Marital status - White alone, not Hispanic / Latino population 15 years and over
Males 36.1% Never married49.8% Now married1.0% Separated3.4% Widowed9.7% DivorcedFemales 29.8% Never married46.0% Now married0.4% Separated10.4% Widowed13.3% DivorcedWomen who gave birth in the past 12 months Now married:
92.5% (119)Unmarried:
7.5% (10)
Women who did not give birth in the past 12 months Now married:
48.7% (1,679)Unmarried:
51.3% (1,766)
Marital status - Hispanic or Latino population 15 years and over
Males 40.6% Never married46.2% Now married7.8% Separated0.4% Widowed5.0% DivorcedFemales 48.4% Never married40.6% Now married2.2% Separated6.3% Widowed2.5% DivorcedWomen who gave birth in the past 12 months Now married:
0.0% (0)Unmarried:
100.0% (9)
Women who did not give birth in the past 12 months Now married:
32.9% (105)Unmarried:
67.1% (215)
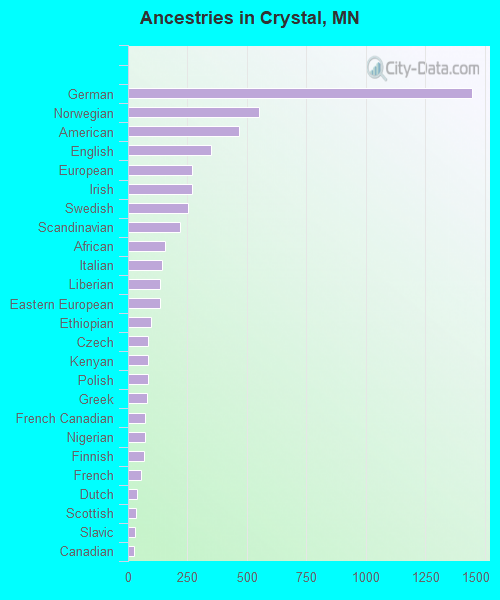
Ancestries in Crystal
1,445 15.4% German552 5.9% Norwegian466 5.0% American350 3.7% English269 2.9% European268 2.9% Irish253 2.7% Swedish219 2.3% Scandinavian157 1.7% African144 1.5% Italian136 1.5% Liberian134 1.4% Eastern European97 1.0% Ethiopian84 0.9% Czech84 0.9% Kenyan82 0.9% Polish79 0.8% Greek73 0.8% French Canadian73 0.8% Nigerian68 0.7% Finnish55 0.6% French37 0.4% Dutch32 0.3% Scottish28 0.3% Slavic24 0.3% Canadian19 0.2% Danish16 0.2% Croatian13 0.1% Hungarian10 0.1% Austrian10 0.1% Czechoslovakian9 0.10% Welsh9 0.10% Ukrainian8 0.09% Russian6 0.06% Northern European6 0.06% Arab5 0.05% Estonian3 0.03% Pennsylvania German3 0.03% Iranian
Children Nativity (place of birth) in Crystal
Children under 6 years - Living with two parents Both parents native 804 100.0% NativeBoth parents foreign-born 88 100.0% NativeOne native, one foreign-born parent 31 100.0% NativeChildren under 6 years - Living with one parent Native parent 266 100.0% NativeForeign-born parent 25 100.0% NativeChildren 6 to 17 years - Living with two parents Both parents native 1,845 98.4% Native29 1.6% Foreign-bornBoth parents foreign-born 221 92.5% Native18 7.5% Foreign-bornOne native, one foreign-born parent 136 100.0% NativeChildren 6 to 17 years - Living with one parent Native parent 821 100.0% NativeForeign-born parent 86 53.6% Native75 46.4% Foreign-born
Grandparents responsible for own grandchildren in Crystal
Grandparents (30 to 59 years) White / Caucasian 13 45.6% Responsible for grandchildren15 54.4% Not responsible for grandchildrenBlack or African American 11 20.7% Responsible for grandchildren44 79.3% Not responsible for grandchildrenWhite alone, not Hispanic / Latino 5 22.4% Responsible for grandchildren17 77.6% Not responsible for grandchildrenHispanic or Latino 8 100.0% Responsible for grandchildrenGrandparents (60 years and over) White / Caucasian 40 28.7% Responsible for grandchildren101 71.3% Not responsible for grandchildrenWhite alone, not Hispanic / Latino 41 28.1% Responsible for grandchildren106 71.9% Not responsible for grandchildren