Races in Cudahy, California (CA) Detailed Stats
Data:
Races - White alone (%)
Races - White alone (% change since 2000)
Races - Black alone (%)
Races - Black alone (% change since 2000)
Races - American Indian alone (%)
Races - American Indian alone (% change since 2000)
Races - Asian alone (%)
Races - Asian alone (% change since 2000)
Races - Hispanic (%)
Races - Hispanic (% change since 2000)
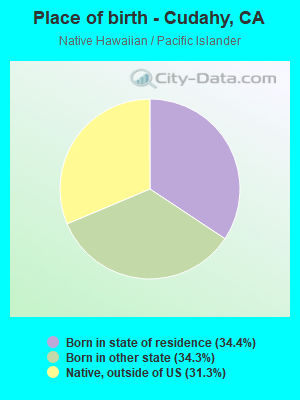
Races - Native Hawaiian and Other Pacific Islander alone (%)
Races - Native Hawaiian and Other Pacific Islander alone (% change since 2000)
Races - Two or more races(%)
Races - Two or more races(% change since 2000)
Races - Other race alone (%)
Races - Other race alone (% change since 2000)
Racial diversity
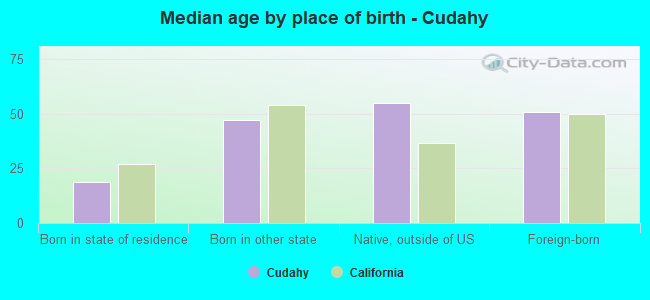
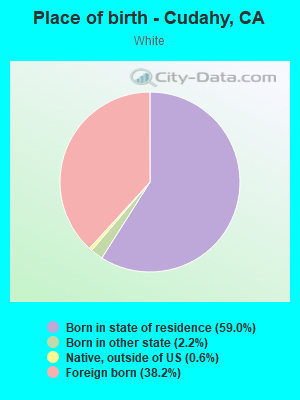
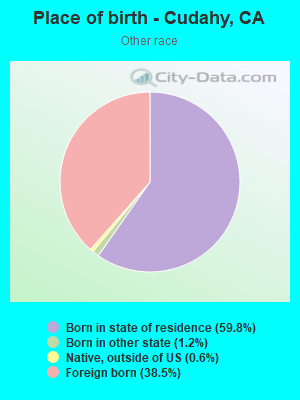
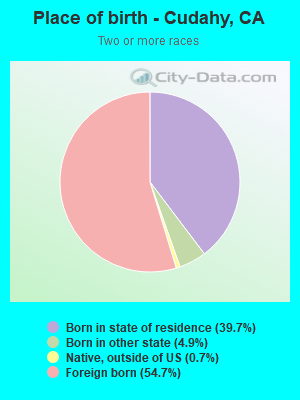
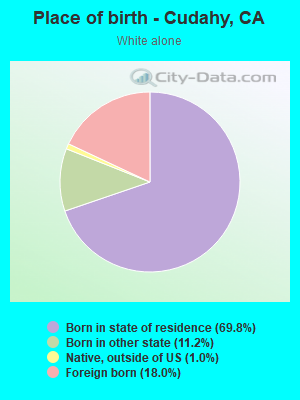
Place of birth - Born in state of residence (%)
Place of birth - Born in state of residence (%) - White
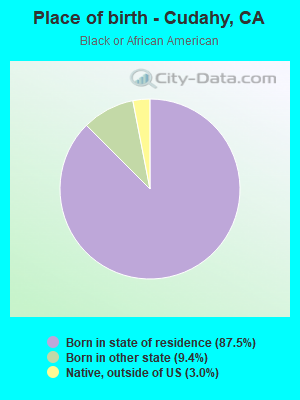
Place of birth - Born in state of residence (%) - Black or African American
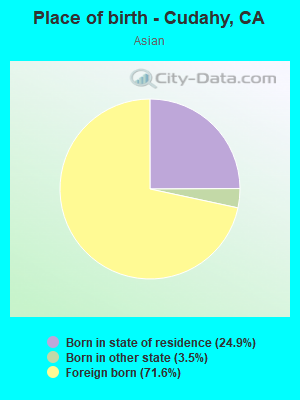
Place of birth - Born in state of residence (%) - Asian
Place of birth - Born in state of residence (%) - Hispanic or Latino
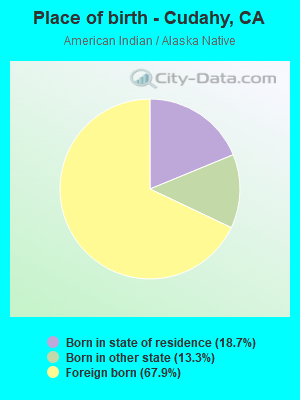
Place of birth - Born in state of residence (%) - American Indian and Alaska Native
Place of birth - Born in state of residence (%) - Multirace
Place of birth - Born in state of residence (%) - Other Race
Place of birth - Born in other state (%)
Place of birth - Born in other state (%) - White
Place of birth - Born in other state (%) - Black or African American
Place of birth - Born in other state (%) - Asian
Place of birth - Born in other state (%) - Hispanic or Latino
Place of birth - Born in other state (%) - American Indian and Alaska Native
Place of birth - Born in other state (%) - Multirace
Place of birth - Born in other state (%) - Other Race
Place of birth - Native, outside of US (%)
Place of birth - Native, outside of US (%) - White
Place of birth - Native, outside of US (%) - Black or African American
Place of birth - Native, outside of US (%) - Asian
Place of birth - Native, outside of US (%) - Hispanic or Latino
Place of birth - Native, outside of US (%) - American Indian and Alaska Native
Place of birth - Native, outside of US (%) - Multirace
Place of birth - Native, outside of US (%) - Other Race
Place of birth - Foreign born (%)
Place of birth - Foreign born (%) - White
Place of birth - Foreign born (%) - Black or African American
Place of birth - Foreign born (%) - Asian
Place of birth - Foreign born (%) - Hispanic or Latino
Place of birth - Foreign born (%) - American Indian and Alaska Native
Place of birth - Foreign born (%) - Multirace
Place of birth - Foreign born (%) - Other Race
Residents speaking English at home (%)
Residents speaking English at home - Born in the United States (%)
Residents speaking English at home - Native, born elsewhere (%)
Residents speaking English at home - Foreign born (%)
Residents speaking Spanish at home (%)
Residents speaking Spanish at home - Born in the United States (%)
Residents speaking Spanish at home - Native, born elsewhere (%)
Residents speaking Spanish at home - Foreign born (%)
Residents speaking other language at home (%)
Residents speaking other language at home - Born in the United States (%)
Residents speaking other language at home - Native, born elsewhere (%)
Residents speaking other language at home - Foreign born (%)
Marital status - Never married (%)
Marital status - Now married (%)
Marital status - Separated (%)
Marital status - Widowed (%)
Marital status - Divorced (%)
Ancestries Reported - Arab (%)
Ancestries Reported - Czech (%)
Ancestries Reported - Danish (%)
Ancestries Reported - Dutch (%)
Ancestries Reported - English (%)
Ancestries Reported - French (%)
Ancestries Reported - French Canadian (%)
Ancestries Reported - German (%)
Ancestries Reported - Greek (%)
Ancestries Reported - Hungarian (%)
Ancestries Reported - Irish (%)
Ancestries Reported - Italian (%)
Ancestries Reported - Lithuanian (%)
Ancestries Reported - Norwegian (%)
Ancestries Reported - Polish (%)
Ancestries Reported - Portuguese (%)
Ancestries Reported - Russian (%)
Ancestries Reported - Scotch-Irish (%)
Ancestries Reported - Scottish (%)
Ancestries Reported - Slovak (%)
Ancestries Reported - Subsaharan African (%)
Ancestries Reported - Swedish (%)
Ancestries Reported - Swiss (%)
Ancestries Reported - Ukrainian (%)
Ancestries Reported - United States (%)
Ancestries Reported - Welsh (%)
Ancestries Reported - West Indian (%)
Ancestries Reported - Other (%)
Geographical mobility - Same house 1 year ago (%)
Geographical mobility - Same house 1 year ago (%) - White
Geographical mobility - Same house 1 year ago (%) - Black or African American
Geographical mobility - Same house 1 year ago (%) - Asian
Geographical mobility - Same house 1 year ago (%) - Hispanic or Latino
Geographical mobility - Same house 1 year ago (%) - American Indian and Alaska Native
Geographical mobility - Same house 1 year ago (%) - Multirace
Geographical mobility - Same house 1 year ago (%) - Other Race
Geographical mobility - Moved within same county (%)
Geographical mobility - Moved within same county (%) - White
Geographical mobility - Moved within same county (%) - Black or African American
Geographical mobility - Moved within same county (%) - Asian
Geographical mobility - Moved within same county (%) - Hispanic or Latino
Geographical mobility - Moved within same county (%) - American Indian and Alaska Native
Geographical mobility - Moved within same county (%) - Multirace
Geographical mobility - Moved within same county (%) - Other Race
Geographical mobility - Moved from different county within same state (%)
Geographical mobility - Moved from different county within same state (%) - White
Geographical mobility - Moved from different county within same state (%) - Black or African American
Geographical mobility - Moved from different county within same state (%) - Asian
Geographical mobility - Moved from different county within same state (%) - Hispanic or Latino
Geographical mobility - Moved from different county within same state (%) - American Indian and Alaska Native
Geographical mobility - Moved from different county within same state (%) - Multirace
Geographical mobility - Moved from different county within same state (%) - Other Race
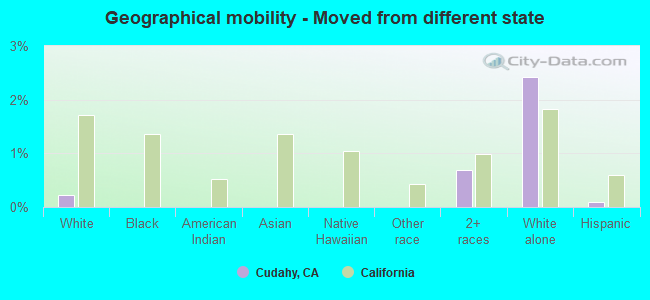
Geographical mobility - Moved from different state (%)
Geographical mobility - Moved from different state (%) - White
Geographical mobility - Moved from different state (%) - Black or African American
Geographical mobility - Moved from different state (%) - Asian
Geographical mobility - Moved from different state (%) - Hispanic or Latino
Geographical mobility - Moved from different state (%) - American Indian and Alaska Native
Geographical mobility - Moved from different state (%) - Multirace
Geographical mobility - Moved from different state (%) - Other Race
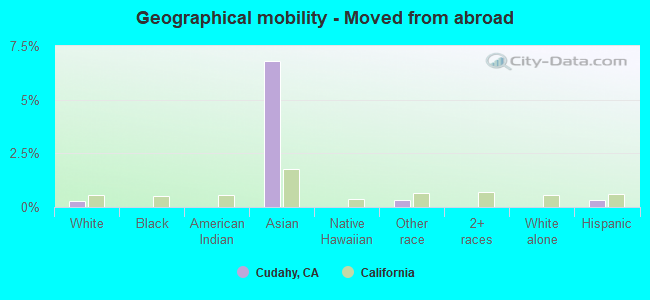
Geographical mobility - Moved from abroad (%)
Geographical mobility - Moved from abroad (%) - White
Geographical mobility - Moved from abroad (%) - Black or African American
Geographical mobility - Moved from abroad (%) - Asian
Geographical mobility - Moved from abroad (%) - Hispanic or Latino
Geographical mobility - Moved from abroad (%) - American Indian and Alaska Native
Geographical mobility - Moved from abroad (%) - Multirace
Geographical mobility - Moved from abroad (%) - Other Race
Place of birth for the foreign-born population - Ireland (%)
Place of birth for the foreign-born population - Denmark (%)
Place of birth for the foreign-born population - Norway (%)
Place of birth for the foreign-born population - Sweden (%)
Place of birth for the foreign-born population - United Kingdom (%)
Place of birth for the foreign-born population - England (%)
Place of birth for the foreign-born population - Scotland (%)
Place of birth for the foreign-born population - Other Northern Europe (%)
Place of birth for the foreign-born population - Austria (%)
Place of birth for the foreign-born population - Belgium (%)
Place of birth for the foreign-born population - France (%)
Place of birth for the foreign-born population - Germany (%)
Place of birth for the foreign-born population - Netherlands (%)
Place of birth for the foreign-born population - Switzerland (%)
Place of birth for the foreign-born population - Other Western Europe (%)
Place of birth for the foreign-born population - Greece (%)
Place of birth for the foreign-born population - Italy (%)
Place of birth for the foreign-born population - Portugal (%)
Place of birth for the foreign-born population - Spain (%)
Place of birth for the foreign-born population - Other Southern Europe (%)
Place of birth for the foreign-born population - Albania (%)
Place of birth for the foreign-born population - Belarus (%)
Place of birth for the foreign-born population - Bosnia and Herzegovina (%)
Place of birth for the foreign-born population - Bulgaria (%)
Place of birth for the foreign-born population - Croatia (%)
Place of birth for the foreign-born population - Czechoslovakia (%)
Place of birth for the foreign-born population - Hungary (%)
Place of birth for the foreign-born population - Latvia (%)
Place of birth for the foreign-born population - Lithuania (%)
Place of birth for the foreign-born population - North Macedonia (Macedonia) (%)
Place of birth for the foreign-born population - Moldova (%)
Place of birth for the foreign-born population - Poland (%)
Place of birth for the foreign-born population - Romania (%)
Place of birth for the foreign-born population - Russia (%)
Place of birth for the foreign-born population - Serbia (%)
Place of birth for the foreign-born population - Ukraine (%)
Place of birth for the foreign-born population - Other Eastern Europe (%)
Place of birth for the foreign-born population - China (%)
Place of birth for the foreign-born population - Hong Kong (%)
Place of birth for the foreign-born population - Taiwan (%)
Place of birth for the foreign-born population - Japan (%)
Place of birth for the foreign-born population - Korea (%)
Place of birth for the foreign-born population - Other Eastern Asia (%)
Place of birth for the foreign-born population - Afghanistan (%)
Place of birth for the foreign-born population - Bangladesh (%)
Place of birth for the foreign-born population - India (%)
Place of birth for the foreign-born population - Iran (%)
Place of birth for the foreign-born population - Kazakhstan (%)
Place of birth for the foreign-born population - Nepal (%)
Place of birth for the foreign-born population - Pakistan (%)
Place of birth for the foreign-born population - Sri Lanka (%)
Place of birth for the foreign-born population - Uzbekistan (%)
Place of birth for the foreign-born population - Other South Central Asia (%)
Place of birth for the foreign-born population - Burma (%)
Place of birth for the foreign-born population - Cambodia (%)
Place of birth for the foreign-born population - Indonesia (%)
Place of birth for the foreign-born population - Laos (%)
Place of birth for the foreign-born population - Malaysia (%)
Place of birth for the foreign-born population - Philippines (%)
Place of birth for the foreign-born population - Singapore (%)
Place of birth for the foreign-born population - Thailand (%)
Place of birth for the foreign-born population - Vietnam (%)
Place of birth for the foreign-born population - Other South Eastern Asia (%)
Place of birth for the foreign-born population - Armenia (%)
Place of birth for the foreign-born population - Iraq (%)
Place of birth for the foreign-born population - Israel (%)
Place of birth for the foreign-born population - Jordan (%)
Place of birth for the foreign-born population - Kuwait (%)
Place of birth for the foreign-born population - Lebanon (%)
Place of birth for the foreign-born population - Saudi Arabia (%)
Place of birth for the foreign-born population - Syria (%)
Place of birth for the foreign-born population - Turkey (%)
Place of birth for the foreign-born population - Yemen (%)
Place of birth for the foreign-born population - Other Western Asia (%)
Place of birth for the foreign-born population - Eritrea (%)
Place of birth for the foreign-born population - Ethiopia (%)
Place of birth for the foreign-born population - Kenya (%)
Place of birth for the foreign-born population - Somalia (%)
Place of birth for the foreign-born population - Uganda (%)
Place of birth for the foreign-born population - Zimbabwe (%)
Place of birth for the foreign-born population - Other Eastern Africa (%)
Place of birth for the foreign-born population - Cameroon (%)
Place of birth for the foreign-born population - Congo (%)
Place of birth for the foreign-born population - Democratic Republic of Congo (Zaire) (%)
Place of birth for the foreign-born population - Other Middle Africa (%)
Place of birth for the foreign-born population - Egypt (%)
Place of birth for the foreign-born population - Morocco (%)
Place of birth for the foreign-born population - Sudan (%)
Place of birth for the foreign-born population - Other Northern Africa (%)
Place of birth for the foreign-born population - South Africa (%)
Place of birth for the foreign-born population - Other Southern Africa (%)
Place of birth for the foreign-born population - Cabo Verde (%)
Place of birth for the foreign-born population - Ghana (%)
Place of birth for the foreign-born population - Liberia (%)
Place of birth for the foreign-born population - Nigeria (%)
Place of birth for the foreign-born population - Senegal (%)
Place of birth for the foreign-born population - Sierra Leone (%)
Place of birth for the foreign-born population - Other Western Africa (%)
Place of birth for the foreign-born population - Australia (%)
Place of birth for the foreign-born population - New Zealand (%)
Place of birth for the foreign-born population - Fiji (%)
Place of birth for the foreign-born population - Micronesia (%)
Place of birth for the foreign-born population - Bahamas (%)
Place of birth for the foreign-born population - Barbados (%)
Place of birth for the foreign-born population - Cuba (%)
Place of birth for the foreign-born population - Dominica (%)
Place of birth for the foreign-born population - Dominican Republic (%)
Place of birth for the foreign-born population - Grenada (%)
Place of birth for the foreign-born population - Haiti (%)
Place of birth for the foreign-born population - Jamaica (%)
Place of birth for the foreign-born population - St. Vincent and the Grenadines (%)
Place of birth for the foreign-born population - Trinidad and Tobago (%)
Place of birth for the foreign-born population - West Indies (%)
Place of birth for the foreign-born population - Other Caribbean (%)
Place of birth for the foreign-born population - Belize (%)
Place of birth for the foreign-born population - Costa Rica (%)
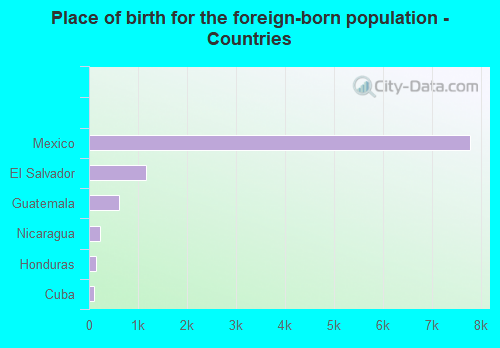
Place of birth for the foreign-born population - El Salvador (%)
Place of birth for the foreign-born population - Guatemala (%)
Place of birth for the foreign-born population - Honduras (%)
Place of birth for the foreign-born population - Mexico (%)
Place of birth for the foreign-born population - Nicaragua (%)
Place of birth for the foreign-born population - Panama (%)
Place of birth for the foreign-born population - Other Central America (%)
Place of birth for the foreign-born population - Argentina (%)
Place of birth for the foreign-born population - Bolivia (%)
Place of birth for the foreign-born population - Brazil (%)
Place of birth for the foreign-born population - Chile (%)
Place of birth for the foreign-born population - Colombia (%)
Place of birth for the foreign-born population - Ecuador (%)
Place of birth for the foreign-born population - Guyana (%)
Place of birth for the foreign-born population - Peru (%)
Place of birth for the foreign-born population - Uruguay (%)
Place of birth for the foreign-born population - Venezuela (%)
Place of birth for the foreign-born population - Other South America (%)
Place of birth for the foreign-born population - Canada (%)
Place of birth for the foreign-born population - Other Northern America (%)
Place of birth for the foreign-born population - Other (%)
Latest news about races in Cudahy, CA collected exclusively by city-data.com from local newspapers, TV, and radio stations
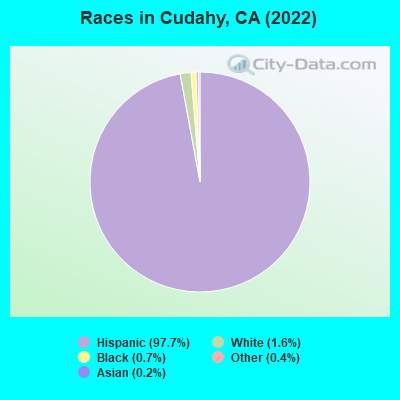
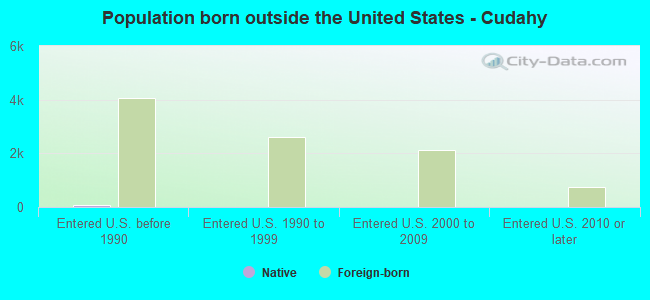
According to 2022 data, the most numerous races in Cudahy, CA are Hispanic (23,138 residents), White alone (693 residents), and Asian alone (128 residents). 8.3% of Cudahy residents speak English at home. 43.6% of Cudahy, CA residents are foreign-born (41.9% born in Latin America), which is 40.3% greater than the foreign-born rate of 26.0% across the entire state of California.
Race distribution in Cudahy
2000 2022
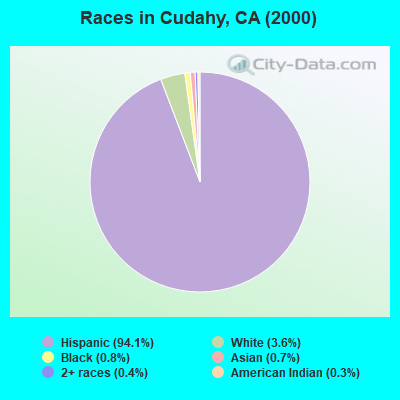
15,816,790 46.7% White alone 10,966,556 32.4% Hispanic 3,648,860 10.8% Asian alone 2,181,926 6.4% Black alone 903,115 2.7% Two or more races 178,984 0.5% American Indian alone 103,736 0.3% Native Hawaiian and Other 71,681 0.2% Other race alone
15,732,184 40.3% Hispanic 13,160,426 33.7% White alone 5,957,867 15.3% Asian alone 2,025,218 5.2% Black alone 1,663,222 4.3% Two or more races 251,618 0.6% Other race alone 135,777 0.3% Native Hawaiian and Other 103,030 0.3% American Indian alone
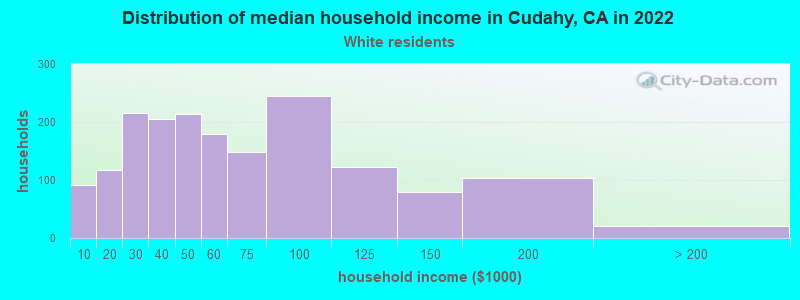
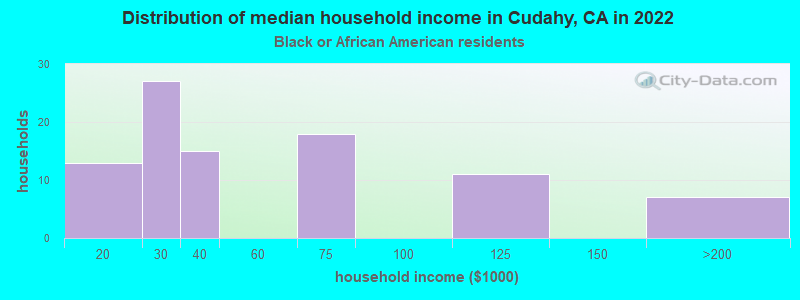
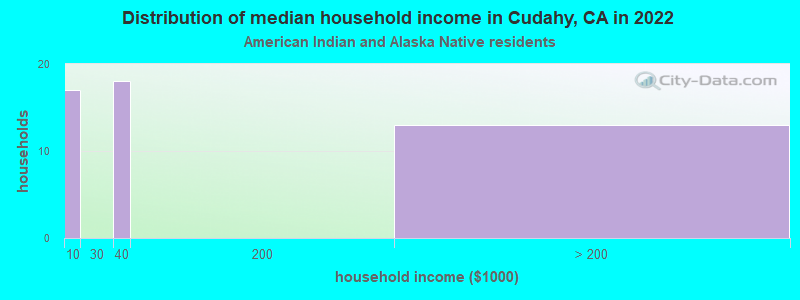
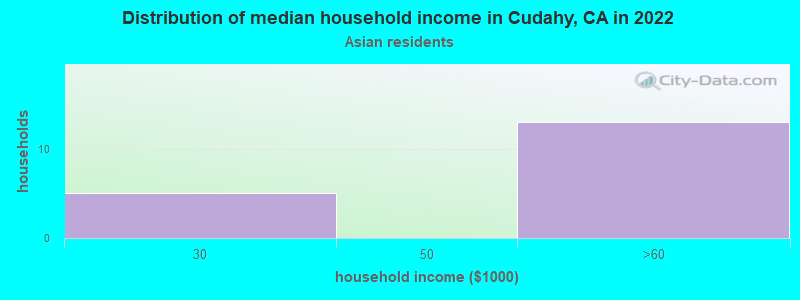
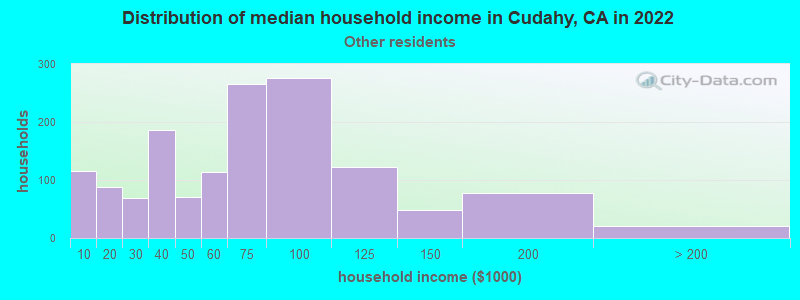
Income and house value in Cudahy Median household income in 2022 $74,212 White non-Hispanic householders$48,502 Black householders$50,608 American Indian and Alaska Native householders$164,462 Asian householders$71,363 Some other race householders$52,287 Two or more races householders$64,743 Hispanic or Latino race householdersMedian 2022 house value $486,264 White Non-Hispanic householders$357,410 American Indian or Alaska Native householders $517,578 Asian householders$560,770 Some other race householders$742,534 Two or more races householders$560,050 Hispanic or Latino householders
Median age by race in Cudahy
31.1 Median age for White residents31.6 30.6 33.4 Median age for Black or African American residents33.8 31.5 72.0 Median age for American Indian / Alaska Native residents56.3 Median age for Asian residents38.1 61.3 27.2 Median age for Native Hawaiian / Pacific Islander residents29.2 Median age for Other race residents27.6 31.5 38.7 Median age for Two or more races residents40.4 30.3 22.7 Median age for White alone residents28.3 17.1 31.1 Median age for Hispanic or Latino residents30.7 31.2
Owner/renter occupied households by race in Cudahy
House owners and renters - White residents 505 13.1% Owner occupied3,366 86.9% Renter occupiedHouse owners and renters - Black or African American residents 20 28.9% Owner occupied50 71.1% Renter occupiedHouse owners and renters - American Indian / Alaska Native residents 9 18.8% Owner occupied39 81.2% Renter occupiedHouse owners and renters - Asian residents 32 85.6% Owner occupied5 14.4% Renter occupiedHouse owners and renters - Native Hawaiian / Pacific Islander residents 7 100.0% Renter occupiedHouse owners and renters - Other race residents 114 10.9% Owner occupied933 89.1% Renter occupiedHouse owners and renters - Two or more races residents 190 49.0% Owner occupied197 51.0% Renter occupiedHouse owners and renters - White alone residents 60 39.7% Owner occupied91 60.3% Renter occupiedHouse owners and renters - Hispanic or Latino residents 732 12.9% Owner occupied4,944 87.1% Renter occupied
Language usage in Cudahy
English speakers - Total 8.3% of residents of Cudahy speak English at home.
88.8% of residents speak Spanish at home 11,628 59.1% Speak English very well8,051 40.9% Speak English less than very well1.3% of residents speak other language at home 240 80.8% Speak English very well57 19.2% Speak English less than very well
English speakers - Born in the United States 34.0% of residents of Cudahy speak English at home.
64.0% of residents speak Spanish at home 134 43.6% Speak English very well173 56.4% Speak English less than very well
English speakers - Native, born elsewhere 13.8% of residents of Cudahy speak English at home.
77.9% of residents speak Spanish at home 51 45.1% Speak English very well62 54.9% Speak English less than very well8.3% of residents speak other language at home 12 100.0% Speak English very well
English speakers - Foreign-born 2.4% of residents of Cudahy speak English at home.
92.2% of residents speak Spanish at home 2,648 28.3% Speak English very well6,708 71.7% Speak English less than very well1.8% of residents speak other language at home 126 68.9% Speak English very well57 31.1% Speak English less than very well
White (Caucasian) - Speak only English Native:
12.8% (1,012)Foreign-born:
2.9% (160)
White (Caucasian) - Speak another language Native:
68.6% (5,406)Foreign-born:
92.8% (5,104)
American Indian / Alaska Native - Speak another language Native:
59.0% (21)Foreign-born:
99.6% (63)
Asian - Speak another language Native:
84.4% (31)Foreign-born:
98.8% (90)
Other race - Speak only English Native:
12.1% (310)Foreign-born:
3.2% (57)
Other race - Speak another language Native:
85.1% (2,192)Foreign-born:
96.1% (1,686)
Two or more races - Speak another language Native:
100.0% (568)Foreign-born:
100.0% (945)
White alone - Speak only English Native:
31.3% (146)Foreign-born:
3.7% (5)
White alone - Speak another language Native:
71.8% (334)Foreign-born:
97.6% (125)
Hispanic or Latino - Speak only English Native:
12.3% (1,472)Foreign-born:
2.8% (264)
Hispanic or Latino - Speak another language Native:
85.0% (10,171)Foreign-born:
96.5% (9,162)
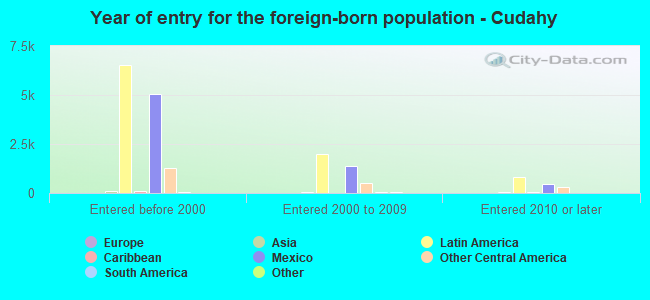
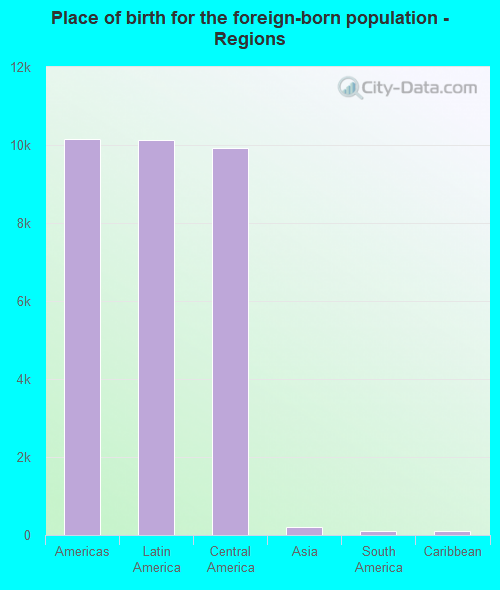
Foreign-born residents in Cudahy 10,386 residents are foreign born (41.9% Latin America ).
This city:
43.6%California:
100.0%
Marital status for residents in Cudahy Marital status - White (Caucasian) population 15 years and over
Males 51.6% Never married41.9% Now married2.1% Separated1.4% Widowed3.1% DivorcedFemales 48.9% Never married38.8% Now married2.9% Separated3.3% Widowed6.1% DivorcedWomen who gave birth in the past 12 months Now married:
45.0% (78)Unmarried:
55.0% (95)
Women who did not give birth in the past 12 months Now married:
34.6% (1,249)Unmarried:
65.4% (2,362)
Marital status - Black or African American population 15 years and over
Males 13.0% Never married56.5% Now married0.0% Separated17.4% Widowed13.0% DivorcedFemales 28.8% Never married63.0% Now married8.2% Separated0.0% Widowed0.0% DivorcedWomen who did not give birth in the past 12 months Now married:
56.2% (25)Unmarried:
43.8% (19)
Marital status - American Indian / Alaska Native population 15 years and over
Males 0.0% Never married41.7% Now married0.0% Separated0.0% Widowed58.3% DivorcedFemales 0.0% Never married71.4% Now married0.0% Separated28.6% Widowed0.0% DivorcedMarital status - Asian population 15 years and over
Males 50.0% Never married40.5% Now married0.0% Separated9.5% Widowed0.0% DivorcedFemales 14.8% Never married64.2% Now married0.0% Separated21.0% Widowed0.0% DivorcedWomen who gave birth in the past 12 months Now married:
100.0% (10)Unmarried:
0.0% (0)
Women who did not give birth in the past 12 months Now married:
100.0% (11)Unmarried:
0.0% (0)
Marital status - Native Hawaiian / Pacific Islander population 15 years and over
Males 0.0% Never married100.0% Now married0.0% Separated0.0% Widowed0.0% DivorcedFemales 66.7% Never married33.3% Now married0.0% Separated0.0% Widowed0.0% DivorcedWomen who did not give birth in the past 12 months Now married:
0.0% (0)Unmarried:
100.0% (12)
Marital status - Other race population 15 years and over
Males 60.5% Never married35.1% Now married0.6% Separated0.0% Widowed3.8% DivorcedFemales 49.3% Never married34.4% Now married6.1% Separated4.2% Widowed6.0% DivorcedWomen who gave birth in the past 12 months Now married:
82.8% (57)Unmarried:
17.2% (12)
Women who did not give birth in the past 12 months Now married:
31.0% (378)Unmarried:
69.0% (842)
Marital status - Two or more races population 15 years and over
Males 42.6% Never married37.8% Now married19.6% Separated0.0% Widowed0.0% DivorcedFemales 24.4% Never married42.2% Now married5.0% Separated12.2% Widowed16.1% DivorcedWomen who gave birth in the past 12 months Now married:
100.0% (18)Unmarried:
0.0% (0)
Women who did not give birth in the past 12 months Now married:
50.6% (132)Unmarried:
49.4% (129)
Marital status - White alone, not Hispanic / Latino population 15 years and over
Males 54.8% Never married39.3% Now married0.0% Separated0.0% Widowed5.9% DivorcedFemales 47.6% Never married42.9% Now married0.0% Separated0.0% Widowed9.4% DivorcedWomen who gave birth in the past 12 months Now married:
100.0% (7)Unmarried:
0.0% (0)
Women who did not give birth in the past 12 months Now married:
34.0% (47)Unmarried:
66.0% (92)
Marital status - Hispanic or Latino population 15 years and over
Males 52.8% Never married40.8% Now married2.2% Separated1.2% Widowed3.1% DivorcedFemales 48.3% Never married38.1% Now married3.7% Separated3.7% Widowed6.2% DivorcedWomen who gave birth in the past 12 months Now married:
53.2% (151)Unmarried:
46.8% (133)
Women who did not give birth in the past 12 months Now married:
34.2% (1,945)Unmarried:
65.8% (3,741)
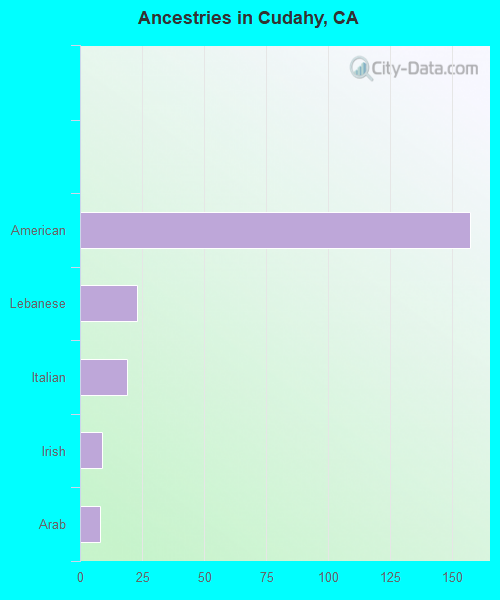
Ancestries in Cudahy
116 0.6% American90 0.5% Lebanese39 0.2% Jordanian28 0.1% English24 0.1% Iranian12 0.06% French8 0.04% Arab7 0.04% Irish4 0.02% German
Children Nativity (place of birth) in Cudahy
Children under 6 years - Living with two parents Both parents native 342 100.0% Native0 0.0% Foreign-bornBoth parents foreign-born 252 97.1% Native7 2.9% Foreign-bornOne native, one foreign-born parent 247 100.0% NativeChildren under 6 years - Living with one parent Native parent 623 100.0% NativeForeign-born parent 424 100.0% NativeChildren 6 to 17 years - Living with two parents Both parents native 606 100.0% NativeBoth parents foreign-born 1,515 95.0% Native79 5.0% Foreign-bornOne native, one foreign-born parent 355 100.0% NativeChildren 6 to 17 years - Living with one parent Native parent 456 100.0% NativeForeign-born parent 1,417 54.0% Native1,209 46.0% Foreign-born
Grandparents responsible for own grandchildren in Cudahy
Grandparents (30 to 59 years) White / Caucasian 62 26.3% Responsible for grandchildren174 73.7% Not responsible for grandchildrenAsian 12 100.0% Not responsible for grandchildrenOther race 145 100.0% Not responsible for grandchildrenWhite alone, not Hispanic / Latino 3 51.6% Responsible for grandchildren3 48.4% Not responsible for grandchildrenHispanic or Latino 95 19.4% Responsible for grandchildren395 80.6% Not responsible for grandchildrenGrandparents (60 years and over) White / Caucasian 26 25.4% Responsible for grandchildren76 74.6% Not responsible for grandchildrenOther race 56 100.0% Not responsible for grandchildrenHispanic or Latino 35 19.4% Responsible for grandchildren145 80.6% Not responsible for grandchildren