Races in Culver City, California (CA) Detailed Stats
Data:
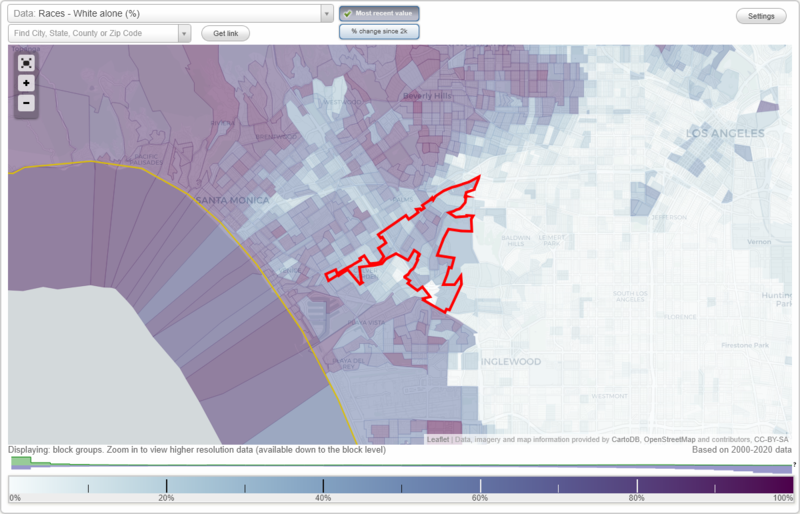
Races - White alone (%)
Races - White alone (% change since 2000)
Races - Black alone (%)
Races - Black alone (% change since 2000)
Races - American Indian alone (%)
Races - American Indian alone (% change since 2000)
Races - Asian alone (%)
Races - Asian alone (% change since 2000)
Races - Hispanic (%)
Races - Hispanic (% change since 2000)
Races - Native Hawaiian and Other Pacific Islander alone (%)
Races - Native Hawaiian and Other Pacific Islander alone (% change since 2000)
Races - Two or more races(%)
Races - Two or more races(% change since 2000)
Races - Other race alone (%)
Races - Other race alone (% change since 2000)
Racial diversity
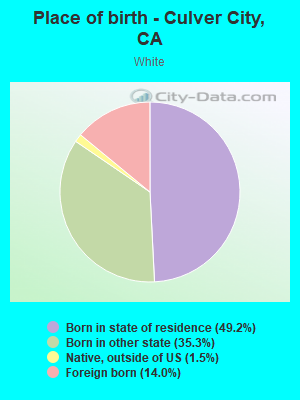
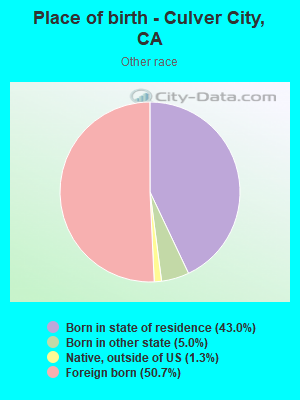
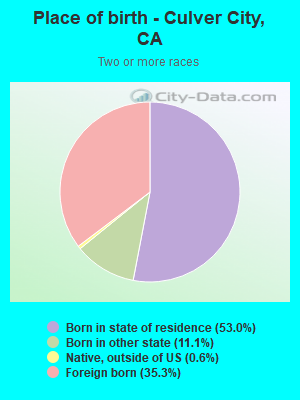
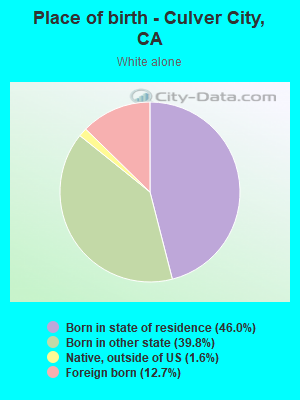
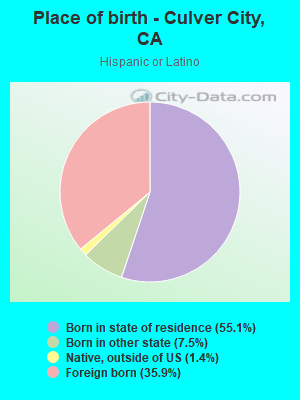
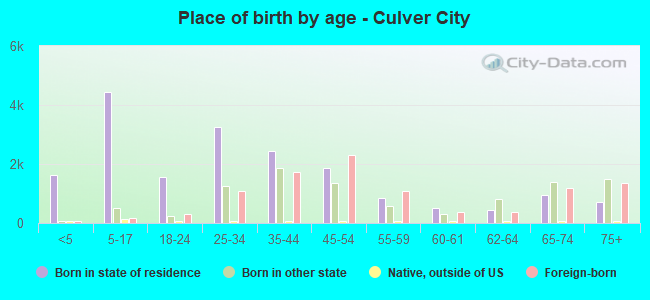
Place of birth - Born in state of residence (%)
Place of birth - Born in state of residence (%) - White
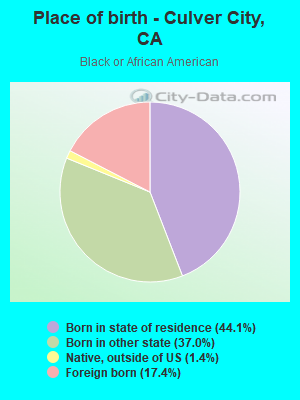
Place of birth - Born in state of residence (%) - Black or African American
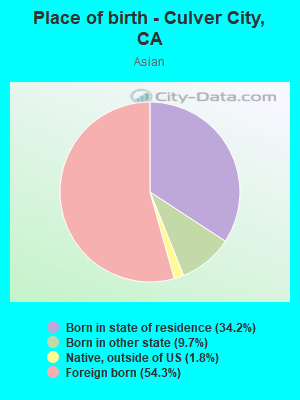
Place of birth - Born in state of residence (%) - Asian
Place of birth - Born in state of residence (%) - Hispanic or Latino
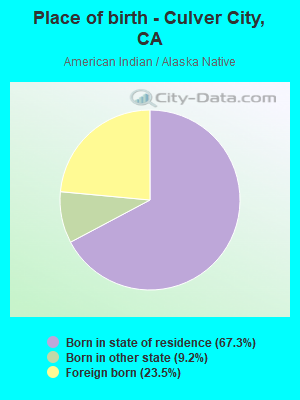
Place of birth - Born in state of residence (%) - American Indian and Alaska Native
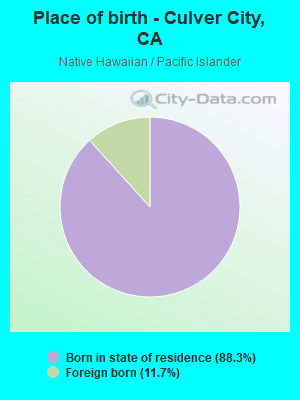
Place of birth - Born in state of residence (%) - Multirace
Place of birth - Born in state of residence (%) - Other Race
Place of birth - Born in other state (%)
Place of birth - Born in other state (%) - White
Place of birth - Born in other state (%) - Black or African American
Place of birth - Born in other state (%) - Asian
Place of birth - Born in other state (%) - Hispanic or Latino
Place of birth - Born in other state (%) - American Indian and Alaska Native
Place of birth - Born in other state (%) - Multirace
Place of birth - Born in other state (%) - Other Race
Place of birth - Native, outside of US (%)
Place of birth - Native, outside of US (%) - White
Place of birth - Native, outside of US (%) - Black or African American
Place of birth - Native, outside of US (%) - Asian
Place of birth - Native, outside of US (%) - Hispanic or Latino
Place of birth - Native, outside of US (%) - American Indian and Alaska Native
Place of birth - Native, outside of US (%) - Multirace
Place of birth - Native, outside of US (%) - Other Race
Place of birth - Foreign born (%)
Place of birth - Foreign born (%) - White
Place of birth - Foreign born (%) - Black or African American
Place of birth - Foreign born (%) - Asian
Place of birth - Foreign born (%) - Hispanic or Latino
Place of birth - Foreign born (%) - American Indian and Alaska Native
Place of birth - Foreign born (%) - Multirace
Place of birth - Foreign born (%) - Other Race
Residents speaking English at home (%)
Residents speaking English at home - Born in the United States (%)
Residents speaking English at home - Native, born elsewhere (%)
Residents speaking English at home - Foreign born (%)
Residents speaking Spanish at home (%)
Residents speaking Spanish at home - Born in the United States (%)
Residents speaking Spanish at home - Native, born elsewhere (%)
Residents speaking Spanish at home - Foreign born (%)
Residents speaking other language at home (%)
Residents speaking other language at home - Born in the United States (%)
Residents speaking other language at home - Native, born elsewhere (%)
Residents speaking other language at home - Foreign born (%)
Marital status - Never married (%)
Marital status - Now married (%)
Marital status - Separated (%)
Marital status - Widowed (%)
Marital status - Divorced (%)
Ancestries Reported - Arab (%)
Ancestries Reported - Czech (%)
Ancestries Reported - Danish (%)
Ancestries Reported - Dutch (%)
Ancestries Reported - English (%)
Ancestries Reported - French (%)
Ancestries Reported - French Canadian (%)
Ancestries Reported - German (%)
Ancestries Reported - Greek (%)
Ancestries Reported - Hungarian (%)
Ancestries Reported - Irish (%)
Ancestries Reported - Italian (%)
Ancestries Reported - Lithuanian (%)
Ancestries Reported - Norwegian (%)
Ancestries Reported - Polish (%)
Ancestries Reported - Portuguese (%)
Ancestries Reported - Russian (%)
Ancestries Reported - Scotch-Irish (%)
Ancestries Reported - Scottish (%)
Ancestries Reported - Slovak (%)
Ancestries Reported - Subsaharan African (%)
Ancestries Reported - Swedish (%)
Ancestries Reported - Swiss (%)
Ancestries Reported - Ukrainian (%)
Ancestries Reported - United States (%)
Ancestries Reported - Welsh (%)
Ancestries Reported - West Indian (%)
Ancestries Reported - Other (%)
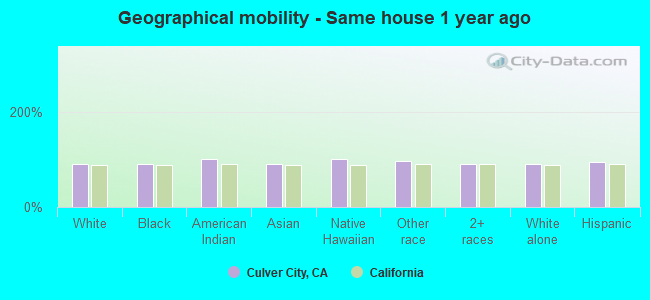
Geographical mobility - Same house 1 year ago (%)
Geographical mobility - Same house 1 year ago (%) - White
Geographical mobility - Same house 1 year ago (%) - Black or African American
Geographical mobility - Same house 1 year ago (%) - Asian
Geographical mobility - Same house 1 year ago (%) - Hispanic or Latino
Geographical mobility - Same house 1 year ago (%) - American Indian and Alaska Native
Geographical mobility - Same house 1 year ago (%) - Multirace
Geographical mobility - Same house 1 year ago (%) - Other Race
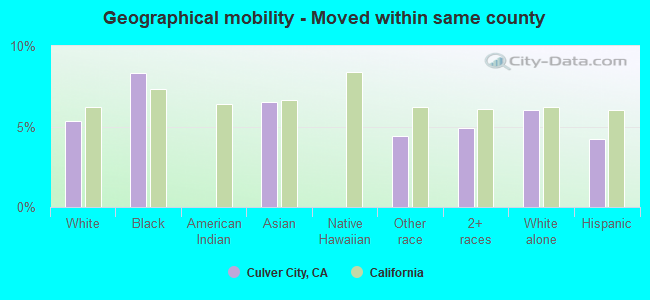
Geographical mobility - Moved within same county (%)
Geographical mobility - Moved within same county (%) - White
Geographical mobility - Moved within same county (%) - Black or African American
Geographical mobility - Moved within same county (%) - Asian
Geographical mobility - Moved within same county (%) - Hispanic or Latino
Geographical mobility - Moved within same county (%) - American Indian and Alaska Native
Geographical mobility - Moved within same county (%) - Multirace
Geographical mobility - Moved within same county (%) - Other Race
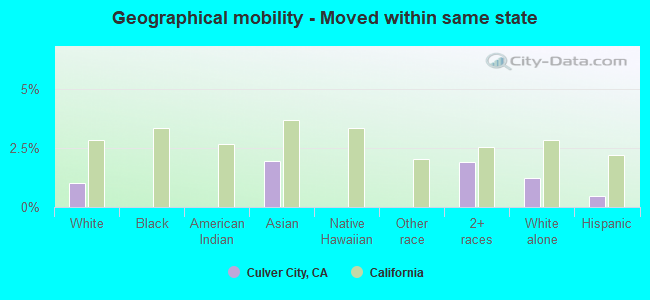
Geographical mobility - Moved from different county within same state (%)
Geographical mobility - Moved from different county within same state (%) - White
Geographical mobility - Moved from different county within same state (%) - Black or African American
Geographical mobility - Moved from different county within same state (%) - Asian
Geographical mobility - Moved from different county within same state (%) - Hispanic or Latino
Geographical mobility - Moved from different county within same state (%) - American Indian and Alaska Native
Geographical mobility - Moved from different county within same state (%) - Multirace
Geographical mobility - Moved from different county within same state (%) - Other Race
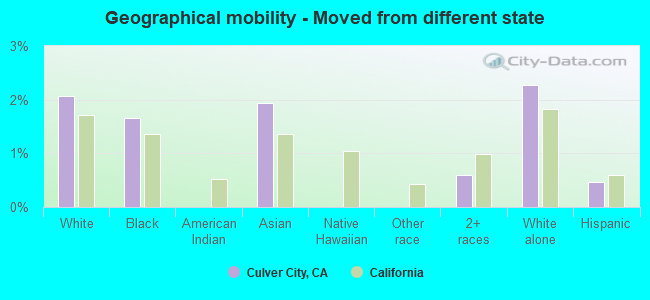
Geographical mobility - Moved from different state (%)
Geographical mobility - Moved from different state (%) - White
Geographical mobility - Moved from different state (%) - Black or African American
Geographical mobility - Moved from different state (%) - Asian
Geographical mobility - Moved from different state (%) - Hispanic or Latino
Geographical mobility - Moved from different state (%) - American Indian and Alaska Native
Geographical mobility - Moved from different state (%) - Multirace
Geographical mobility - Moved from different state (%) - Other Race
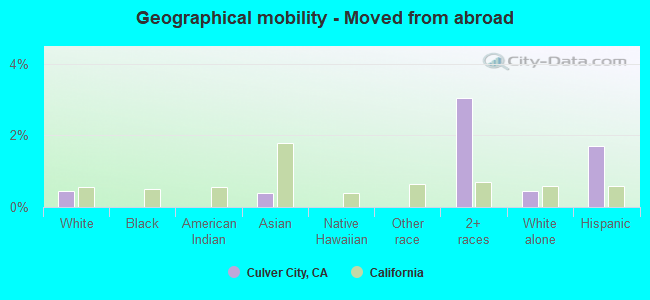
Geographical mobility - Moved from abroad (%)
Geographical mobility - Moved from abroad (%) - White
Geographical mobility - Moved from abroad (%) - Black or African American
Geographical mobility - Moved from abroad (%) - Asian
Geographical mobility - Moved from abroad (%) - Hispanic or Latino
Geographical mobility - Moved from abroad (%) - American Indian and Alaska Native
Geographical mobility - Moved from abroad (%) - Multirace
Geographical mobility - Moved from abroad (%) - Other Race
Place of birth for the foreign-born population - Ireland (%)
Place of birth for the foreign-born population - Denmark (%)
Place of birth for the foreign-born population - Norway (%)
Place of birth for the foreign-born population - Sweden (%)
Place of birth for the foreign-born population - United Kingdom (%)
Place of birth for the foreign-born population - England (%)
Place of birth for the foreign-born population - Scotland (%)
Place of birth for the foreign-born population - Other Northern Europe (%)
Place of birth for the foreign-born population - Austria (%)
Place of birth for the foreign-born population - Belgium (%)
Place of birth for the foreign-born population - France (%)
Place of birth for the foreign-born population - Germany (%)
Place of birth for the foreign-born population - Netherlands (%)
Place of birth for the foreign-born population - Switzerland (%)
Place of birth for the foreign-born population - Other Western Europe (%)
Place of birth for the foreign-born population - Greece (%)
Place of birth for the foreign-born population - Italy (%)
Place of birth for the foreign-born population - Portugal (%)
Place of birth for the foreign-born population - Spain (%)
Place of birth for the foreign-born population - Other Southern Europe (%)
Place of birth for the foreign-born population - Albania (%)
Place of birth for the foreign-born population - Belarus (%)
Place of birth for the foreign-born population - Bosnia and Herzegovina (%)
Place of birth for the foreign-born population - Bulgaria (%)
Place of birth for the foreign-born population - Croatia (%)
Place of birth for the foreign-born population - Czechoslovakia (%)
Place of birth for the foreign-born population - Hungary (%)
Place of birth for the foreign-born population - Latvia (%)
Place of birth for the foreign-born population - Lithuania (%)
Place of birth for the foreign-born population - North Macedonia (Macedonia) (%)
Place of birth for the foreign-born population - Moldova (%)
Place of birth for the foreign-born population - Poland (%)
Place of birth for the foreign-born population - Romania (%)
Place of birth for the foreign-born population - Russia (%)
Place of birth for the foreign-born population - Serbia (%)
Place of birth for the foreign-born population - Ukraine (%)
Place of birth for the foreign-born population - Other Eastern Europe (%)
Place of birth for the foreign-born population - China (%)
Place of birth for the foreign-born population - Hong Kong (%)
Place of birth for the foreign-born population - Taiwan (%)
Place of birth for the foreign-born population - Japan (%)
Place of birth for the foreign-born population - Korea (%)
Place of birth for the foreign-born population - Other Eastern Asia (%)
Place of birth for the foreign-born population - Afghanistan (%)
Place of birth for the foreign-born population - Bangladesh (%)
Place of birth for the foreign-born population - India (%)
Place of birth for the foreign-born population - Iran (%)
Place of birth for the foreign-born population - Kazakhstan (%)
Place of birth for the foreign-born population - Nepal (%)
Place of birth for the foreign-born population - Pakistan (%)
Place of birth for the foreign-born population - Sri Lanka (%)
Place of birth for the foreign-born population - Uzbekistan (%)
Place of birth for the foreign-born population - Other South Central Asia (%)
Place of birth for the foreign-born population - Burma (%)
Place of birth for the foreign-born population - Cambodia (%)
Place of birth for the foreign-born population - Indonesia (%)
Place of birth for the foreign-born population - Laos (%)
Place of birth for the foreign-born population - Malaysia (%)
Place of birth for the foreign-born population - Philippines (%)
Place of birth for the foreign-born population - Singapore (%)
Place of birth for the foreign-born population - Thailand (%)
Place of birth for the foreign-born population - Vietnam (%)
Place of birth for the foreign-born population - Other South Eastern Asia (%)
Place of birth for the foreign-born population - Armenia (%)
Place of birth for the foreign-born population - Iraq (%)
Place of birth for the foreign-born population - Israel (%)
Place of birth for the foreign-born population - Jordan (%)
Place of birth for the foreign-born population - Kuwait (%)
Place of birth for the foreign-born population - Lebanon (%)
Place of birth for the foreign-born population - Saudi Arabia (%)
Place of birth for the foreign-born population - Syria (%)
Place of birth for the foreign-born population - Turkey (%)
Place of birth for the foreign-born population - Yemen (%)
Place of birth for the foreign-born population - Other Western Asia (%)
Place of birth for the foreign-born population - Eritrea (%)
Place of birth for the foreign-born population - Ethiopia (%)
Place of birth for the foreign-born population - Kenya (%)
Place of birth for the foreign-born population - Somalia (%)
Place of birth for the foreign-born population - Uganda (%)
Place of birth for the foreign-born population - Zimbabwe (%)
Place of birth for the foreign-born population - Other Eastern Africa (%)
Place of birth for the foreign-born population - Cameroon (%)
Place of birth for the foreign-born population - Congo (%)
Place of birth for the foreign-born population - Democratic Republic of Congo (Zaire) (%)
Place of birth for the foreign-born population - Other Middle Africa (%)
Place of birth for the foreign-born population - Egypt (%)
Place of birth for the foreign-born population - Morocco (%)
Place of birth for the foreign-born population - Sudan (%)
Place of birth for the foreign-born population - Other Northern Africa (%)
Place of birth for the foreign-born population - South Africa (%)
Place of birth for the foreign-born population - Other Southern Africa (%)
Place of birth for the foreign-born population - Cabo Verde (%)
Place of birth for the foreign-born population - Ghana (%)
Place of birth for the foreign-born population - Liberia (%)
Place of birth for the foreign-born population - Nigeria (%)
Place of birth for the foreign-born population - Senegal (%)
Place of birth for the foreign-born population - Sierra Leone (%)
Place of birth for the foreign-born population - Other Western Africa (%)
Place of birth for the foreign-born population - Australia (%)
Place of birth for the foreign-born population - New Zealand (%)
Place of birth for the foreign-born population - Fiji (%)
Place of birth for the foreign-born population - Micronesia (%)
Place of birth for the foreign-born population - Bahamas (%)
Place of birth for the foreign-born population - Barbados (%)
Place of birth for the foreign-born population - Cuba (%)
Place of birth for the foreign-born population - Dominica (%)
Place of birth for the foreign-born population - Dominican Republic (%)
Place of birth for the foreign-born population - Grenada (%)
Place of birth for the foreign-born population - Haiti (%)
Place of birth for the foreign-born population - Jamaica (%)
Place of birth for the foreign-born population - St. Vincent and the Grenadines (%)
Place of birth for the foreign-born population - Trinidad and Tobago (%)
Place of birth for the foreign-born population - West Indies (%)
Place of birth for the foreign-born population - Other Caribbean (%)
Place of birth for the foreign-born population - Belize (%)
Place of birth for the foreign-born population - Costa Rica (%)
Place of birth for the foreign-born population - El Salvador (%)
Place of birth for the foreign-born population - Guatemala (%)
Place of birth for the foreign-born population - Honduras (%)
Place of birth for the foreign-born population - Mexico (%)
Place of birth for the foreign-born population - Nicaragua (%)
Place of birth for the foreign-born population - Panama (%)
Place of birth for the foreign-born population - Other Central America (%)
Place of birth for the foreign-born population - Argentina (%)
Place of birth for the foreign-born population - Bolivia (%)
Place of birth for the foreign-born population - Brazil (%)
Place of birth for the foreign-born population - Chile (%)
Place of birth for the foreign-born population - Colombia (%)
Place of birth for the foreign-born population - Ecuador (%)
Place of birth for the foreign-born population - Guyana (%)
Place of birth for the foreign-born population - Peru (%)
Place of birth for the foreign-born population - Uruguay (%)
Place of birth for the foreign-born population - Venezuela (%)
Place of birth for the foreign-born population - Other South America (%)
Place of birth for the foreign-born population - Canada (%)
Place of birth for the foreign-born population - Other Northern America (%)
Place of birth for the foreign-born population - Other (%)
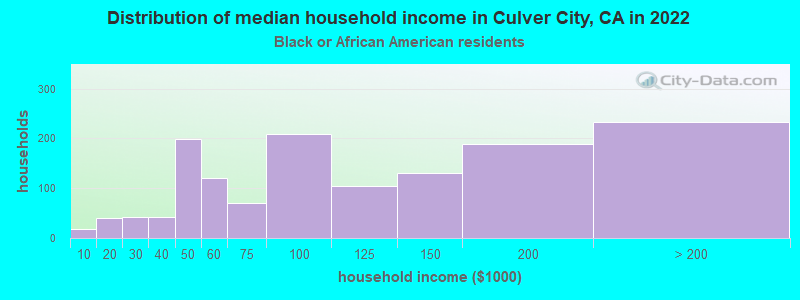
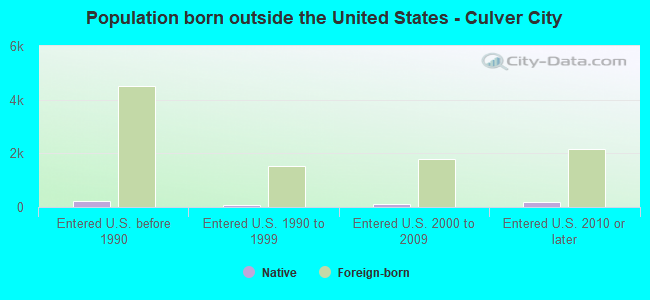
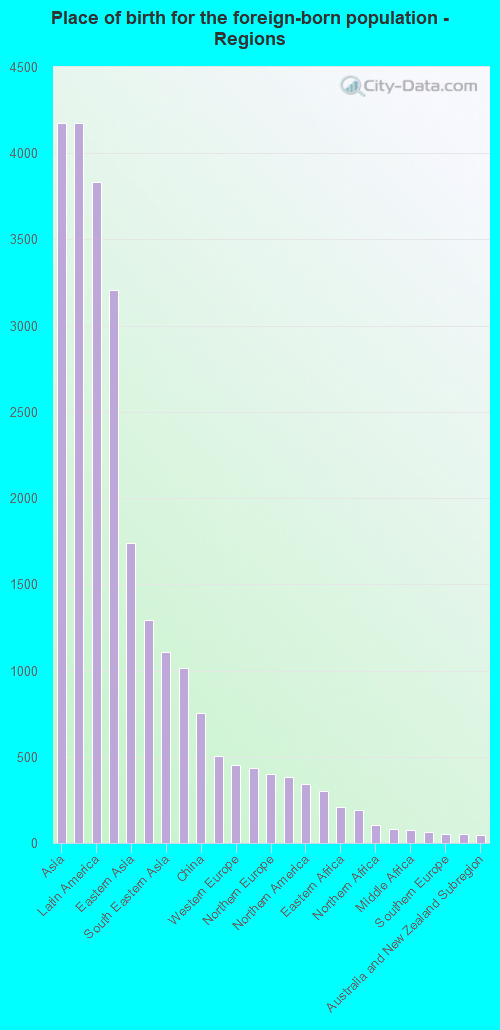
According to 2022 data, the most numerous races in Culver City, CA are Hispanic (9,454 residents), White alone (16,718 residents), and Asian alone (6,621 residents). 62.9% of Culver City residents speak English at home. 26.2% of Culver City, CA residents are foreign-born (10.5% born in Asia, 9.7% born in Latin America, 3.3% born in Europe), which is about the same as the foreign-born rate of 26.0% across the entire state of California.
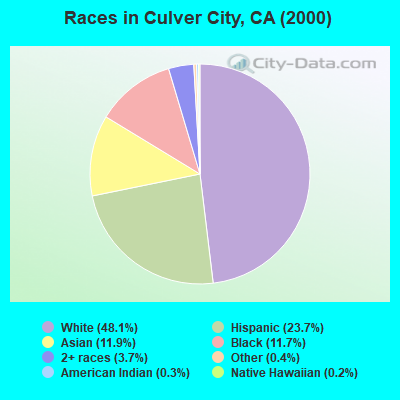
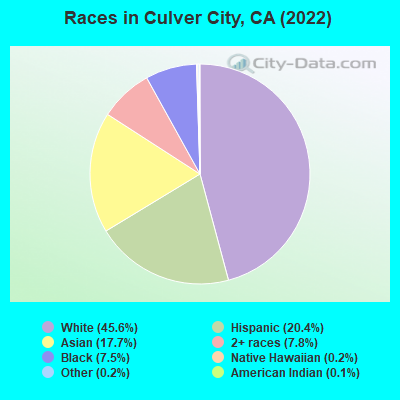
Race distribution in Culver City
2000 2022
18,675 48.1% White alone 9,199 23.7% Hispanic 4,631 11.9% Asian alone 4,536 11.7% Black alone 1,450 3.7% Two or more races 142 0.4% Other race alone 111 0.3% American Indian alone 72 0.2% Native Hawaiian and Other
16,718 42.8% White alone 9,454 24.2% Hispanic 6,621 16.9% Asian alone 3,243 8.3% Black alone 2,500 6.4% Two or more races 484 1.2% Other race alone 51 0.1% American Indian alone 33 0.08% Native Hawaiian and Other
2000 2022
15,816,790 46.7% White alone 10,966,556 32.4% Hispanic 3,648,860 10.8% Asian alone 2,181,926 6.4% Black alone 903,115 2.7% Two or more races 178,984 0.5% American Indian alone 103,736 0.3% Native Hawaiian and Other 71,681 0.2% Other race alone
15,732,184 40.3% Hispanic 13,160,426 33.7% White alone 5,957,867 15.3% Asian alone 2,025,218 5.2% Black alone 1,663,222 4.3% Two or more races 251,618 0.6% Other race alone 135,777 0.3% Native Hawaiian and Other 103,030 0.3% American Indian alone
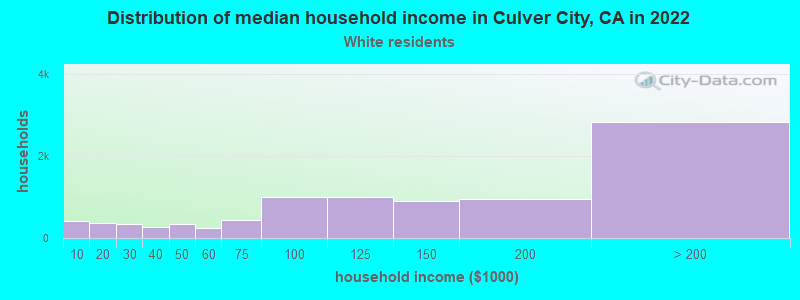
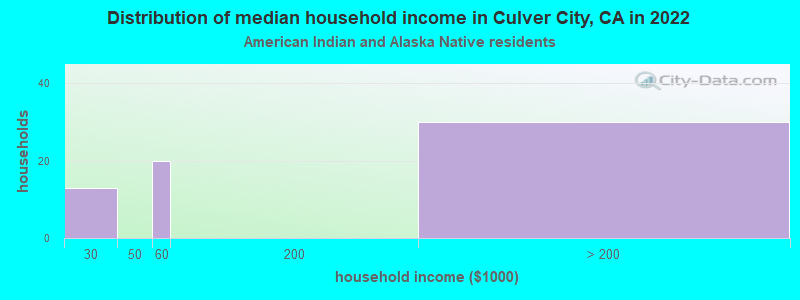
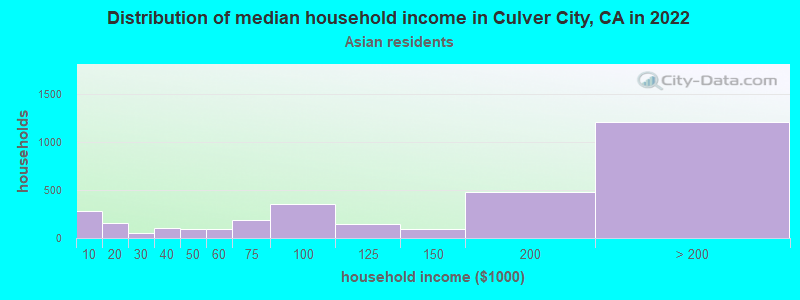
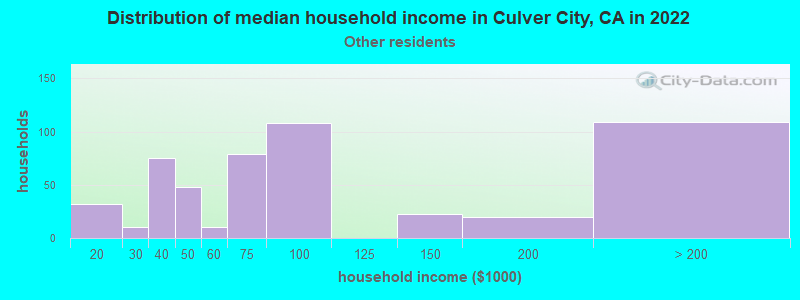
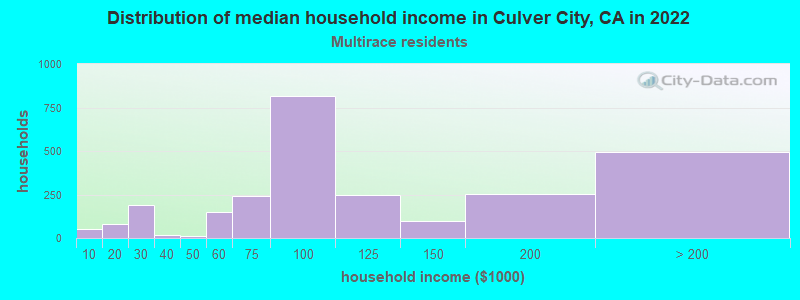
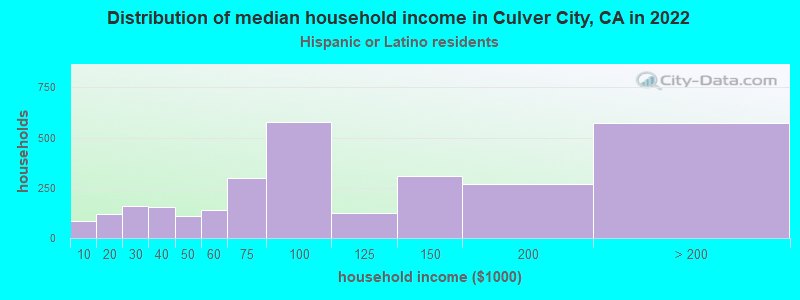
Income and house value in Culver City Median household income in 2022 $131,256 White non-Hispanic householders$119,926 Black householdersover $200,000 American Indian and Alaska Native householders$139,977 Asian householders$131,749 Native Hawaiian and other Pacific Islander householders$85,611 Some other race householders$126,525 Two or more races householders$96,839 Hispanic or Latino race householdersMedian 2022 house value over $1,000,000 White Non-Hispanic householdersover $1,000,000 Black or African American householdersover $1,000,000 American Indian or Alaska Native householders over $1,000,000 Asian householders$566,889 Native Hawaiian and other Pacific Islander householdersover $1,000,000 Some other race householdersover $1,000,000 Two or more races householdersover $1,000,000 Hispanic or Latino householders
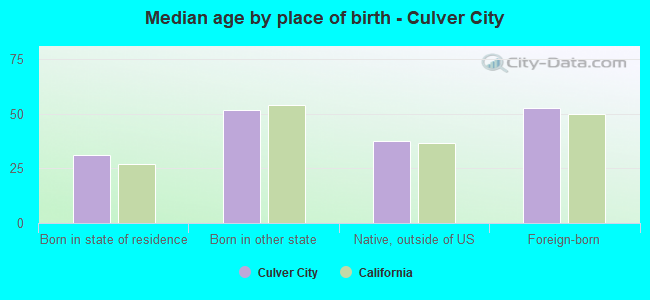
Median age by race in Culver City
45.9 Median age for White residents45.9 46.1 49.1 Median age for Black or African American residents53.0 48.3 63.5 Median age for American Indian / Alaska Native residents56.7 64.1 45.0 Median age for Asian residents39.9 46.9 45.0 Median age for Native Hawaiian / Pacific Islander residents45.3 Median age for Other race residents45.1 46.9 28.9 Median age for Two or more races residents22.3 34.9 45.6 Median age for White alone residents44.0 47.4 39.7 Median age for Hispanic or Latino residents41.2 38.1
Owner/renter occupied households by race in Culver City
House owners and renters - White residents 5,371 54.5% Owner occupied4,481 45.5% Renter occupiedHouse owners and renters - Black or African American residents 881 56.7% Owner occupied673 43.3% Renter occupiedHouse owners and renters - American Indian / Alaska Native residents 31 63.5% Owner occupied18 36.5% Renter occupiedHouse owners and renters - Asian residents 1,601 54.9% Owner occupied1,317 45.1% Renter occupiedHouse owners and renters - Other race residents 336 42.4% Owner occupied456 57.6% Renter occupiedHouse owners and renters - Two or more races residents 514 27.3% Owner occupied1,366 72.7% Renter occupiedHouse owners and renters - White alone residents 4,935 58.0% Owner occupied3,574 42.0% Renter occupiedHouse owners and renters - Hispanic or Latino residents 1,248 36.7% Owner occupied2,152 63.3% Renter occupied
Language usage in Culver City
English speakers - Total 62.9% of residents of Culver City speak English at home.
18.0% of residents speak Spanish at home 4,817 71.6% Speak English very well1,907 28.4% Speak English less than very well19.6% of residents speak other language at home 5,585 76.0% Speak English very well1,765 24.0% Speak English less than very well
English speakers - Born in the United States 89.1% of residents of Culver City speak English at home.
3.4% of residents speak Spanish at home 253 73.3% Speak English very well92 26.7% Speak English less than very well7.6% of residents speak other language at home 623 81.7% Speak English very well140 18.3% Speak English less than very well
English speakers - Native, born elsewhere 65.3% of residents of Culver City speak English at home.
12.4% of residents speak Spanish at home 39 52.0% Speak English very well36 48.0% Speak English less than very well21.6% of residents speak other language at home 104 79.4% Speak English very well27 20.6% Speak English less than very well
English speakers - Foreign-born 20.9% of residents of Culver City speak English at home.
32.5% of residents speak Spanish at home 1,767 54.8% Speak English very well1,457 45.2% Speak English less than very well48.9% of residents speak other language at home 3,452 71.1% Speak English very well1,401 28.9% Speak English less than very well
White (Caucasian) - Speak only English Native:
84.8% (13,669)Foreign-born:
30.4% (843)
White (Caucasian) - Speak another language Native:
14.7% (2,370)Foreign-born:
72.8% (2,018)
Black or African American - Speak only English Native:
88.9% (2,425)Foreign-born:
35.8% (201)
Black or African American - Speak another language Native:
12.7% (347)Foreign-born:
63.9% (358)
American Indian / Alaska Native - Speak another language Native:
52.5% (57)Foreign-born:
99.6% (42)
Asian - Speak only English Native:
62.8% (1,826)Foreign-born:
17.5% (635)
Asian - Speak another language Native:
37.5% (1,091)Foreign-born:
83.2% (3,025)
Other race - Speak only English Native:
41.6% (524)Foreign-born:
5.0% (68)
Other race - Speak another language Native:
59.9% (754)Foreign-born:
94.9% (1,301)
Two or more races - Speak only English Native:
64.4% (3,192)Foreign-born:
14.0% (372)
Two or more races - Speak another language Native:
34.8% (1,727)Foreign-born:
81.7% (2,171)
White alone - Speak only English Native:
90.5% (12,594)Foreign-born:
39.9% (857)
White alone - Speak another language Native:
9.7% (1,349)Foreign-born:
59.2% (1,272)
Hispanic or Latino - Speak only English Native:
45.5% (2,542)Foreign-born:
4.1% (133)
Hispanic or Latino - Speak another language Native:
54.9% (3,063)Foreign-born:
95.5% (3,107)
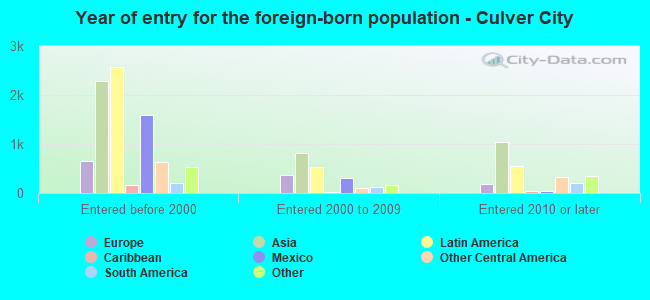
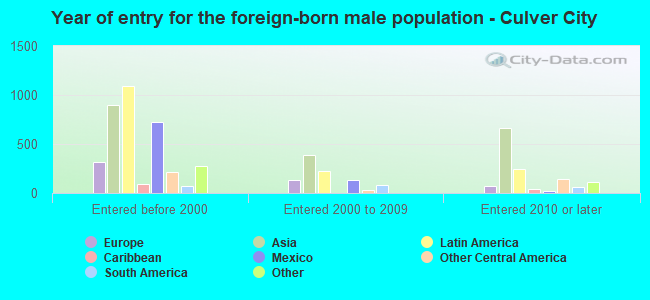
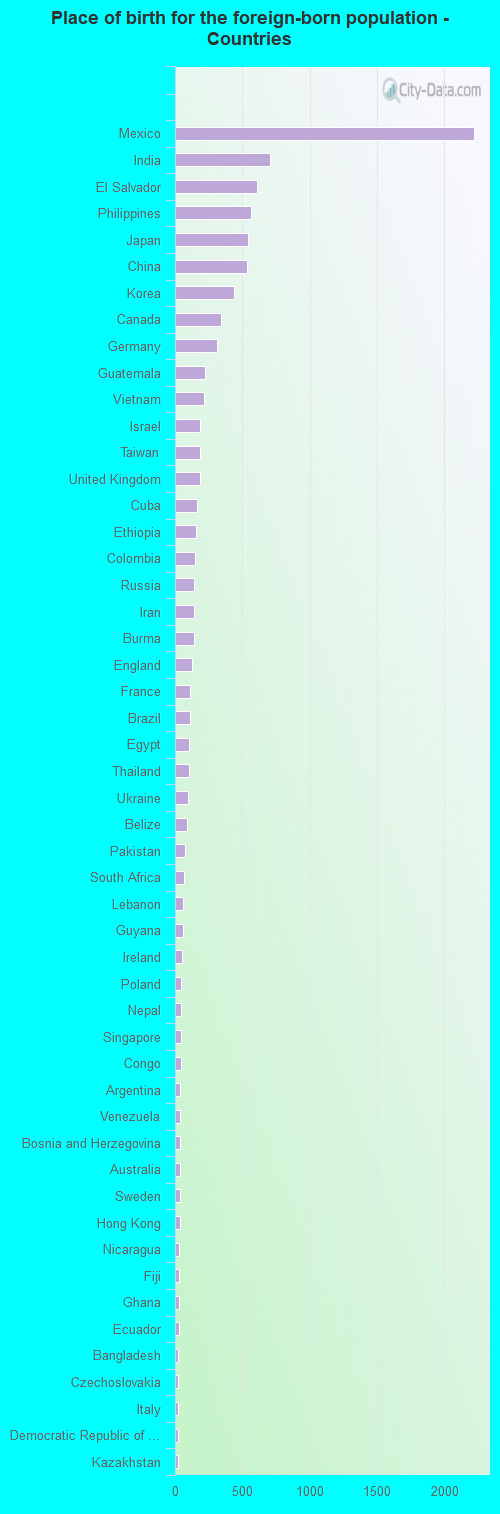
Foreign-born residents in Culver City 10,228 residents are foreign born (10.5% Asia , 9.7% Latin America , 3.3% Europe ).
This city:
26.2%California:
100.0%
Marital status for residents in Culver City Marital status - White (Caucasian) population 15 years and over
Males 32.9% Never married54.8% Now married1.7% Separated2.3% Widowed8.3% DivorcedFemales 35.0% Never married43.3% Now married0.8% Separated8.7% Widowed12.1% DivorcedWomen who gave birth in the past 12 months Now married:
84.6% (188)Unmarried:
15.4% (34)
Women who did not give birth in the past 12 months Now married:
41.2% (1,905)Unmarried:
58.8% (2,720)
Marital status - Black or African American population 15 years and over
Males 39.7% Never married48.0% Now married0.0% Separated4.4% Widowed7.8% DivorcedFemales 32.2% Never married38.8% Now married0.2% Separated10.9% Widowed18.0% DivorcedWomen who gave birth in the past 12 months Now married:
100.0% (6)Unmarried:
0.0% (0)
Women who did not give birth in the past 12 months Now married:
43.0% (301)Unmarried:
57.0% (399)
Marital status - American Indian / Alaska Native population 15 years and over
Males 0.0% Never married100.0% Now married0.0% Separated0.0% Widowed0.0% DivorcedFemales 0.0% Never married80.4% Now married0.0% Separated0.0% Widowed19.6% DivorcedWomen who gave birth in the past 12 months Now married:
100.0% (17)Unmarried:
0.0% (0)
Marital status - Asian population 15 years and over
Males 38.3% Never married55.2% Now married0.4% Separated2.6% Widowed3.6% DivorcedFemales 24.6% Never married53.0% Now married0.9% Separated10.7% Widowed10.8% DivorcedWomen who gave birth in the past 12 months Now married:
100.0% (31)Unmarried:
0.0% (0)
Women who did not give birth in the past 12 months Now married:
53.2% (887)Unmarried:
46.8% (781)
Marital status - Other race population 15 years and over
Males 44.5% Never married49.9% Now married2.6% Separated1.5% Widowed1.6% DivorcedFemales 37.9% Never married42.5% Now married0.3% Separated6.9% Widowed12.3% DivorcedWomen who gave birth in the past 12 months Now married:
26.1% (13)Unmarried:
73.9% (37)
Women who did not give birth in the past 12 months Now married:
35.2% (195)Unmarried:
64.8% (359)
Marital status - Two or more races population 15 years and over
Males 47.3% Never married42.8% Now married2.6% Separated0.0% Widowed7.3% DivorcedFemales 50.9% Never married35.7% Now married0.6% Separated2.5% Widowed10.4% DivorcedWomen who gave birth in the past 12 months Now married:
30.0% (35)Unmarried:
70.0% (82)
Women who did not give birth in the past 12 months Now married:
42.0% (797)Unmarried:
58.0% (1,100)
Marital status - White alone, not Hispanic / Latino population 15 years and over
Males 32.0% Never married56.2% Now married1.9% Separated1.9% Widowed8.0% DivorcedFemales 32.2% Never married45.0% Now married1.1% Separated8.7% Widowed13.1% DivorcedWomen who gave birth in the past 12 months Now married:
85.7% (184)Unmarried:
14.3% (31)
Women who did not give birth in the past 12 months Now married:
43.9% (1,663)Unmarried:
56.1% (2,123)
Marital status - Hispanic or Latino population 15 years and over
Males 36.4% Never married51.7% Now married2.2% Separated2.7% Widowed7.0% DivorcedFemales 42.0% Never married40.9% Now married0.1% Separated7.9% Widowed9.2% DivorcedWomen who gave birth in the past 12 months Now married:
41.0% (50)Unmarried:
59.0% (72)
Women who did not give birth in the past 12 months Now married:
36.4% (899)Unmarried:
63.6% (1,570)
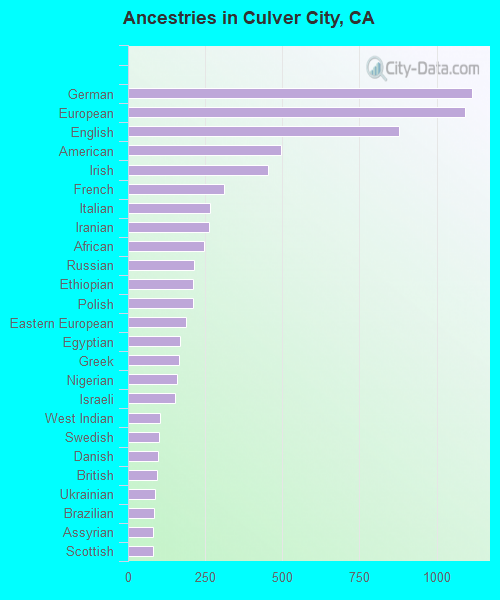
Ancestries in Culver City
1,107 5.1% European680 3.1% German637 2.9% American575 2.6% Irish477 2.2% English429 2.0% Italian337 1.5% Eastern European270 1.2% French255 1.2% British253 1.2% Ethiopian196 0.9% Russian172 0.8% Iranian149 0.7% Egyptian136 0.6% Polish136 0.6% Israeli125 0.6% Greek112 0.5% Canadian105 0.5% Ukrainian90 0.4% Lebanese90 0.4% Scottish85 0.4% Northern European80 0.4% Swedish78 0.4% Jamaican63 0.3% West Indian58 0.3% African49 0.2% Dutch47 0.2% Scandinavian45 0.2% Ghanaian44 0.2% Armenian44 0.2% Guyanese39 0.2% Scotch-Irish37 0.2% Portuguese27 0.1% French Canadian27 0.1% Danish27 0.1% Czech27 0.1% Belizean26 0.1% Welsh24 0.1% Hungarian19 0.09% Austrian19 0.09% Basque18 0.08% Turkish17 0.08% Finnish17 0.08% Cajun16 0.07% Australian14 0.06% Norwegian14 0.06% Slovak14 0.06% Cape Verdean14 0.06% Swiss13 0.06% Belgian13 0.06% Serbian11 0.05% Estonian10 0.05% Latvian9 0.04% Lithuanian9 0.04% Haitian6 0.03% Pennsylvania German6 0.03% Czechoslovakian
Geographical mobility in Culver City Same house 1 year ago 17,710 91.3% White (Caucasian)2,955 90.0% Black or African American154 100.0% American Indian / Alaska Native5,961 89.6% Asian44 100.0% Native Hawaiian / Pacific Islander2,603 96.5% Other race6,655 89.5% Two or more races15,131 90.2% White alone, not Hispanic / Latino8,729 93.6% Hispanic or LatinoMoved within same county 1,037 5.3% White / Caucasian274 8.3% Black or African American435 6.5% Asian119 4.4% Other race364 4.9% Two or more races1,006 6.0% White alone, not Hispanic / Latino396 4.2% Hispanic or LatinoMoved within same state 194 1.0% White / Caucasian129 1.9% Asian142 1.9% Two or more races208 1.2% White alone, not Hispanic / Latino41 0.4% Hispanic or LatinoMoved from different state 400 2.1% White / Caucasian54 1.7% Black or African American129 1.9% Asian45 0.6% Two or more races382 2.3% White alone, not Hispanic / Latino43 0.5% Hispanic or LatinoMoved from abroad 88 0.5% White26 0.4% Asian226 3.0% Two or more races76 0.5% White alone, not Hispanic / Latino158 1.7% Hispanic or Latino
Children Nativity (place of birth) in Culver City
Children under 6 years - Living with two parents Both parents native 1,131 99.0% Native11 1.0% Foreign-bornBoth parents foreign-born 230 100.0% NativeOne native, one foreign-born parent 445 100.0% NativeChildren under 6 years - Living with one parent Native parent 147 99.3% Native1 0.7% Foreign-bornForeign-born parent 89 64.7% Native49 35.3% Foreign-bornChildren 6 to 17 years - Living with two parents Both parents native 1,718 98.6% Native25 1.4% Foreign-bornBoth parents foreign-born 796 91.7% Native72 8.3% Foreign-bornOne native, one foreign-born parent 989 97.5% Native25 2.5% Foreign-bornChildren 6 to 17 years - Living with one parent Native parent 758 100.0% NativeForeign-born parent 317 52.5% Native287 47.5% Foreign-born
Place of birth for residents in Culver City
Grandparents responsible for own grandchildren in Culver City
Grandparents (30 to 59 years) White / Caucasian 7 100.0% Not responsible for grandchildrenOther race 9 100.0% Not responsible for grandchildrenTwo or more races 114 100.0% Responsible for grandchildrenHispanic or Latino 39 66.9% Responsible for grandchildren19 33.1% Not responsible for grandchildrenGrandparents (60 years and over) White / Caucasian 30 26.3% Responsible for grandchildren85 73.7% Not responsible for grandchildrenOther race 89 100.0% Not responsible for grandchildrenHispanic or Latino 17 9.1% Responsible for grandchildren168 90.9% Not responsible for grandchildren