Races in Cumming, Georgia (GA) Detailed Stats
Data:
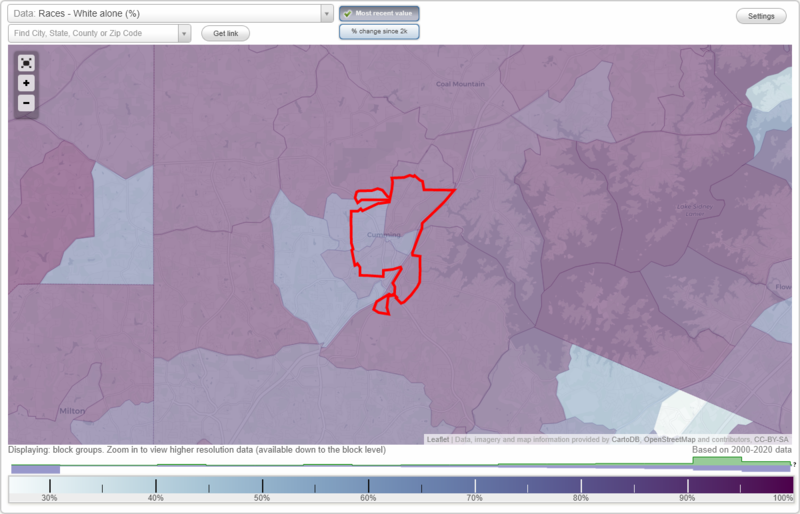
Races - White alone (%)
Races - White alone (% change since 2000)
Races - Black alone (%)
Races - Black alone (% change since 2000)
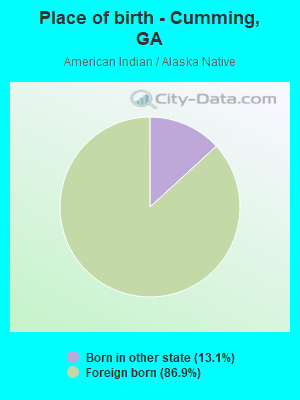
Races - American Indian alone (%)
Races - American Indian alone (% change since 2000)
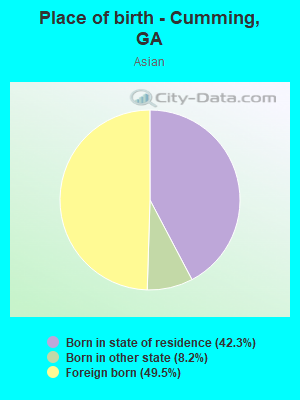
Races - Asian alone (%)
Races - Asian alone (% change since 2000)
Races - Hispanic (%)
Races - Hispanic (% change since 2000)
Races - Native Hawaiian and Other Pacific Islander alone (%)
Races - Native Hawaiian and Other Pacific Islander alone (% change since 2000)
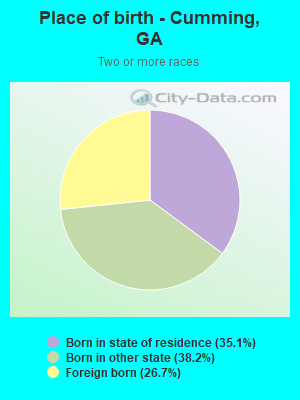
Races - Two or more races(%)
Races - Two or more races(% change since 2000)
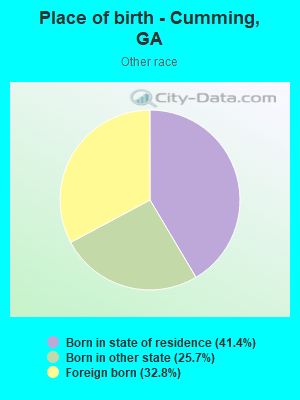
Races - Other race alone (%)
Races - Other race alone (% change since 2000)
Racial diversity
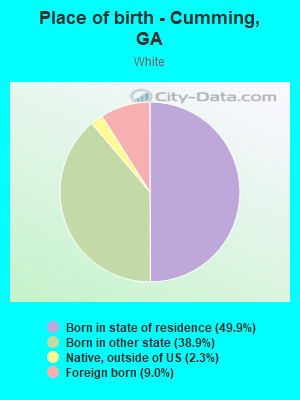
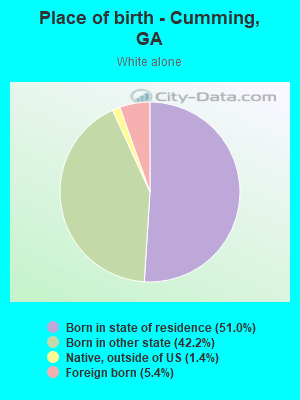
Place of birth - Born in state of residence (%)
Place of birth - Born in state of residence (%) - White
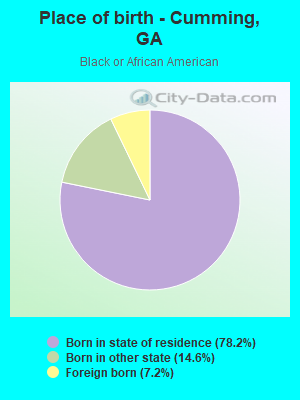
Place of birth - Born in state of residence (%) - Black or African American
Place of birth - Born in state of residence (%) - Asian
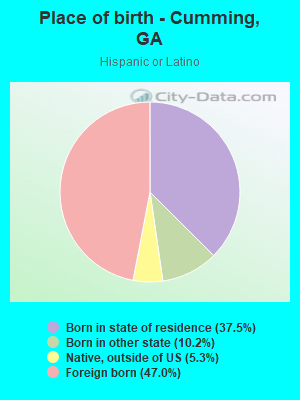
Place of birth - Born in state of residence (%) - Hispanic or Latino
Place of birth - Born in state of residence (%) - American Indian and Alaska Native
Place of birth - Born in state of residence (%) - Multirace
Place of birth - Born in state of residence (%) - Other Race
Place of birth - Born in other state (%)
Place of birth - Born in other state (%) - White
Place of birth - Born in other state (%) - Black or African American
Place of birth - Born in other state (%) - Asian
Place of birth - Born in other state (%) - Hispanic or Latino
Place of birth - Born in other state (%) - American Indian and Alaska Native
Place of birth - Born in other state (%) - Multirace
Place of birth - Born in other state (%) - Other Race
Place of birth - Native, outside of US (%)
Place of birth - Native, outside of US (%) - White
Place of birth - Native, outside of US (%) - Black or African American
Place of birth - Native, outside of US (%) - Asian
Place of birth - Native, outside of US (%) - Hispanic or Latino
Place of birth - Native, outside of US (%) - American Indian and Alaska Native
Place of birth - Native, outside of US (%) - Multirace
Place of birth - Native, outside of US (%) - Other Race
Place of birth - Foreign born (%)
Place of birth - Foreign born (%) - White
Place of birth - Foreign born (%) - Black or African American
Place of birth - Foreign born (%) - Asian
Place of birth - Foreign born (%) - Hispanic or Latino
Place of birth - Foreign born (%) - American Indian and Alaska Native
Place of birth - Foreign born (%) - Multirace
Place of birth - Foreign born (%) - Other Race
Residents speaking English at home (%)
Residents speaking English at home - Born in the United States (%)
Residents speaking English at home - Native, born elsewhere (%)
Residents speaking English at home - Foreign born (%)
Residents speaking Spanish at home (%)
Residents speaking Spanish at home - Born in the United States (%)
Residents speaking Spanish at home - Native, born elsewhere (%)
Residents speaking Spanish at home - Foreign born (%)
Residents speaking other language at home (%)
Residents speaking other language at home - Born in the United States (%)
Residents speaking other language at home - Native, born elsewhere (%)
Residents speaking other language at home - Foreign born (%)
Marital status - Never married (%)
Marital status - Now married (%)
Marital status - Separated (%)
Marital status - Widowed (%)
Marital status - Divorced (%)
Ancestries Reported - Arab (%)
Ancestries Reported - Czech (%)
Ancestries Reported - Danish (%)
Ancestries Reported - Dutch (%)
Ancestries Reported - English (%)
Ancestries Reported - French (%)
Ancestries Reported - French Canadian (%)
Ancestries Reported - German (%)
Ancestries Reported - Greek (%)
Ancestries Reported - Hungarian (%)
Ancestries Reported - Irish (%)
Ancestries Reported - Italian (%)
Ancestries Reported - Lithuanian (%)
Ancestries Reported - Norwegian (%)
Ancestries Reported - Polish (%)
Ancestries Reported - Portuguese (%)
Ancestries Reported - Russian (%)
Ancestries Reported - Scotch-Irish (%)
Ancestries Reported - Scottish (%)
Ancestries Reported - Slovak (%)
Ancestries Reported - Subsaharan African (%)
Ancestries Reported - Swedish (%)
Ancestries Reported - Swiss (%)
Ancestries Reported - Ukrainian (%)
Ancestries Reported - United States (%)
Ancestries Reported - Welsh (%)
Ancestries Reported - West Indian (%)
Ancestries Reported - Other (%)
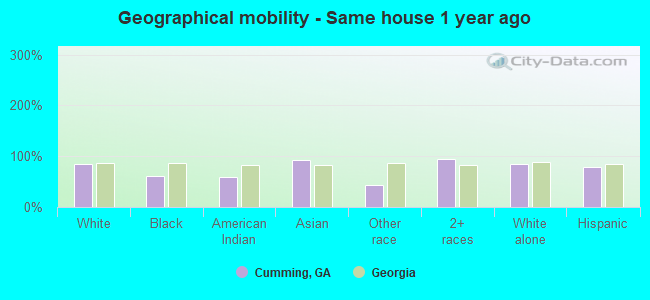
Geographical mobility - Same house 1 year ago (%)
Geographical mobility - Same house 1 year ago (%) - White
Geographical mobility - Same house 1 year ago (%) - Black or African American
Geographical mobility - Same house 1 year ago (%) - Asian
Geographical mobility - Same house 1 year ago (%) - Hispanic or Latino
Geographical mobility - Same house 1 year ago (%) - American Indian and Alaska Native
Geographical mobility - Same house 1 year ago (%) - Multirace
Geographical mobility - Same house 1 year ago (%) - Other Race
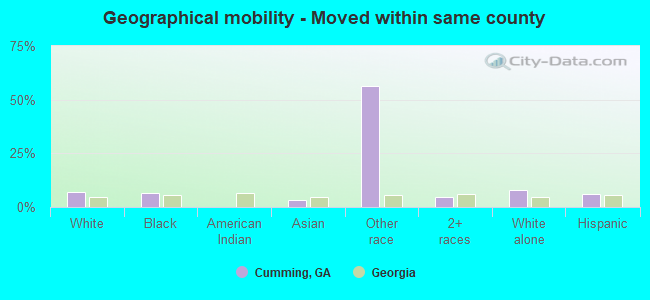
Geographical mobility - Moved within same county (%)
Geographical mobility - Moved within same county (%) - White
Geographical mobility - Moved within same county (%) - Black or African American
Geographical mobility - Moved within same county (%) - Asian
Geographical mobility - Moved within same county (%) - Hispanic or Latino
Geographical mobility - Moved within same county (%) - American Indian and Alaska Native
Geographical mobility - Moved within same county (%) - Multirace
Geographical mobility - Moved within same county (%) - Other Race
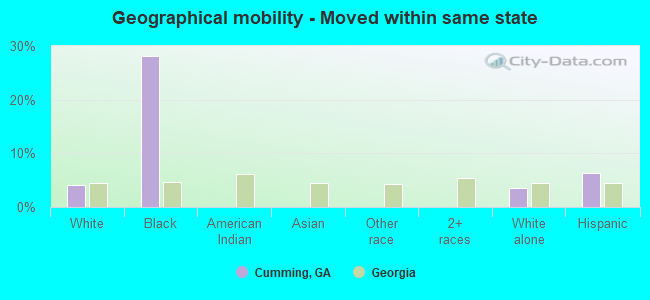
Geographical mobility - Moved from different county within same state (%)
Geographical mobility - Moved from different county within same state (%) - White
Geographical mobility - Moved from different county within same state (%) - Black or African American
Geographical mobility - Moved from different county within same state (%) - Asian
Geographical mobility - Moved from different county within same state (%) - Hispanic or Latino
Geographical mobility - Moved from different county within same state (%) - American Indian and Alaska Native
Geographical mobility - Moved from different county within same state (%) - Multirace
Geographical mobility - Moved from different county within same state (%) - Other Race
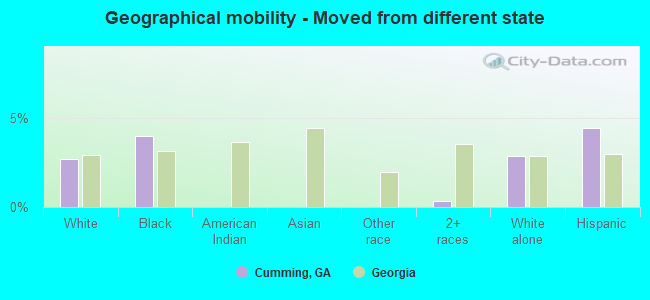
Geographical mobility - Moved from different state (%)
Geographical mobility - Moved from different state (%) - White
Geographical mobility - Moved from different state (%) - Black or African American
Geographical mobility - Moved from different state (%) - Asian
Geographical mobility - Moved from different state (%) - Hispanic or Latino
Geographical mobility - Moved from different state (%) - American Indian and Alaska Native
Geographical mobility - Moved from different state (%) - Multirace
Geographical mobility - Moved from different state (%) - Other Race
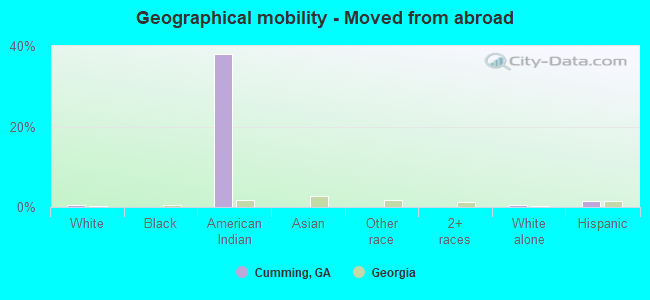
Geographical mobility - Moved from abroad (%)
Geographical mobility - Moved from abroad (%) - White
Geographical mobility - Moved from abroad (%) - Black or African American
Geographical mobility - Moved from abroad (%) - Asian
Geographical mobility - Moved from abroad (%) - Hispanic or Latino
Geographical mobility - Moved from abroad (%) - American Indian and Alaska Native
Geographical mobility - Moved from abroad (%) - Multirace
Geographical mobility - Moved from abroad (%) - Other Race
Place of birth for the foreign-born population - Ireland (%)
Place of birth for the foreign-born population - Denmark (%)
Place of birth for the foreign-born population - Norway (%)
Place of birth for the foreign-born population - Sweden (%)
Place of birth for the foreign-born population - United Kingdom (%)
Place of birth for the foreign-born population - England (%)
Place of birth for the foreign-born population - Scotland (%)
Place of birth for the foreign-born population - Other Northern Europe (%)
Place of birth for the foreign-born population - Austria (%)
Place of birth for the foreign-born population - Belgium (%)
Place of birth for the foreign-born population - France (%)
Place of birth for the foreign-born population - Germany (%)
Place of birth for the foreign-born population - Netherlands (%)
Place of birth for the foreign-born population - Switzerland (%)
Place of birth for the foreign-born population - Other Western Europe (%)
Place of birth for the foreign-born population - Greece (%)
Place of birth for the foreign-born population - Italy (%)
Place of birth for the foreign-born population - Portugal (%)
Place of birth for the foreign-born population - Spain (%)
Place of birth for the foreign-born population - Other Southern Europe (%)
Place of birth for the foreign-born population - Albania (%)
Place of birth for the foreign-born population - Belarus (%)
Place of birth for the foreign-born population - Bosnia and Herzegovina (%)
Place of birth for the foreign-born population - Bulgaria (%)
Place of birth for the foreign-born population - Croatia (%)
Place of birth for the foreign-born population - Czechoslovakia (%)
Place of birth for the foreign-born population - Hungary (%)
Place of birth for the foreign-born population - Latvia (%)
Place of birth for the foreign-born population - Lithuania (%)
Place of birth for the foreign-born population - North Macedonia (Macedonia) (%)
Place of birth for the foreign-born population - Moldova (%)
Place of birth for the foreign-born population - Poland (%)
Place of birth for the foreign-born population - Romania (%)
Place of birth for the foreign-born population - Russia (%)
Place of birth for the foreign-born population - Serbia (%)
Place of birth for the foreign-born population - Ukraine (%)
Place of birth for the foreign-born population - Other Eastern Europe (%)
Place of birth for the foreign-born population - China (%)
Place of birth for the foreign-born population - Hong Kong (%)
Place of birth for the foreign-born population - Taiwan (%)
Place of birth for the foreign-born population - Japan (%)
Place of birth for the foreign-born population - Korea (%)
Place of birth for the foreign-born population - Other Eastern Asia (%)
Place of birth for the foreign-born population - Afghanistan (%)
Place of birth for the foreign-born population - Bangladesh (%)
Place of birth for the foreign-born population - India (%)
Place of birth for the foreign-born population - Iran (%)
Place of birth for the foreign-born population - Kazakhstan (%)
Place of birth for the foreign-born population - Nepal (%)
Place of birth for the foreign-born population - Pakistan (%)
Place of birth for the foreign-born population - Sri Lanka (%)
Place of birth for the foreign-born population - Uzbekistan (%)
Place of birth for the foreign-born population - Other South Central Asia (%)
Place of birth for the foreign-born population - Burma (%)
Place of birth for the foreign-born population - Cambodia (%)
Place of birth for the foreign-born population - Indonesia (%)
Place of birth for the foreign-born population - Laos (%)
Place of birth for the foreign-born population - Malaysia (%)
Place of birth for the foreign-born population - Philippines (%)
Place of birth for the foreign-born population - Singapore (%)
Place of birth for the foreign-born population - Thailand (%)
Place of birth for the foreign-born population - Vietnam (%)
Place of birth for the foreign-born population - Other South Eastern Asia (%)
Place of birth for the foreign-born population - Armenia (%)
Place of birth for the foreign-born population - Iraq (%)
Place of birth for the foreign-born population - Israel (%)
Place of birth for the foreign-born population - Jordan (%)
Place of birth for the foreign-born population - Kuwait (%)
Place of birth for the foreign-born population - Lebanon (%)
Place of birth for the foreign-born population - Saudi Arabia (%)
Place of birth for the foreign-born population - Syria (%)
Place of birth for the foreign-born population - Turkey (%)
Place of birth for the foreign-born population - Yemen (%)
Place of birth for the foreign-born population - Other Western Asia (%)
Place of birth for the foreign-born population - Eritrea (%)
Place of birth for the foreign-born population - Ethiopia (%)
Place of birth for the foreign-born population - Kenya (%)
Place of birth for the foreign-born population - Somalia (%)
Place of birth for the foreign-born population - Uganda (%)
Place of birth for the foreign-born population - Zimbabwe (%)
Place of birth for the foreign-born population - Other Eastern Africa (%)
Place of birth for the foreign-born population - Cameroon (%)
Place of birth for the foreign-born population - Congo (%)
Place of birth for the foreign-born population - Democratic Republic of Congo (Zaire) (%)
Place of birth for the foreign-born population - Other Middle Africa (%)
Place of birth for the foreign-born population - Egypt (%)
Place of birth for the foreign-born population - Morocco (%)
Place of birth for the foreign-born population - Sudan (%)
Place of birth for the foreign-born population - Other Northern Africa (%)
Place of birth for the foreign-born population - South Africa (%)
Place of birth for the foreign-born population - Other Southern Africa (%)
Place of birth for the foreign-born population - Cabo Verde (%)
Place of birth for the foreign-born population - Ghana (%)
Place of birth for the foreign-born population - Liberia (%)
Place of birth for the foreign-born population - Nigeria (%)
Place of birth for the foreign-born population - Senegal (%)
Place of birth for the foreign-born population - Sierra Leone (%)
Place of birth for the foreign-born population - Other Western Africa (%)
Place of birth for the foreign-born population - Australia (%)
Place of birth for the foreign-born population - New Zealand (%)
Place of birth for the foreign-born population - Fiji (%)
Place of birth for the foreign-born population - Micronesia (%)
Place of birth for the foreign-born population - Bahamas (%)
Place of birth for the foreign-born population - Barbados (%)
Place of birth for the foreign-born population - Cuba (%)
Place of birth for the foreign-born population - Dominica (%)
Place of birth for the foreign-born population - Dominican Republic (%)
Place of birth for the foreign-born population - Grenada (%)
Place of birth for the foreign-born population - Haiti (%)
Place of birth for the foreign-born population - Jamaica (%)
Place of birth for the foreign-born population - St. Vincent and the Grenadines (%)
Place of birth for the foreign-born population - Trinidad and Tobago (%)
Place of birth for the foreign-born population - West Indies (%)
Place of birth for the foreign-born population - Other Caribbean (%)
Place of birth for the foreign-born population - Belize (%)
Place of birth for the foreign-born population - Costa Rica (%)
Place of birth for the foreign-born population - El Salvador (%)
Place of birth for the foreign-born population - Guatemala (%)
Place of birth for the foreign-born population - Honduras (%)
Place of birth for the foreign-born population - Mexico (%)
Place of birth for the foreign-born population - Nicaragua (%)
Place of birth for the foreign-born population - Panama (%)
Place of birth for the foreign-born population - Other Central America (%)
Place of birth for the foreign-born population - Argentina (%)
Place of birth for the foreign-born population - Bolivia (%)
Place of birth for the foreign-born population - Brazil (%)
Place of birth for the foreign-born population - Chile (%)
Place of birth for the foreign-born population - Colombia (%)
Place of birth for the foreign-born population - Ecuador (%)
Place of birth for the foreign-born population - Guyana (%)
Place of birth for the foreign-born population - Peru (%)
Place of birth for the foreign-born population - Uruguay (%)
Place of birth for the foreign-born population - Venezuela (%)
Place of birth for the foreign-born population - Other South America (%)
Place of birth for the foreign-born population - Canada (%)
Place of birth for the foreign-born population - Other Northern America (%)
Place of birth for the foreign-born population - Other (%)
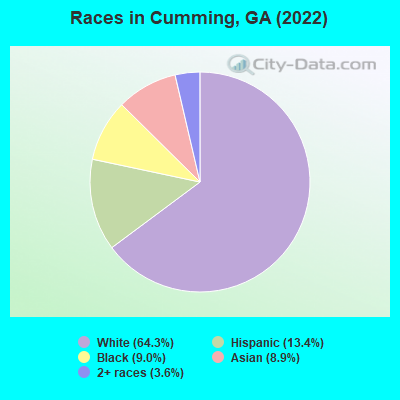
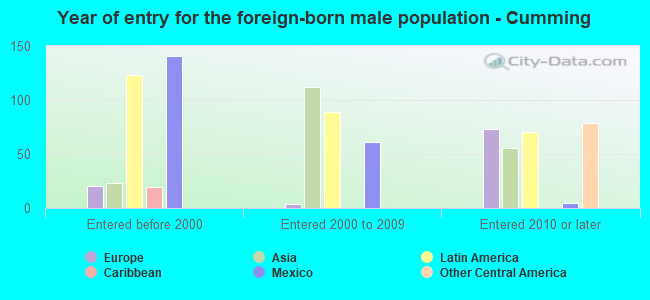
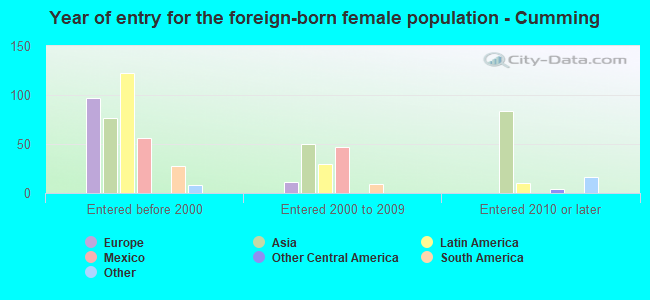
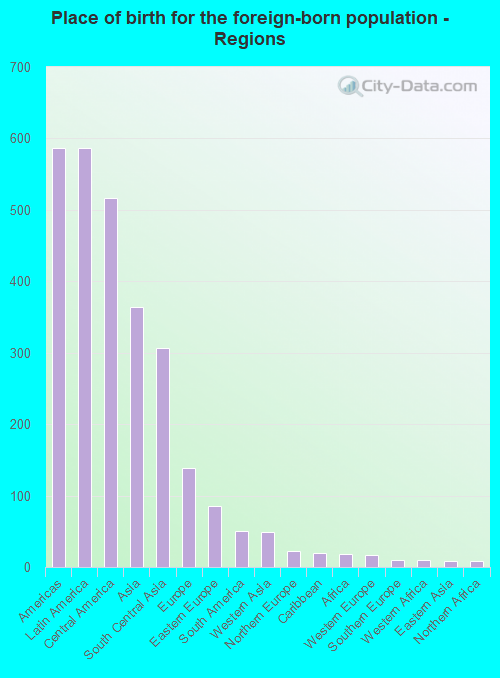
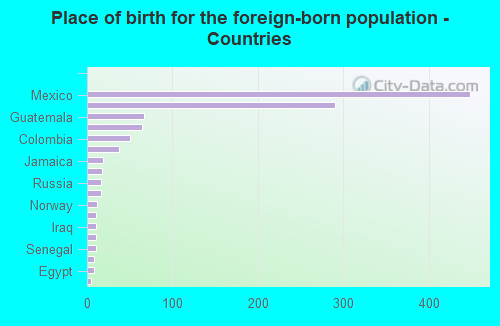
According to 2022 data, the most numerous races in Cumming, GA are White alone (5,002 residents), Black alone (698 residents), and Hispanic (1,043 residents). 75.9% of Cumming residents speak English at home. 14.2% of Cumming, GA residents are foreign-born (7.6% born in Latin America, 4.7% born in Asia, 1.8% born in Europe), which is 29.8% greater than the foreign-born rate of 10.0% across the entire state of Georgia.
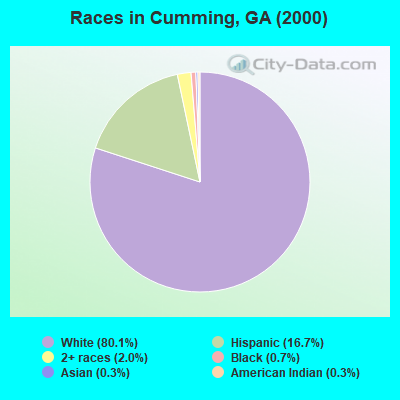
Race distribution in Cumming
2000 2022
5,128,661 62.6% White alone 2,331,465 28.5% Black alone 435,227 5.3% Hispanic 171,513 2.1% Asian alone 87,364 1.1% Two or more races 17,670 0.2% American Indian alone 11,275 0.1% Other race alone 3,278 0.04% Native Hawaiian and Other
5,415,657 49.6% White alone 3,349,240 30.7% Black alone 1,132,604 10.4% Hispanic 479,156 4.4% Asian alone 462,923 4.2% Two or more races 54,416 0.5% Other race alone 11,923 0.1% American Indian alone 6,957 0.06% Native Hawaiian and Other
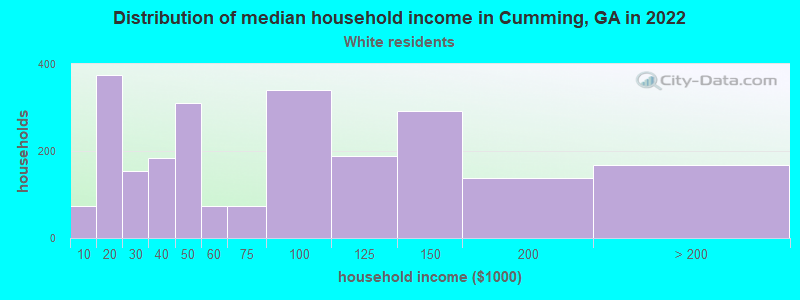
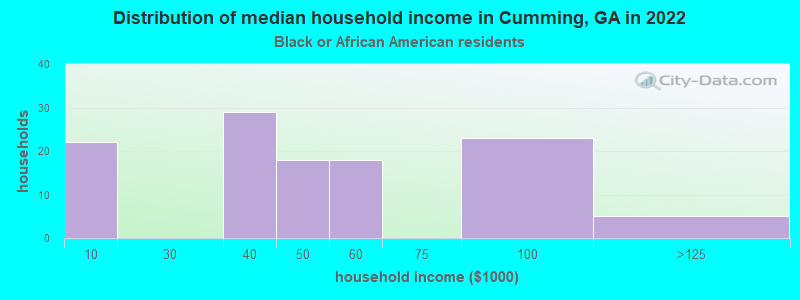
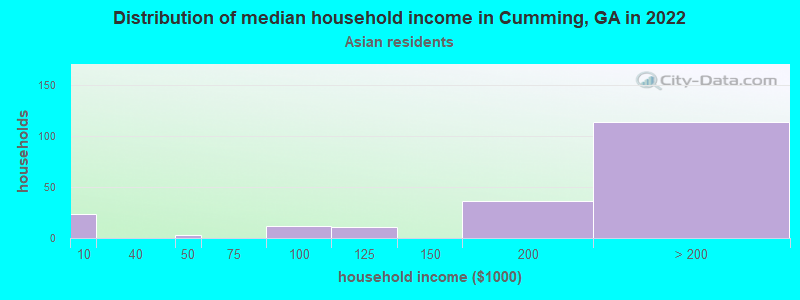
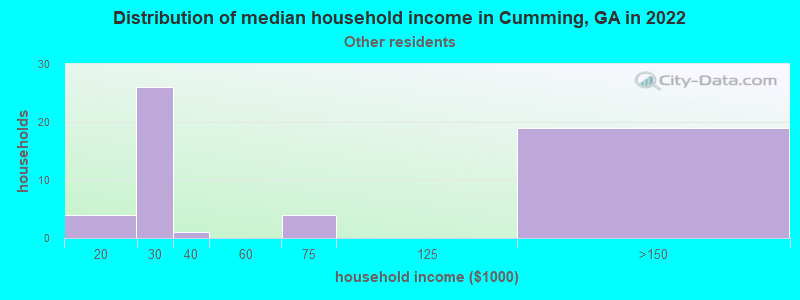
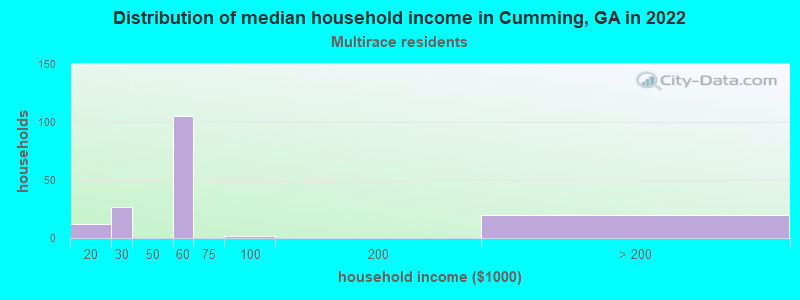
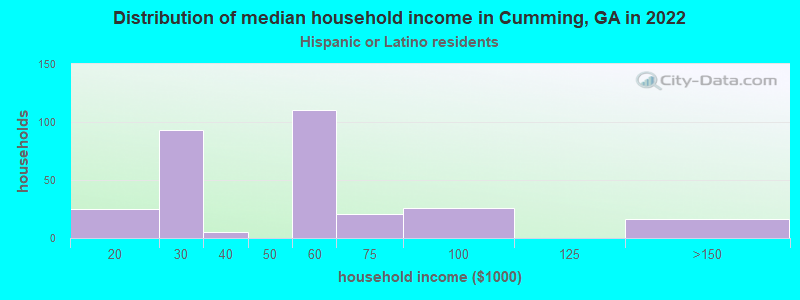
Income and house value in Cumming Median household income in 2022 $82,503 White non-Hispanic householders$43,370 Black householdersover $200,000 Asian householders$49,971 Two or more races householders$61,838 Hispanic or Latino race householdersMedian 2022 house value $400,442 White Non-Hispanic householders $430,369 Asian householders$364,159 Some other race householders$364,159 Hispanic or Latino householders
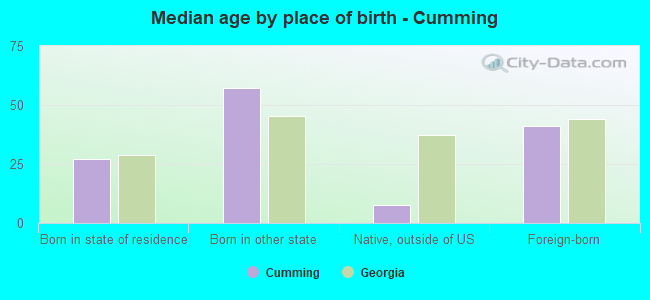
Median age by race in Cumming
47.2 Median age for White residents36.9 55.4 50.1 Median age for Black or African American residents40.8 49.1 12.7 Median age for American Indian / Alaska Native residents16.6 -657,856,093.3 33.8 Median age for Asian residents3.3 36.2 -666,666,666.0 Median age for Native Hawaiian / Pacific Islander residents-666,666,666.0 -666,666,666.0 29.2 Median age for Other race residents17.1 21.5 28.4 Median age for Two or more races residents32.3 24.8 49.8 Median age for White alone residents40.3 56.7 30.6 Median age for Hispanic or Latino residents31.9 31.9
Owner/renter occupied households by race in Cumming
House owners and renters - White residents 1,089 51.5% Owner occupied1,028 48.5% Renter occupiedHouse owners and renters - Black or African American residents 7 4.6% Owner occupied135 95.4% Renter occupiedHouse owners and renters - American Indian / Alaska Native residents 5 100.0% Renter occupiedHouse owners and renters - Asian residents 176 84.5% Owner occupied32 15.5% Renter occupiedHouse owners and renters - Other race residents 3 8.8% Owner occupied31 91.2% Renter occupiedHouse owners and renters - Two or more races residents 18 17.3% Owner occupied84 82.7% Renter occupiedHouse owners and renters - White alone residents 1,076 52.2% Owner occupied985 47.8% Renter occupiedHouse owners and renters - Hispanic or Latino residents 24 13.3% Owner occupied157 86.7% Renter occupied
Language usage in Cumming
English speakers - Total 75.9% of residents of Cumming speak English at home.
11.0% of residents speak Spanish at home 614 75.6% Speak English very well198 24.4% Speak English less than very well10.0% of residents speak other language at home 608 81.9% Speak English very well134 18.1% Speak English less than very well
English speakers - Born in the United States 91.7% of residents of Cumming speak English at home.
3.8% of residents speak Spanish at home 81 81.8% Speak English very well18 18.2% Speak English less than very well4.8% of residents speak other language at home 101 81.5% Speak English very well23 18.5% Speak English less than very well
English speakers - Native, born elsewhere 68.4% of residents of Cumming speak English at home.
17.5% of residents speak Spanish at home 20 100.0% Speak English less than very well16.7% of residents speak other language at home 19 100.0% Speak English very well
English speakers - Foreign-born 5.8% of residents of Cumming speak English at home.
34.4% of residents speak Spanish at home 216 52.8% Speak English very well193 47.2% Speak English less than very well46.0% of residents speak other language at home 433 79.2% Speak English very well114 20.8% Speak English less than very well
White (Caucasian) - Speak only English Native:
93.9% (4,494)Foreign-born:
8.8% (42)
White (Caucasian) - Speak another language Native:
5.6% (266)Foreign-born:
85.3% (412)
Black or African American - Speak only English Native:
95.5% (531)Foreign-born:
64.0% (21)
Black or African American - Speak another language Native:
4.7% (26)Foreign-born:
35.2% (12)
American Indian / Alaska Native - Speak only English Native:
95.0% (8)Foreign-born:
46.5% (23)
Asian - Speak another language Native:
62.6% (74)Foreign-born:
100.0% (330)
Other race - Speak another language Native:
68.7% (59)Foreign-born:
100.0% (36)
Two or more races - Speak another language Native:
27.2% (150)Foreign-born:
92.9% (188)
White alone - Speak only English Native:
96.3% (4,453)Foreign-born:
15.7% (42)
White alone - Speak another language Native:
3.6% (167)Foreign-born:
84.7% (229)
Hispanic or Latino - Speak only English Native:
17.7% (93)Foreign-born:
4.7% (21)
Hispanic or Latino - Speak another language Native:
61.5% (323)Foreign-born:
92.6% (418)
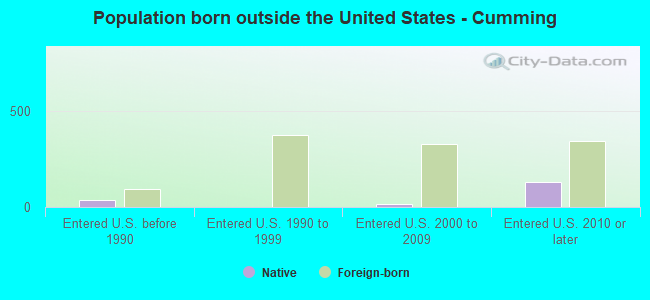
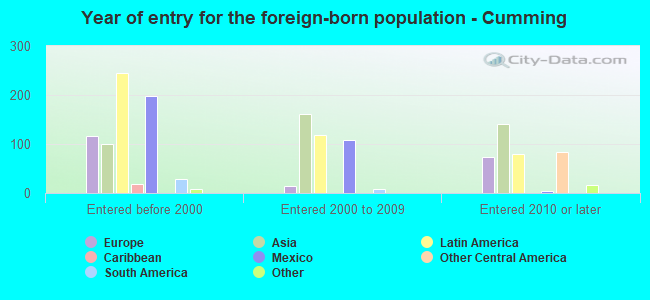
Foreign-born residents in Cumming 1,108 residents are foreign born (7.6% Latin America , 4.7% Asia , 1.8% Europe ).
This city:
14.2%Georgia:
10.4%
Marital status for residents in Cumming Marital status - White (Caucasian) population 15 years and over
Males 37.8% Never married48.8% Now married2.4% Separated4.7% Widowed6.3% DivorcedFemales 21.9% Never married35.6% Now married1.5% Separated17.7% Widowed23.3% DivorcedWomen who gave birth in the past 12 months Now married:
11.2% (11)Unmarried:
88.8% (91)
Women who did not give birth in the past 12 months Now married:
39.1% (389)Unmarried:
60.9% (607)
Marital status - Black or African American population 15 years and over
Males 43.3% Never married26.6% Now married3.1% Separated1.9% Widowed25.1% DivorcedFemales 7.9% Never married3.8% Now married39.1% Separated29.3% Widowed19.9% DivorcedWomen who did not give birth in the past 12 months Now married:
0.0% (0)Unmarried:
100.0% (46)
Marital status - American Indian / Alaska Native population 15 years and over
Males 73.7% Never married26.3% Now married0.0% Separated0.0% Widowed0.0% DivorcedFemales 0.0% Never married100.0% Now married0.0% Separated0.0% Widowed0.0% DivorcedWomen who did not give birth in the past 12 months Now married:
100.0% (17)Unmarried:
0.0% (0)
Marital status - Asian population 15 years and over
Males 0.0% Never married91.5% Now married0.0% Separated0.0% Widowed8.5% DivorcedFemales 12.1% Never married70.9% Now married0.0% Separated7.1% Widowed9.9% DivorcedWomen who gave birth in the past 12 months Now married:
100.0% (23)Unmarried:
0.0% (0)
Women who did not give birth in the past 12 months Now married:
76.6% (117)Unmarried:
23.4% (36)
Marital status - Other race population 15 years and over
Males 28.0% Never married72.0% Now married0.0% Separated0.0% Widowed0.0% DivorcedFemales 0.0% Never married98.0% Now married0.0% Separated0.0% Widowed2.0% DivorcedWomen who did not give birth in the past 12 months Now married:
100.0% (61)Unmarried:
0.0% (0)
Marital status - Two or more races population 15 years and over
Males 94.8% Never married0.0% Now married0.0% Separated5.2% Widowed0.0% DivorcedFemales 87.6% Never married4.8% Now married0.0% Separated0.0% Widowed7.6% DivorcedWomen who did not give birth in the past 12 months Now married:
3.9% (13)Unmarried:
96.1% (319)
Marital status - White alone, not Hispanic / Latino population 15 years and over
Males 35.9% Never married50.3% Now married1.2% Separated5.4% Widowed7.2% DivorcedFemales 20.7% Never married36.1% Now married1.6% Separated18.6% Widowed23.1% DivorcedWomen who gave birth in the past 12 months Now married:
11.2% (12)Unmarried:
88.8% (92)
Women who did not give birth in the past 12 months Now married:
41.5% (394)Unmarried:
58.5% (556)
Marital status - Hispanic or Latino population 15 years and over
Males 61.3% Never married33.1% Now married5.5% Separated0.0% Widowed0.0% DivorcedFemales 51.9% Never married29.8% Now married0.0% Separated6.4% Widowed11.9% DivorcedWomen who did not give birth in the past 12 months Now married:
25.0% (58)Unmarried:
75.0% (175)
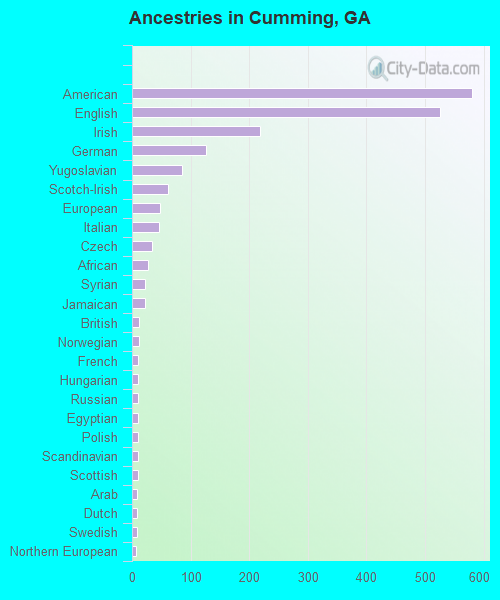
Ancestries in Cumming
580 15.5% American526 14.1% English219 5.9% Irish126 3.4% German86 2.3% Yugoslavian61 1.6% Scotch-Irish47 1.3% European46 1.2% Italian34 0.9% Czech27 0.7% African22 0.6% Syrian22 0.6% Jamaican12 0.3% British12 0.3% Norwegian11 0.3% French11 0.3% Hungarian11 0.3% Russian10 0.3% Egyptian10 0.3% Polish10 0.3% Scandinavian10 0.3% Scottish9 0.2% Arab9 0.2% Dutch9 0.2% Swedish7 0.2% Northern European6 0.2% Czechoslovakian
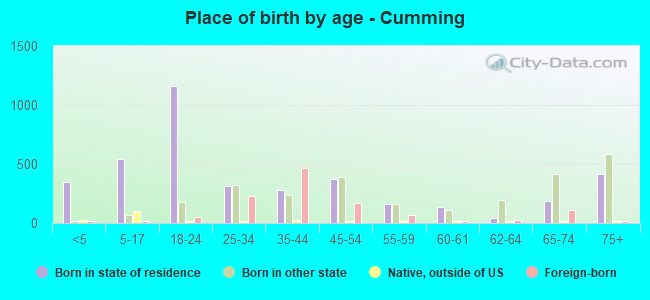
Children Nativity (place of birth) in Cumming
Children under 6 years - Living with two parents Both parents native 43 100.0% NativeBoth parents foreign-born 200 100.0% NativeChildren under 6 years - Living with one parent Native parent 106 100.0% NativeForeign-born parent 30 100.0% NativeChildren 6 to 17 years - Living with two parents Both parents native 136 100.0% Native0 0.0% Foreign-bornBoth parents foreign-born 47 87.5% Native7 12.5% Foreign-bornOne native, one foreign-born parent 65 100.0% NativeChildren 6 to 17 years - Living with one parent Native parent 122 100.0% NativeForeign-born parent 195 50.6% Native190 49.4% Foreign-born
Grandparents responsible for own grandchildren in Cumming
Grandparents (30 to 59 years) White / Caucasian 39 100.0% Not responsible for grandchildrenAsian 6 100.0% Not responsible for grandchildrenHispanic or Latino 33 100.0% Not responsible for grandchildrenGrandparents (60 years and over) White / Caucasian 19 57.5% Responsible for grandchildren14 42.5% Not responsible for grandchildrenAsian 11 100.0% Not responsible for grandchildren