Races in Dale City, Virginia (VA) Detailed Stats
Data:
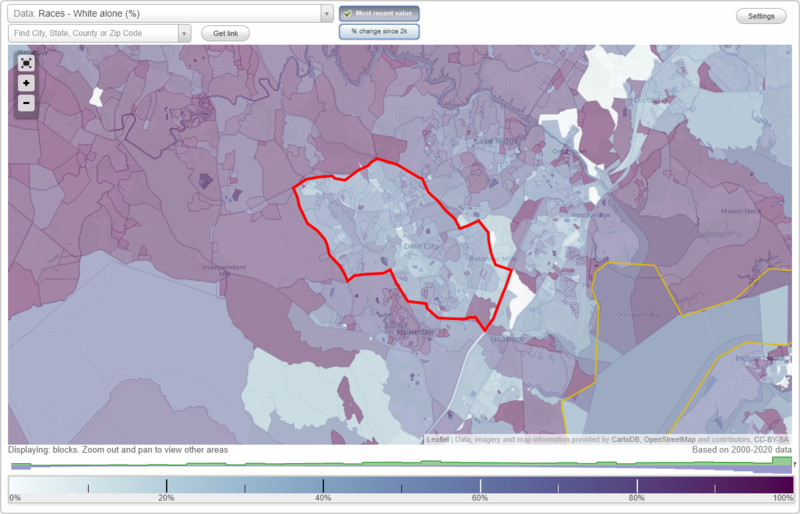
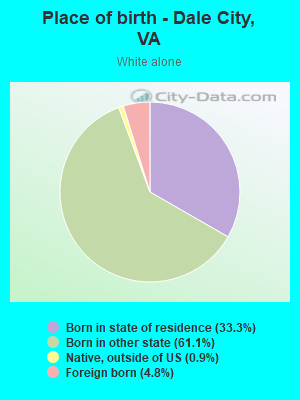
Races - White alone (%)
Races - White alone (% change since 2000)
Races - Black alone (%)
Races - Black alone (% change since 2000)
Races - American Indian alone (%)
Races - American Indian alone (% change since 2000)
Races - Asian alone (%)
Races - Asian alone (% change since 2000)
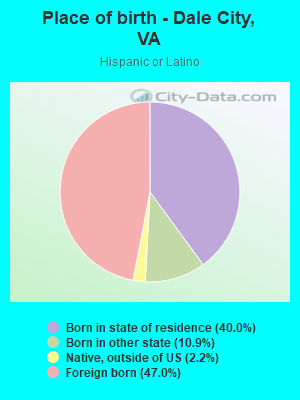
Races - Hispanic (%)
Races - Hispanic (% change since 2000)
Races - Native Hawaiian and Other Pacific Islander alone (%)
Races - Native Hawaiian and Other Pacific Islander alone (% change since 2000)
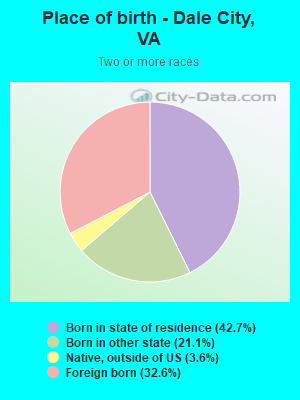
Races - Two or more races(%)
Races - Two or more races(% change since 2000)
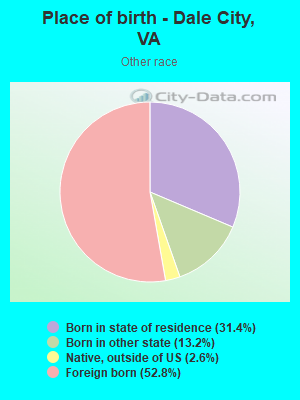
Races - Other race alone (%)
Races - Other race alone (% change since 2000)
Racial diversity
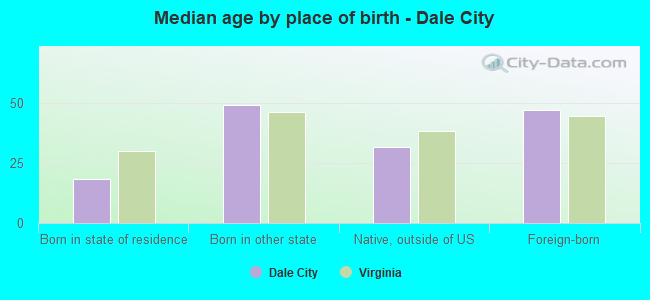
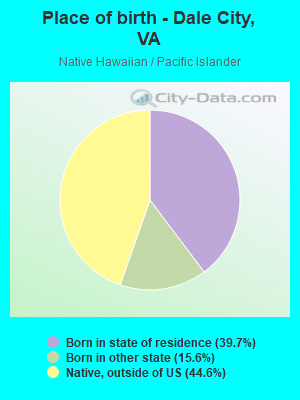
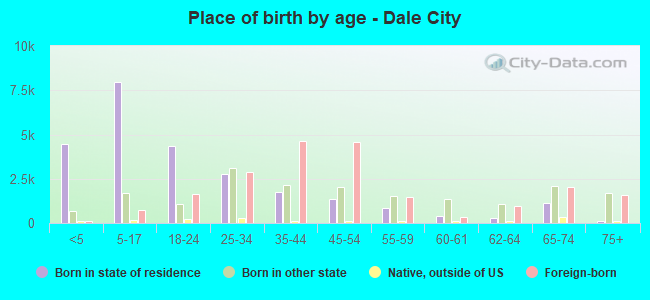
Place of birth - Born in state of residence (%)
Place of birth - Born in state of residence (%) - White
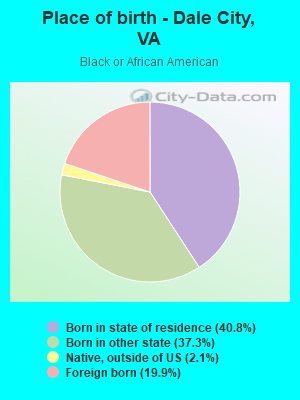
Place of birth - Born in state of residence (%) - Black or African American
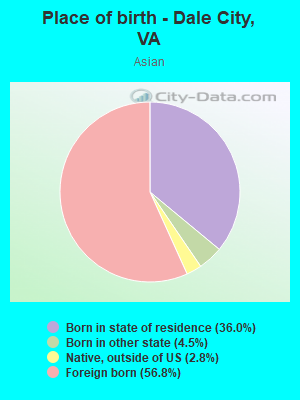
Place of birth - Born in state of residence (%) - Asian
Place of birth - Born in state of residence (%) - Hispanic or Latino
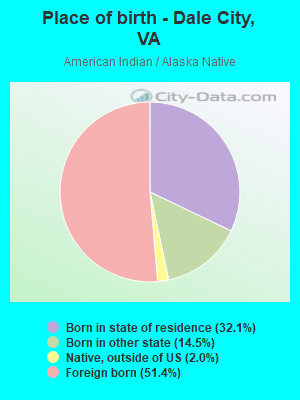
Place of birth - Born in state of residence (%) - American Indian and Alaska Native
Place of birth - Born in state of residence (%) - Multirace
Place of birth - Born in state of residence (%) - Other Race
Place of birth - Born in other state (%)
Place of birth - Born in other state (%) - White
Place of birth - Born in other state (%) - Black or African American
Place of birth - Born in other state (%) - Asian
Place of birth - Born in other state (%) - Hispanic or Latino
Place of birth - Born in other state (%) - American Indian and Alaska Native
Place of birth - Born in other state (%) - Multirace
Place of birth - Born in other state (%) - Other Race
Place of birth - Native, outside of US (%)
Place of birth - Native, outside of US (%) - White
Place of birth - Native, outside of US (%) - Black or African American
Place of birth - Native, outside of US (%) - Asian
Place of birth - Native, outside of US (%) - Hispanic or Latino
Place of birth - Native, outside of US (%) - American Indian and Alaska Native
Place of birth - Native, outside of US (%) - Multirace
Place of birth - Native, outside of US (%) - Other Race
Place of birth - Foreign born (%)
Place of birth - Foreign born (%) - White
Place of birth - Foreign born (%) - Black or African American
Place of birth - Foreign born (%) - Asian
Place of birth - Foreign born (%) - Hispanic or Latino
Place of birth - Foreign born (%) - American Indian and Alaska Native
Place of birth - Foreign born (%) - Multirace
Place of birth - Foreign born (%) - Other Race
Residents speaking English at home (%)
Residents speaking English at home - Born in the United States (%)
Residents speaking English at home - Native, born elsewhere (%)
Residents speaking English at home - Foreign born (%)
Residents speaking Spanish at home (%)
Residents speaking Spanish at home - Born in the United States (%)
Residents speaking Spanish at home - Native, born elsewhere (%)
Residents speaking Spanish at home - Foreign born (%)
Residents speaking other language at home (%)
Residents speaking other language at home - Born in the United States (%)
Residents speaking other language at home - Native, born elsewhere (%)
Residents speaking other language at home - Foreign born (%)
Marital status - Never married (%)
Marital status - Now married (%)
Marital status - Separated (%)
Marital status - Widowed (%)
Marital status - Divorced (%)
Ancestries Reported - Arab (%)
Ancestries Reported - Czech (%)
Ancestries Reported - Danish (%)
Ancestries Reported - Dutch (%)
Ancestries Reported - English (%)
Ancestries Reported - French (%)
Ancestries Reported - French Canadian (%)
Ancestries Reported - German (%)
Ancestries Reported - Greek (%)
Ancestries Reported - Hungarian (%)
Ancestries Reported - Irish (%)
Ancestries Reported - Italian (%)
Ancestries Reported - Lithuanian (%)
Ancestries Reported - Norwegian (%)
Ancestries Reported - Polish (%)
Ancestries Reported - Portuguese (%)
Ancestries Reported - Russian (%)
Ancestries Reported - Scotch-Irish (%)
Ancestries Reported - Scottish (%)
Ancestries Reported - Slovak (%)
Ancestries Reported - Subsaharan African (%)
Ancestries Reported - Swedish (%)
Ancestries Reported - Swiss (%)
Ancestries Reported - Ukrainian (%)
Ancestries Reported - United States (%)
Ancestries Reported - Welsh (%)
Ancestries Reported - West Indian (%)
Ancestries Reported - Other (%)
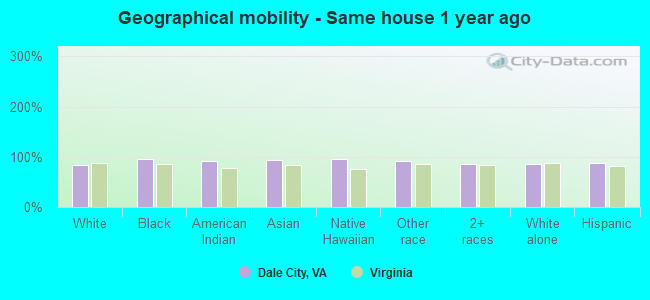
Geographical mobility - Same house 1 year ago (%)
Geographical mobility - Same house 1 year ago (%) - White
Geographical mobility - Same house 1 year ago (%) - Black or African American
Geographical mobility - Same house 1 year ago (%) - Asian
Geographical mobility - Same house 1 year ago (%) - Hispanic or Latino
Geographical mobility - Same house 1 year ago (%) - American Indian and Alaska Native
Geographical mobility - Same house 1 year ago (%) - Multirace
Geographical mobility - Same house 1 year ago (%) - Other Race
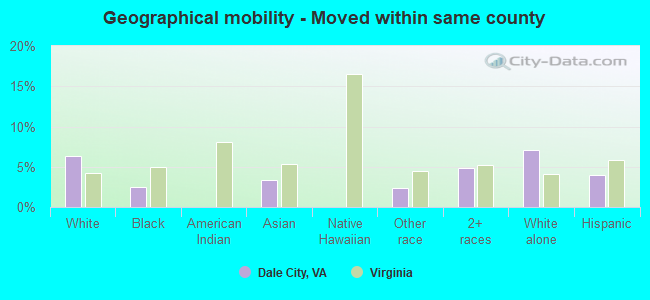
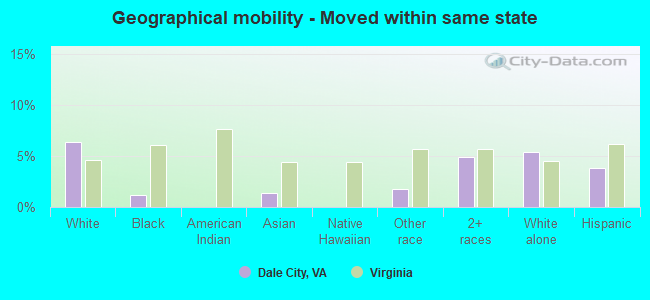
Geographical mobility - Moved within same county (%)
Geographical mobility - Moved within same county (%) - White
Geographical mobility - Moved within same county (%) - Black or African American
Geographical mobility - Moved within same county (%) - Asian
Geographical mobility - Moved within same county (%) - Hispanic or Latino
Geographical mobility - Moved within same county (%) - American Indian and Alaska Native
Geographical mobility - Moved within same county (%) - Multirace
Geographical mobility - Moved within same county (%) - Other Race
Geographical mobility - Moved from different county within same state (%)
Geographical mobility - Moved from different county within same state (%) - White
Geographical mobility - Moved from different county within same state (%) - Black or African American
Geographical mobility - Moved from different county within same state (%) - Asian
Geographical mobility - Moved from different county within same state (%) - Hispanic or Latino
Geographical mobility - Moved from different county within same state (%) - American Indian and Alaska Native
Geographical mobility - Moved from different county within same state (%) - Multirace
Geographical mobility - Moved from different county within same state (%) - Other Race
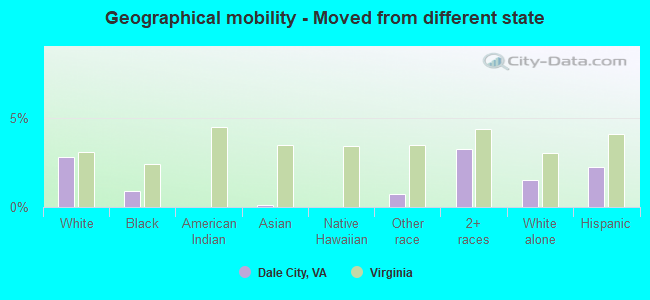
Geographical mobility - Moved from different state (%)
Geographical mobility - Moved from different state (%) - White
Geographical mobility - Moved from different state (%) - Black or African American
Geographical mobility - Moved from different state (%) - Asian
Geographical mobility - Moved from different state (%) - Hispanic or Latino
Geographical mobility - Moved from different state (%) - American Indian and Alaska Native
Geographical mobility - Moved from different state (%) - Multirace
Geographical mobility - Moved from different state (%) - Other Race
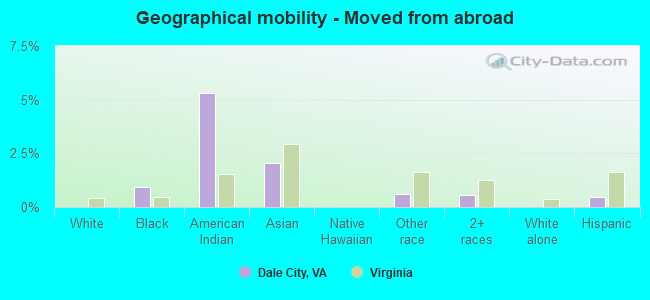
Geographical mobility - Moved from abroad (%)
Geographical mobility - Moved from abroad (%) - White
Geographical mobility - Moved from abroad (%) - Black or African American
Geographical mobility - Moved from abroad (%) - Asian
Geographical mobility - Moved from abroad (%) - Hispanic or Latino
Geographical mobility - Moved from abroad (%) - American Indian and Alaska Native
Geographical mobility - Moved from abroad (%) - Multirace
Geographical mobility - Moved from abroad (%) - Other Race
Place of birth for the foreign-born population - Ireland (%)
Place of birth for the foreign-born population - Denmark (%)
Place of birth for the foreign-born population - Norway (%)
Place of birth for the foreign-born population - Sweden (%)
Place of birth for the foreign-born population - United Kingdom (%)
Place of birth for the foreign-born population - England (%)
Place of birth for the foreign-born population - Scotland (%)
Place of birth for the foreign-born population - Other Northern Europe (%)
Place of birth for the foreign-born population - Austria (%)
Place of birth for the foreign-born population - Belgium (%)
Place of birth for the foreign-born population - France (%)
Place of birth for the foreign-born population - Germany (%)
Place of birth for the foreign-born population - Netherlands (%)
Place of birth for the foreign-born population - Switzerland (%)
Place of birth for the foreign-born population - Other Western Europe (%)
Place of birth for the foreign-born population - Greece (%)
Place of birth for the foreign-born population - Italy (%)
Place of birth for the foreign-born population - Portugal (%)
Place of birth for the foreign-born population - Spain (%)
Place of birth for the foreign-born population - Other Southern Europe (%)
Place of birth for the foreign-born population - Albania (%)
Place of birth for the foreign-born population - Belarus (%)
Place of birth for the foreign-born population - Bosnia and Herzegovina (%)
Place of birth for the foreign-born population - Bulgaria (%)
Place of birth for the foreign-born population - Croatia (%)
Place of birth for the foreign-born population - Czechoslovakia (%)
Place of birth for the foreign-born population - Hungary (%)
Place of birth for the foreign-born population - Latvia (%)
Place of birth for the foreign-born population - Lithuania (%)
Place of birth for the foreign-born population - North Macedonia (Macedonia) (%)
Place of birth for the foreign-born population - Moldova (%)
Place of birth for the foreign-born population - Poland (%)
Place of birth for the foreign-born population - Romania (%)
Place of birth for the foreign-born population - Russia (%)
Place of birth for the foreign-born population - Serbia (%)
Place of birth for the foreign-born population - Ukraine (%)
Place of birth for the foreign-born population - Other Eastern Europe (%)
Place of birth for the foreign-born population - China (%)
Place of birth for the foreign-born population - Hong Kong (%)
Place of birth for the foreign-born population - Taiwan (%)
Place of birth for the foreign-born population - Japan (%)
Place of birth for the foreign-born population - Korea (%)
Place of birth for the foreign-born population - Other Eastern Asia (%)
Place of birth for the foreign-born population - Afghanistan (%)
Place of birth for the foreign-born population - Bangladesh (%)
Place of birth for the foreign-born population - India (%)
Place of birth for the foreign-born population - Iran (%)
Place of birth for the foreign-born population - Kazakhstan (%)
Place of birth for the foreign-born population - Nepal (%)
Place of birth for the foreign-born population - Pakistan (%)
Place of birth for the foreign-born population - Sri Lanka (%)
Place of birth for the foreign-born population - Uzbekistan (%)
Place of birth for the foreign-born population - Other South Central Asia (%)
Place of birth for the foreign-born population - Burma (%)
Place of birth for the foreign-born population - Cambodia (%)
Place of birth for the foreign-born population - Indonesia (%)
Place of birth for the foreign-born population - Laos (%)
Place of birth for the foreign-born population - Malaysia (%)
Place of birth for the foreign-born population - Philippines (%)
Place of birth for the foreign-born population - Singapore (%)
Place of birth for the foreign-born population - Thailand (%)
Place of birth for the foreign-born population - Vietnam (%)
Place of birth for the foreign-born population - Other South Eastern Asia (%)
Place of birth for the foreign-born population - Armenia (%)
Place of birth for the foreign-born population - Iraq (%)
Place of birth for the foreign-born population - Israel (%)
Place of birth for the foreign-born population - Jordan (%)
Place of birth for the foreign-born population - Kuwait (%)
Place of birth for the foreign-born population - Lebanon (%)
Place of birth for the foreign-born population - Saudi Arabia (%)
Place of birth for the foreign-born population - Syria (%)
Place of birth for the foreign-born population - Turkey (%)
Place of birth for the foreign-born population - Yemen (%)
Place of birth for the foreign-born population - Other Western Asia (%)
Place of birth for the foreign-born population - Eritrea (%)
Place of birth for the foreign-born population - Ethiopia (%)
Place of birth for the foreign-born population - Kenya (%)
Place of birth for the foreign-born population - Somalia (%)
Place of birth for the foreign-born population - Uganda (%)
Place of birth for the foreign-born population - Zimbabwe (%)
Place of birth for the foreign-born population - Other Eastern Africa (%)
Place of birth for the foreign-born population - Cameroon (%)
Place of birth for the foreign-born population - Congo (%)
Place of birth for the foreign-born population - Democratic Republic of Congo (Zaire) (%)
Place of birth for the foreign-born population - Other Middle Africa (%)
Place of birth for the foreign-born population - Egypt (%)
Place of birth for the foreign-born population - Morocco (%)
Place of birth for the foreign-born population - Sudan (%)
Place of birth for the foreign-born population - Other Northern Africa (%)
Place of birth for the foreign-born population - South Africa (%)
Place of birth for the foreign-born population - Other Southern Africa (%)
Place of birth for the foreign-born population - Cabo Verde (%)
Place of birth for the foreign-born population - Ghana (%)
Place of birth for the foreign-born population - Liberia (%)
Place of birth for the foreign-born population - Nigeria (%)
Place of birth for the foreign-born population - Senegal (%)
Place of birth for the foreign-born population - Sierra Leone (%)
Place of birth for the foreign-born population - Other Western Africa (%)
Place of birth for the foreign-born population - Australia (%)
Place of birth for the foreign-born population - New Zealand (%)
Place of birth for the foreign-born population - Fiji (%)
Place of birth for the foreign-born population - Micronesia (%)
Place of birth for the foreign-born population - Bahamas (%)
Place of birth for the foreign-born population - Barbados (%)
Place of birth for the foreign-born population - Cuba (%)
Place of birth for the foreign-born population - Dominica (%)
Place of birth for the foreign-born population - Dominican Republic (%)
Place of birth for the foreign-born population - Grenada (%)
Place of birth for the foreign-born population - Haiti (%)
Place of birth for the foreign-born population - Jamaica (%)
Place of birth for the foreign-born population - St. Vincent and the Grenadines (%)
Place of birth for the foreign-born population - Trinidad and Tobago (%)
Place of birth for the foreign-born population - West Indies (%)
Place of birth for the foreign-born population - Other Caribbean (%)
Place of birth for the foreign-born population - Belize (%)
Place of birth for the foreign-born population - Costa Rica (%)
Place of birth for the foreign-born population - El Salvador (%)
Place of birth for the foreign-born population - Guatemala (%)
Place of birth for the foreign-born population - Honduras (%)
Place of birth for the foreign-born population - Mexico (%)
Place of birth for the foreign-born population - Nicaragua (%)
Place of birth for the foreign-born population - Panama (%)
Place of birth for the foreign-born population - Other Central America (%)
Place of birth for the foreign-born population - Argentina (%)
Place of birth for the foreign-born population - Bolivia (%)
Place of birth for the foreign-born population - Brazil (%)
Place of birth for the foreign-born population - Chile (%)
Place of birth for the foreign-born population - Colombia (%)
Place of birth for the foreign-born population - Ecuador (%)
Place of birth for the foreign-born population - Guyana (%)
Place of birth for the foreign-born population - Peru (%)
Place of birth for the foreign-born population - Uruguay (%)
Place of birth for the foreign-born population - Venezuela (%)
Place of birth for the foreign-born population - Other South America (%)
Place of birth for the foreign-born population - Canada (%)
Place of birth for the foreign-born population - Other Northern America (%)
Place of birth for the foreign-born population - Other (%)
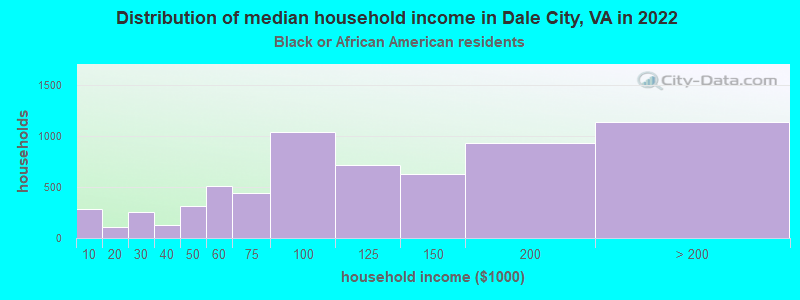
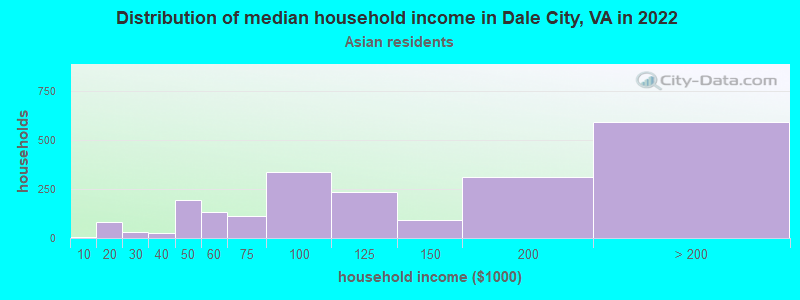
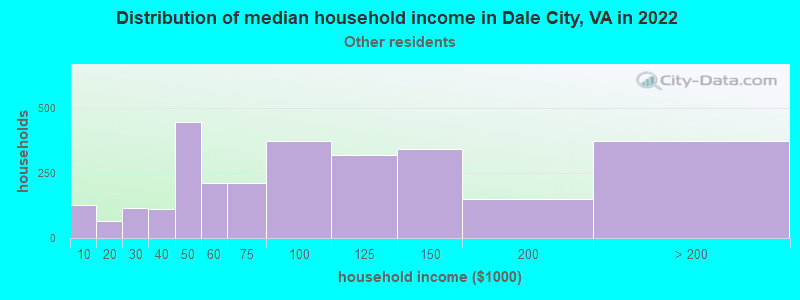
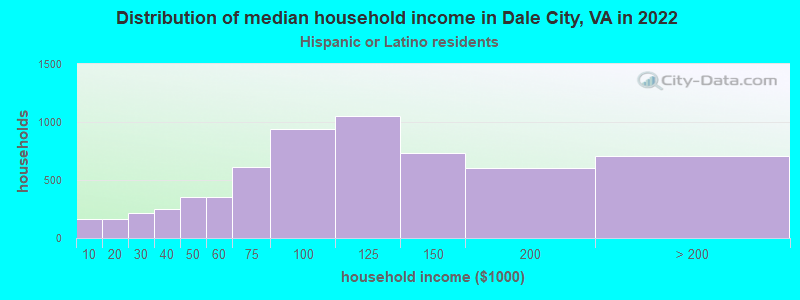
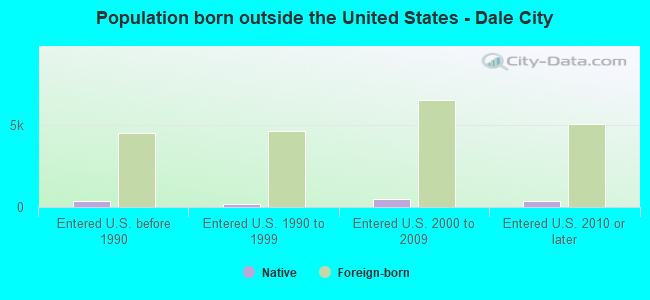
According to 2022 data, the most numerous races in Dale City, VA are White alone (13,288 residents), Black alone (15,348 residents), and Hispanic (23,898 residents). 50.7% of Dale City residents speak English at home. 33.0% of Dale City, VA residents are foreign-born (18.1% born in Latin America, 9.0% born in Asia, 5.0% born in Africa), which is 63.6% greater than the foreign-born rate of 12.0% across the entire state of Virginia.
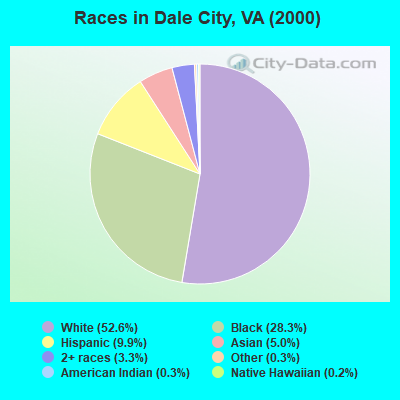
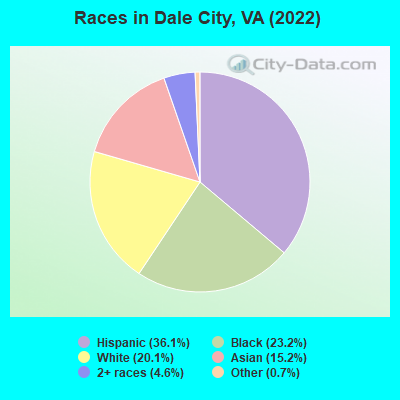
Race distribution in Dale City
2000 2022
29,436 52.6% White alone 15,845 28.3% Black alone 5,534 9.9% Hispanic 2,815 5.0% Asian alone 1,874 3.3% Two or more races 184 0.3% Other race alone 184 0.3% American Indian alone 99 0.2% Native Hawaiian and Other
23,898 36.1% Hispanic 15,348 23.2% Black alone 13,288 20.1% White alone 10,039 15.2% Asian alone 3,066 4.6% Two or more races 482 0.7% Other race alone 19 0.03% American Indian alone
2000 2022
4,965,637 70.2% White alone 1,376,378 19.4% Black alone 329,540 4.7% Hispanic 259,277 3.7% Asian alone 114,022 1.6% Two or more races 18,596 0.3% American Indian alone 11,685 0.2% Other race alone 3,380 0.05% Native Hawaiian and Other
5,095,130 58.7% White alone 1,594,785 18.4% Black alone 905,750 10.4% Hispanic 602,881 6.9% Asian alone 406,047 4.7% Two or more races 60,419 0.7% Other race alone 11,738 0.1% American Indian alone 6,869 0.08% Native Hawaiian and Other
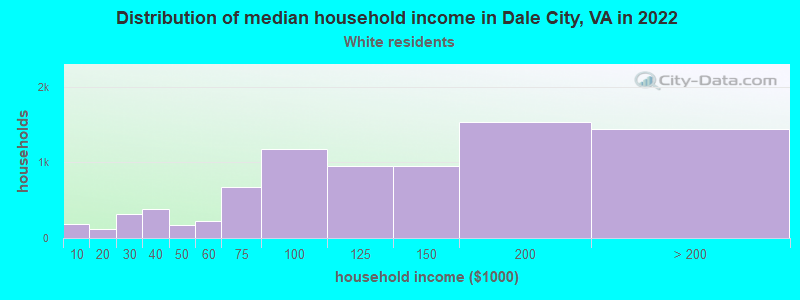
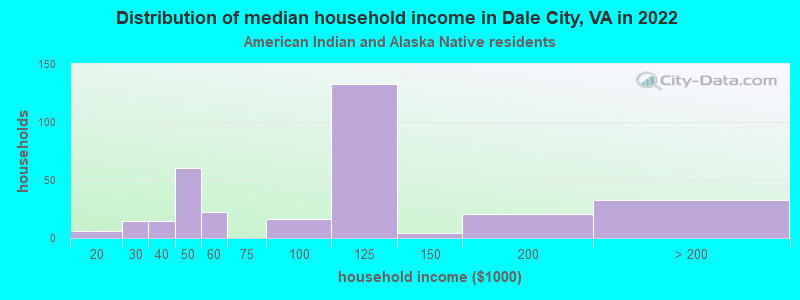
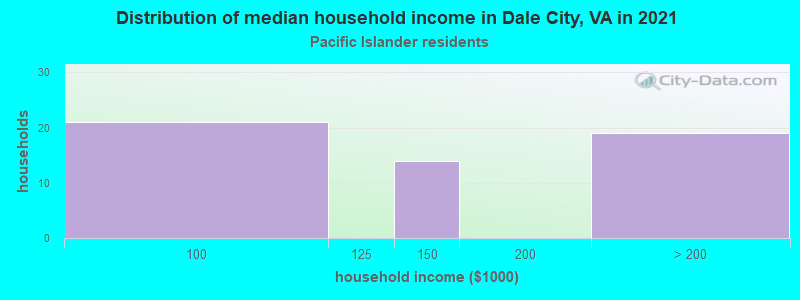
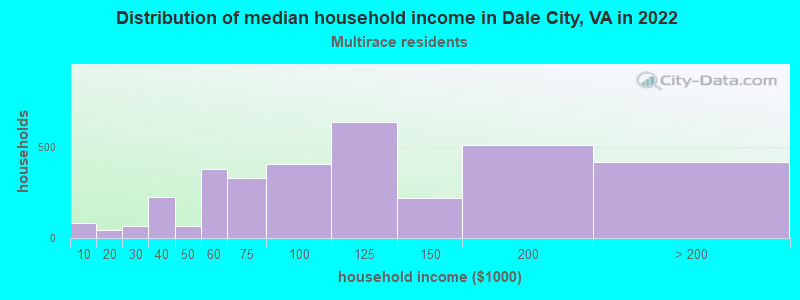
Income and house value in Dale City Median household income in 2022 $99,836 White non-Hispanic householders$88,500 Black householders$104,030 American Indian and Alaska Native householders$105,453 Asian householders$86,634 Some other race householders$85,943 Two or more races householders$87,726 Hispanic or Latino race householdersMedian 2022 house value $402,695 White Non-Hispanic householders$412,039 Black or African American householders$403,600 American Indian or Alaska Native householders $404,504 Asian householders$414,451 Native Hawaiian and other Pacific Islander householders$399,681 Some other race householders$372,252 Two or more races householders$396,365 Hispanic or Latino householders
Median age by race in Dale City
50.5 Median age for White residents51.8 49.0 36.7 Median age for Black or African American residents34.5 42.6 34.4 Median age for American Indian / Alaska Native residents38.9 35.8 31.9 Median age for Asian residents32.5 31.7 -666,666,666.0 Median age for Native Hawaiian / Pacific Islander residents-666,666,666.0 -666,666,666.0 28.1 Median age for Other race residents29.4 26.7 28.7 Median age for Two or more races residents28.3 31.2 54.5 Median age for White alone residents56.1 53.0 28.5 Median age for Hispanic or Latino residents28.5 28.1
Owner/renter occupied households by race in Dale City
House owners and renters - White residents 5,263 81.2% Owner occupied1,217 18.8% Renter occupiedHouse owners and renters - Black or African American residents 4,599 74.9% Owner occupied1,545 25.1% Renter occupiedHouse owners and renters - American Indian / Alaska Native residents 292 75.9% Owner occupied93 24.1% Renter occupiedHouse owners and renters - Asian residents 1,870 80.4% Owner occupied456 19.6% Renter occupiedHouse owners and renters - Native Hawaiian / Pacific Islander residents 53 83.4% Owner occupied11 16.6% Renter occupiedHouse owners and renters - Other race residents 1,735 66.3% Owner occupied883 33.7% Renter occupiedHouse owners and renters - Two or more races residents 2,221 76.8% Owner occupied672 23.2% Renter occupiedHouse owners and renters - White alone residents 5,140 80.9% Owner occupied1,217 19.1% Renter occupiedHouse owners and renters - Hispanic or Latino residents 4,075 74.9% Owner occupied1,363 25.1% Renter occupied
Language usage in Dale City
English speakers - Total 50.7% of residents of Dale City speak English at home.
30.4% of residents speak Spanish at home 10,524 56.9% Speak English very well7,958 43.1% Speak English less than very well19.0% of residents speak other language at home 7,096 61.5% Speak English very well4,450 38.5% Speak English less than very well
English speakers - Born in the United States 90.2% of residents of Dale City speak English at home.
7.8% of residents speak Spanish at home 1,389 100.0% Speak English very well2.0% of residents speak other language at home 348 100.0% Speak English very well
English speakers - Native, born elsewhere 45.6% of residents of Dale City speak English at home.
39.5% of residents speak Spanish at home 386 75.1% Speak English very well128 24.9% Speak English less than very well14.9% of residents speak other language at home 194 100.0% Speak English very well
English speakers - Foreign-born 6.0% of residents of Dale City speak English at home.
52.7% of residents speak Spanish at home 3,860 35.2% Speak English very well7,118 64.8% Speak English less than very well41.3% of residents speak other language at home 4,417 51.4% Speak English very well4,177 48.6% Speak English less than very well
White (Caucasian) - Speak only English Native:
91.8% (12,250)Foreign-born:
29.9% (266)
White (Caucasian) - Speak another language Native:
8.2% (1,096)Foreign-born:
70.1% (624)
Black or African American - Speak only English Native:
95.1% (11,083)Foreign-born:
9.9% (318)
Black or African American - Speak another language Native:
4.9% (570)Foreign-born:
90.1% (2,910)
American Indian / Alaska Native - Speak only English Native:
60.5% (258)Foreign-born:
0.5% (3)
American Indian / Alaska Native - Speak another language Native:
38.3% (163)Foreign-born:
100.0% (474)
Asian - Speak only English Native:
35.8% (1,220)Foreign-born:
6.5% (371)
Asian - Speak another language Native:
64.2% (2,184)Foreign-born:
93.5% (5,369)
Other race - Speak only English Native:
20.3% (1,187)Foreign-born:
1.9% (133)
Other race - Speak another language Native:
79.7% (4,656)Foreign-born:
98.1% (7,002)
Two or more races - Speak only English Native:
64.1% (3,318)Foreign-born:
5.3% (167)
Two or more races - Speak another language Native:
35.9% (1,857)Foreign-born:
94.7% (2,982)
White alone - Speak only English Native:
96.3% (14,734)Foreign-born:
16.5% (170)
White alone - Speak another language Native:
3.6% (550)Foreign-born:
85.0% (876)
Hispanic or Latino - Speak only English Native:
31.7% (3,454)Foreign-born:
2.7% (300)
Hispanic or Latino - Speak another language Native:
68.3% (7,438)Foreign-born:
97.3% (10,924)
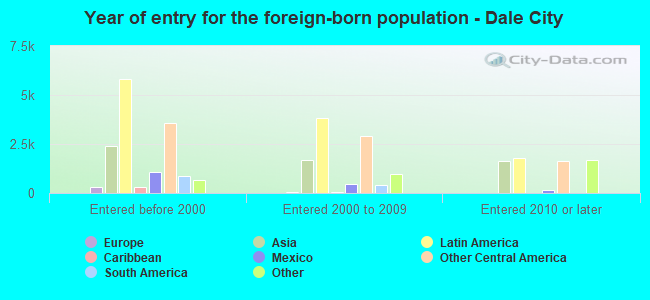
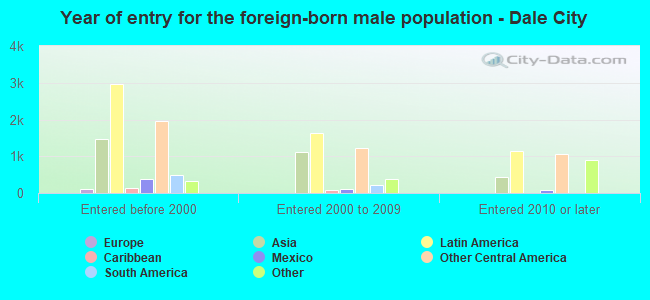
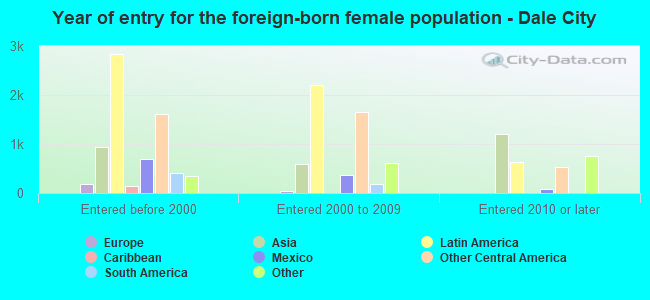
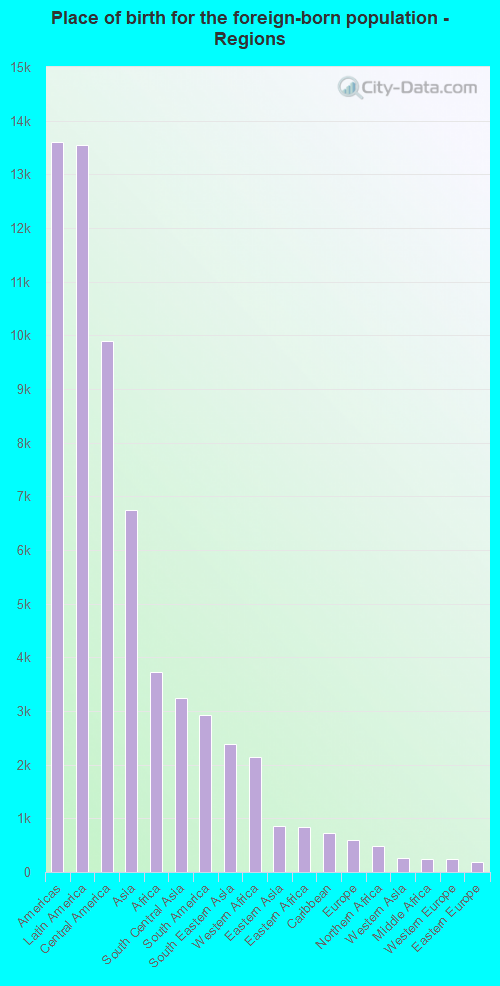
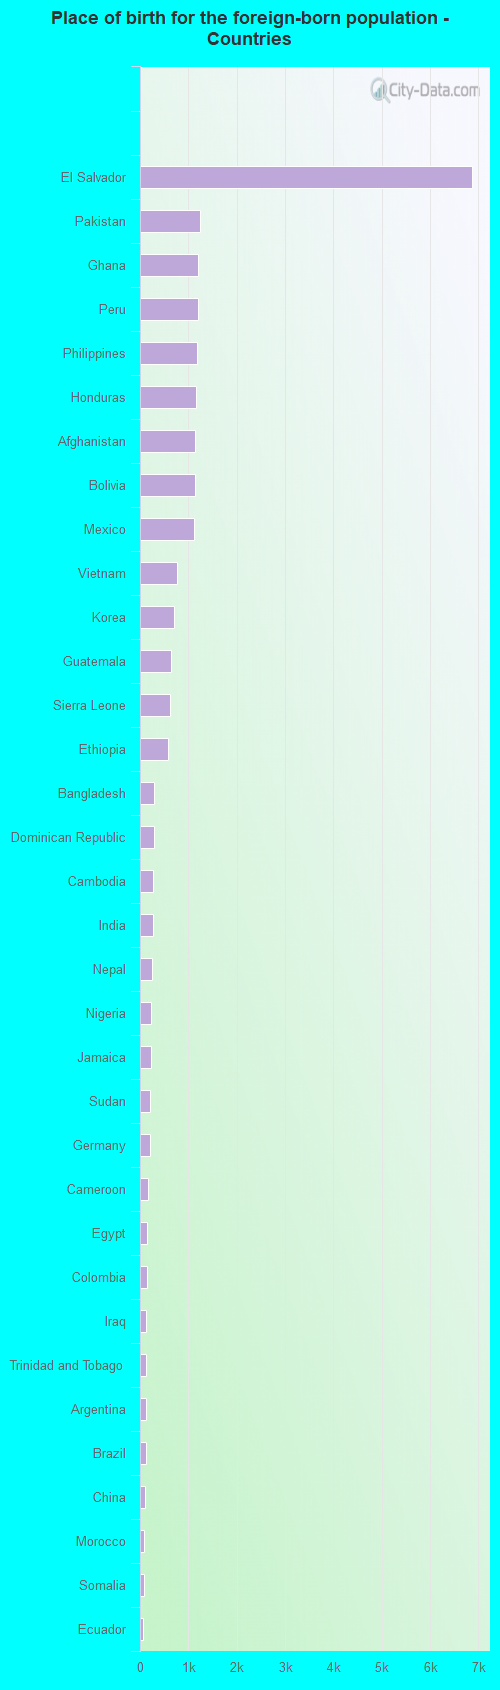
Foreign-born residents in Dale City 24,695 residents are foreign born (18.1% Latin America , 9.0% Asia , 5.0% Africa ).
This city:
33.0%Virginia:
12.6%
Marital status for residents in Dale City Marital status - White (Caucasian) population 15 years and over
Males 21.2% Never married59.3% Now married0.0% Separated7.8% Widowed11.7% DivorcedFemales 28.5% Never married48.0% Now married6.6% Separated4.1% Widowed12.8% DivorcedWomen who gave birth in the past 12 months Now married:
75.5% (233)Unmarried:
24.5% (76)
Women who did not give birth in the past 12 months Now married:
51.6% (2,544)Unmarried:
48.4% (2,387)
Marital status - Black or African American population 15 years and over
Males 44.7% Never married47.5% Now married0.0% Separated0.8% Widowed7.0% DivorcedFemales 40.7% Never married46.8% Now married4.0% Separated0.7% Widowed7.7% DivorcedWomen who gave birth in the past 12 months Now married:
100.0% (175)Unmarried:
0.0% (0)
Women who did not give birth in the past 12 months Now married:
32.1% (1,047)Unmarried:
67.9% (2,218)
Marital status - American Indian / Alaska Native population 15 years and over
Males 20.1% Never married50.9% Now married4.4% Separated19.5% Widowed5.1% DivorcedFemales 45.9% Never married34.3% Now married0.0% Separated3.8% Widowed16.0% DivorcedWomen who did not give birth in the past 12 months Now married:
36.8% (102)Unmarried:
63.2% (175)
Marital status - Asian population 15 years and over
Males 35.3% Never married63.4% Now married0.0% Separated0.0% Widowed1.4% DivorcedFemales 28.4% Never married60.2% Now married0.0% Separated6.9% Widowed4.5% DivorcedWomen who gave birth in the past 12 months Now married:
100.0% (301)Unmarried:
0.0% (0)
Women who did not give birth in the past 12 months Now married:
52.6% (1,195)Unmarried:
47.4% (1,075)
Marital status - Native Hawaiian / Pacific Islander population 15 years and over
Males 0.0% Never married100.0% Now married0.0% Separated0.0% Widowed0.0% DivorcedFemales 0.0% Never married100.0% Now married0.0% Separated0.0% Widowed0.0% DivorcedWomen who did not give birth in the past 12 months Now married:
100.0% (75)Unmarried:
0.0% (0)
Marital status - Other race population 15 years and over
Males 41.2% Never married53.4% Now married1.6% Separated1.4% Widowed2.4% DivorcedFemales 40.1% Never married50.4% Now married2.3% Separated1.9% Widowed5.4% DivorcedWomen who gave birth in the past 12 months Now married:
100.0% (135)Unmarried:
0.0% (0)
Women who did not give birth in the past 12 months Now married:
36.5% (1,509)Unmarried:
63.5% (2,624)
Marital status - Two or more races population 15 years and over
Males 39.3% Never married55.5% Now married0.0% Separated0.0% Widowed5.2% DivorcedFemales 40.8% Never married38.4% Now married8.5% Separated5.9% Widowed6.5% DivorcedWomen who gave birth in the past 12 months Now married:
75.3% (119)Unmarried:
24.7% (39)
Women who did not give birth in the past 12 months Now married:
31.3% (678)Unmarried:
68.7% (1,488)
Marital status - White alone, not Hispanic / Latino population 15 years and over
Males 20.1% Never married59.1% Now married0.0% Separated8.4% Widowed12.5% DivorcedFemales 24.9% Never married48.7% Now married7.4% Separated4.6% Widowed14.4% DivorcedWomen who gave birth in the past 12 months Now married:
71.0% (163)Unmarried:
29.0% (67)
Women who did not give birth in the past 12 months Now married:
52.8% (1,777)Unmarried:
47.2% (1,589)
Marital status - Hispanic or Latino population 15 years and over
Males 42.3% Never married51.3% Now married2.0% Separated2.8% Widowed1.6% DivorcedFemales 45.0% Never married43.3% Now married4.5% Separated0.5% Widowed6.6% DivorcedWomen who gave birth in the past 12 months Now married:
100.0% (254)Unmarried:
0.0% (0)
Women who did not give birth in the past 12 months Now married:
32.5% (2,058)Unmarried:
67.5% (4,269)
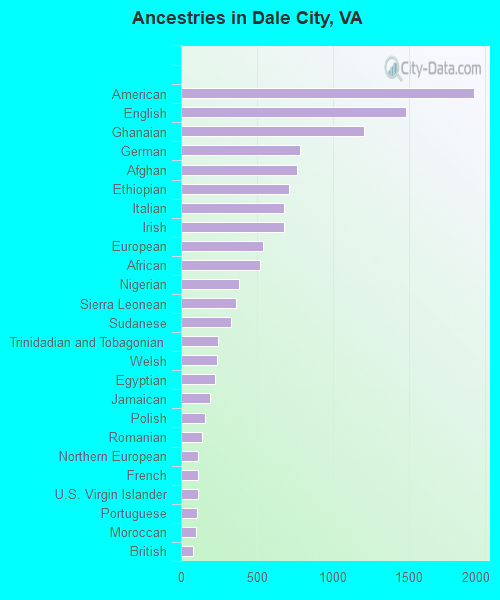
Ancestries in Dale City
1,931 4.6% American1,480 3.5% English1,206 2.8% Ghanaian781 1.8% German762 1.8% Afghan709 1.7% Ethiopian680 1.6% Italian679 1.6% Irish539 1.3% European519 1.2% African383 0.9% Nigerian363 0.9% Sierra Leonean327 0.8% Sudanese244 0.6% Trinidadian and Tobagonian240 0.6% Welsh226 0.5% Egyptian193 0.5% Jamaican160 0.4% Polish137 0.3% Romanian115 0.3% Northern European113 0.3% French109 0.3% U.S. Virgin Islander107 0.3% Portuguese99 0.2% Moroccan82 0.2% British79 0.2% Iraqi72 0.2% Scottish66 0.2% Somali61 0.1% Norwegian54 0.1% French Canadian49 0.1% Scotch-Irish49 0.1% Dutch48 0.1% Brazilian47 0.1% Haitian43 0.1% Iranian35 0.08% Russian34 0.08% Scandinavian31 0.07% Palestinian29 0.07% Bulgarian29 0.07% Turkish26 0.06% Hungarian25 0.06% Liberian16 0.04% Guyanese16 0.04% Swiss15 0.04% Slovak14 0.03% Syrian13 0.03% Danish9 0.02% Eastern European9 0.02% Canadian8 0.02% Yugoslavian7 0.02% Czechoslovakian7 0.02% Barbadian6 0.01% Swedish3 0.01% Macedonian3 0.01% Arab3 0.01% West Indian
Geographical mobility in Dale City Same house 1 year ago 12,524 84.5% White (Caucasian)16,717 95.6% Black or African American847 92.0% American Indian / Alaska Native8,393 94.2% Asian315 95.3% Native Hawaiian / Pacific Islander13,176 91.8% Other race11,500 86.3% Two or more races11,392 86.1% White alone, not Hispanic / Latino23,484 88.0% Hispanic or LatinoMoved within same county 930 6.3% White / Caucasian441 2.5% Black or African American297 3.3% Asian334 2.3% Other race645 4.8% Two or more races930 7.0% White alone, not Hispanic / Latino1,074 4.0% Hispanic or LatinoMoved within same state 947 6.4% White / Caucasian200 1.1% Black or African American124 1.4% Asian257 1.8% Other race657 4.9% Two or more races712 5.4% White alone, not Hispanic / Latino1,022 3.8% Hispanic or LatinoMoved from different state 416 2.8% White / Caucasian154 0.9% Black or African American12 0.1% Asian108 0.8% Other race431 3.2% Two or more races198 1.5% White alone, not Hispanic / Latino592 2.2% Hispanic or LatinoMoved from abroad 161 0.9% Black or African American49 5.3% American Indian / Alaska Native184 2.1% Asian84 0.6% Other race72 0.5% Two or more races129 0.5% Hispanic or Latino
Children Nativity (place of birth) in Dale City
Children under 6 years - Living with two parents Both parents native 1,153 100.0% NativeBoth parents foreign-born 1,490 100.0% NativeOne native, one foreign-born parent 878 100.0% NativeChildren under 6 years - Living with one parent Native parent 1,729 100.0% NativeForeign-born parent 710 100.0% NativeChildren 6 to 17 years - Living with two parents Both parents native 1,404 100.0% NativeBoth parents foreign-born 2,624 84.8% Native470 15.2% Foreign-bornOne native, one foreign-born parent 1,017 100.0% NativeChildren 6 to 17 years - Living with one parent Native parent 1,371 100.0% NativeForeign-born parent 2,571 52.5% Native2,324 47.5% Foreign-born
Place of birth for residents in Dale City 13,611 Americas13,542 Latin America9,897 Central America6,751 Asia3,727 Africa3,248 South Central Asia2,924 South America2,383 South Eastern Asia2,143 Western Africa864 Eastern Asia843 Eastern Africa720 Caribbean590 Europe493 Northern Africa255 Western Asia245 Middle Africa240 Western Europe186 Eastern Europe113 China86 Southern Europe77 Northern Europe68 Northern America16 Oceania16 Australia and New Zealand Subregion6,875 El Salvador1,242 Pakistan1,203 Ghana1,196 Peru1,187 Philippines1,161 Honduras1,143 Afghanistan1,136 Bolivia1,108 Mexico760 Vietnam705 Korea635 Guatemala613 Sierra Leone570 Ethiopia285 Bangladesh280 Dominican Republic276 Cambodia263 India246 Nepal233 Nigeria221 Jamaica216 Sudan210 Germany161 Cameroon155 Egypt153 Colombia133 Iraq128 Trinidad and Tobago124 Argentina124 Brazil113 China90 Morocco85 Somalia64 Ecuador59 Thailand59 Venezuela57 Panama53 England52 Canada46 Romania45 Congo43 Laos42 Italy37 Bhutan37 Japan34 Cuba32 Algeria31 Nicaragua31 Bulgaria31 Haiti30 Guyana29 Democratic Republic of Congo (Zaire)29 Indonesia28 Uganda28 Iran28 Russia27 Uruguay26 Bosnia and Herzegovina25 North Macedonia (Macedonia)25 Burma (Myanmar)23 Spain21 Liberia20 Portugal19 France16 Australia14 Costa Rica14 Israel13 Syria12 Moldova11 Ivory Coast10 Barbados10 Switzerland10 Ireland8 Poland8 Hungary7 United Kingdom6 Sweden6 Chile5 Jordan4 Kenya
Grandparents responsible for own grandchildren in Dale City
Grandparents (30 to 59 years) White / Caucasian 37 10.9% Responsible for grandchildren304 89.1% Not responsible for grandchildrenBlack or African American 73 35.1% Responsible for grandchildren136 64.9% Not responsible for grandchildrenAsian 11 17.8% Responsible for grandchildren51 82.2% Not responsible for grandchildrenOther race 238 42.9% Responsible for grandchildren317 57.1% Not responsible for grandchildrenTwo or more races 279 100.0% Not responsible for grandchildrenWhite alone, not Hispanic / Latino 39 20.1% Responsible for grandchildren154 79.9% Not responsible for grandchildrenHispanic or Latino 202 28.2% Responsible for grandchildren515 71.8% Not responsible for grandchildrenGrandparents (60 years and over) White / Caucasian 112 15.8% Responsible for grandchildren600 84.2% Not responsible for grandchildrenBlack or African American 144 36.7% Responsible for grandchildren249 63.3% Not responsible for grandchildrenAsian 33 10.7% Responsible for grandchildren274 89.3% Not responsible for grandchildrenOther race 83 48.9% Responsible for grandchildren86 51.1% Not responsible for grandchildrenTwo or more races 51 100.0% Not responsible for grandchildrenWhite alone, not Hispanic / Latino 104 18.7% Responsible for grandchildren451 81.3% Not responsible for grandchildrenHispanic or Latino 63 16.1% Responsible for grandchildren328 83.9% Not responsible for grandchildren