Races in Dardanelle, Arkansas (AR) Detailed Stats
Data:
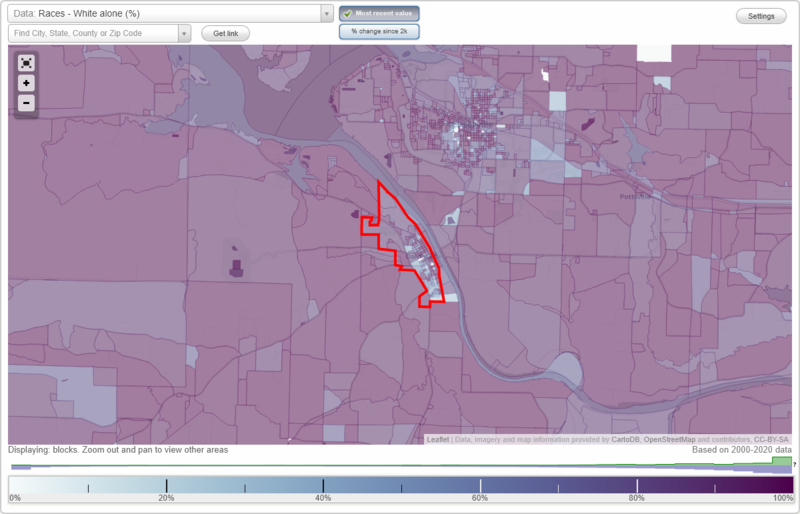
Races - White alone (%)
Races - White alone (% change since 2000)
Races - Black alone (%)
Races - Black alone (% change since 2000)
Races - American Indian alone (%)
Races - American Indian alone (% change since 2000)
Races - Asian alone (%)
Races - Asian alone (% change since 2000)
Races - Hispanic (%)
Races - Hispanic (% change since 2000)
Races - Native Hawaiian and Other Pacific Islander alone (%)
Races - Native Hawaiian and Other Pacific Islander alone (% change since 2000)
Races - Two or more races(%)
Races - Two or more races(% change since 2000)
Races - Other race alone (%)
Races - Other race alone (% change since 2000)
Racial diversity
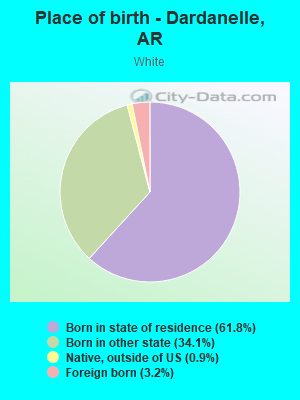
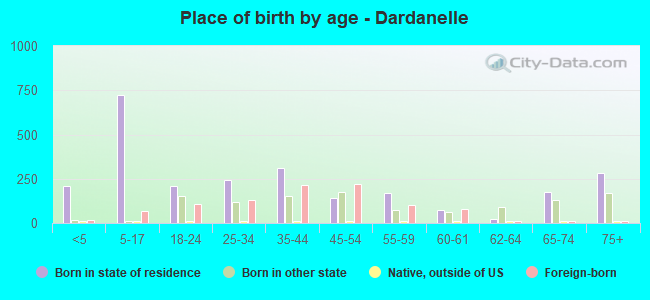
Place of birth - Born in state of residence (%)
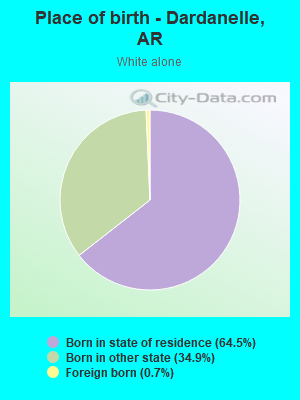
Place of birth - Born in state of residence (%) - White
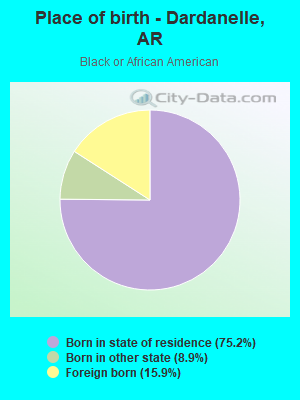
Place of birth - Born in state of residence (%) - Black or African American
Place of birth - Born in state of residence (%) - Asian
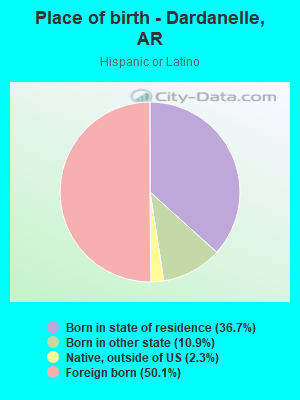
Place of birth - Born in state of residence (%) - Hispanic or Latino
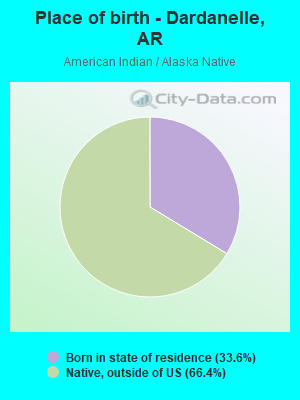
Place of birth - Born in state of residence (%) - American Indian and Alaska Native
Place of birth - Born in state of residence (%) - Multirace
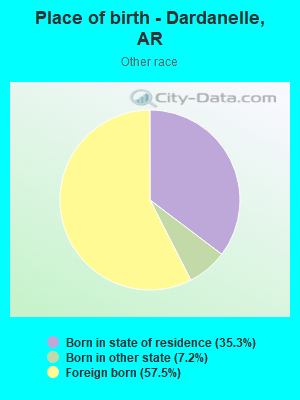
Place of birth - Born in state of residence (%) - Other Race
Place of birth - Born in other state (%)
Place of birth - Born in other state (%) - White
Place of birth - Born in other state (%) - Black or African American
Place of birth - Born in other state (%) - Asian
Place of birth - Born in other state (%) - Hispanic or Latino
Place of birth - Born in other state (%) - American Indian and Alaska Native
Place of birth - Born in other state (%) - Multirace
Place of birth - Born in other state (%) - Other Race
Place of birth - Native, outside of US (%)
Place of birth - Native, outside of US (%) - White
Place of birth - Native, outside of US (%) - Black or African American
Place of birth - Native, outside of US (%) - Asian
Place of birth - Native, outside of US (%) - Hispanic or Latino
Place of birth - Native, outside of US (%) - American Indian and Alaska Native
Place of birth - Native, outside of US (%) - Multirace
Place of birth - Native, outside of US (%) - Other Race
Place of birth - Foreign born (%)
Place of birth - Foreign born (%) - White
Place of birth - Foreign born (%) - Black or African American
Place of birth - Foreign born (%) - Asian
Place of birth - Foreign born (%) - Hispanic or Latino
Place of birth - Foreign born (%) - American Indian and Alaska Native
Place of birth - Foreign born (%) - Multirace
Place of birth - Foreign born (%) - Other Race
Residents speaking English at home (%)
Residents speaking English at home - Born in the United States (%)
Residents speaking English at home - Native, born elsewhere (%)
Residents speaking English at home - Foreign born (%)
Residents speaking Spanish at home (%)
Residents speaking Spanish at home - Born in the United States (%)
Residents speaking Spanish at home - Native, born elsewhere (%)
Residents speaking Spanish at home - Foreign born (%)
Residents speaking other language at home (%)
Residents speaking other language at home - Born in the United States (%)
Residents speaking other language at home - Native, born elsewhere (%)
Residents speaking other language at home - Foreign born (%)
Marital status - Never married (%)
Marital status - Now married (%)
Marital status - Separated (%)
Marital status - Widowed (%)
Marital status - Divorced (%)
Ancestries Reported - Arab (%)
Ancestries Reported - Czech (%)
Ancestries Reported - Danish (%)
Ancestries Reported - Dutch (%)
Ancestries Reported - English (%)
Ancestries Reported - French (%)
Ancestries Reported - French Canadian (%)
Ancestries Reported - German (%)
Ancestries Reported - Greek (%)
Ancestries Reported - Hungarian (%)
Ancestries Reported - Irish (%)
Ancestries Reported - Italian (%)
Ancestries Reported - Lithuanian (%)
Ancestries Reported - Norwegian (%)
Ancestries Reported - Polish (%)
Ancestries Reported - Portuguese (%)
Ancestries Reported - Russian (%)
Ancestries Reported - Scotch-Irish (%)
Ancestries Reported - Scottish (%)
Ancestries Reported - Slovak (%)
Ancestries Reported - Subsaharan African (%)
Ancestries Reported - Swedish (%)
Ancestries Reported - Swiss (%)
Ancestries Reported - Ukrainian (%)
Ancestries Reported - United States (%)
Ancestries Reported - Welsh (%)
Ancestries Reported - West Indian (%)
Ancestries Reported - Other (%)
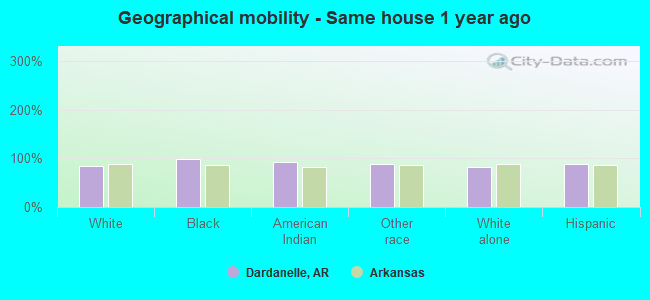
Geographical mobility - Same house 1 year ago (%)
Geographical mobility - Same house 1 year ago (%) - White
Geographical mobility - Same house 1 year ago (%) - Black or African American
Geographical mobility - Same house 1 year ago (%) - Asian
Geographical mobility - Same house 1 year ago (%) - Hispanic or Latino
Geographical mobility - Same house 1 year ago (%) - American Indian and Alaska Native
Geographical mobility - Same house 1 year ago (%) - Multirace
Geographical mobility - Same house 1 year ago (%) - Other Race
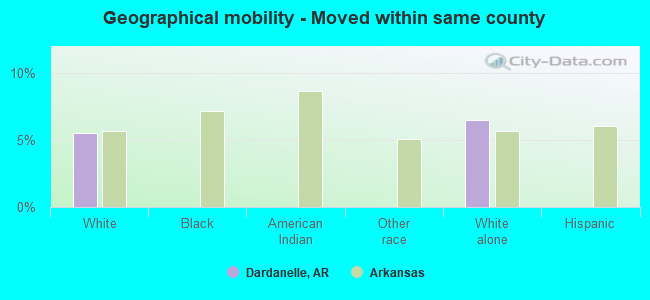
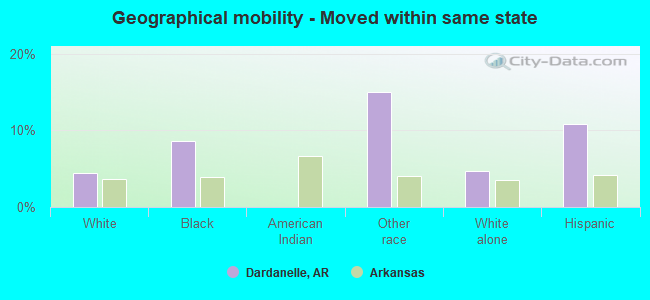
Geographical mobility - Moved within same county (%)
Geographical mobility - Moved within same county (%) - White
Geographical mobility - Moved within same county (%) - Black or African American
Geographical mobility - Moved within same county (%) - Asian
Geographical mobility - Moved within same county (%) - Hispanic or Latino
Geographical mobility - Moved within same county (%) - American Indian and Alaska Native
Geographical mobility - Moved within same county (%) - Multirace
Geographical mobility - Moved within same county (%) - Other Race
Geographical mobility - Moved from different county within same state (%)
Geographical mobility - Moved from different county within same state (%) - White
Geographical mobility - Moved from different county within same state (%) - Black or African American
Geographical mobility - Moved from different county within same state (%) - Asian
Geographical mobility - Moved from different county within same state (%) - Hispanic or Latino
Geographical mobility - Moved from different county within same state (%) - American Indian and Alaska Native
Geographical mobility - Moved from different county within same state (%) - Multirace
Geographical mobility - Moved from different county within same state (%) - Other Race
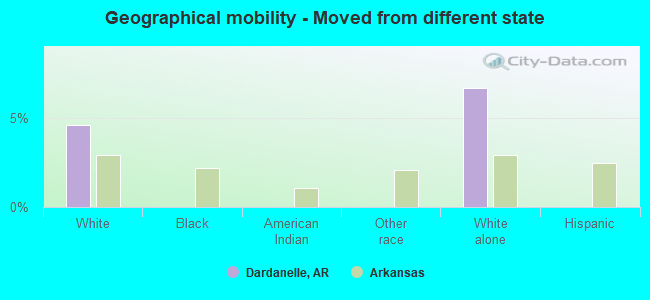
Geographical mobility - Moved from different state (%)
Geographical mobility - Moved from different state (%) - White
Geographical mobility - Moved from different state (%) - Black or African American
Geographical mobility - Moved from different state (%) - Asian
Geographical mobility - Moved from different state (%) - Hispanic or Latino
Geographical mobility - Moved from different state (%) - American Indian and Alaska Native
Geographical mobility - Moved from different state (%) - Multirace
Geographical mobility - Moved from different state (%) - Other Race
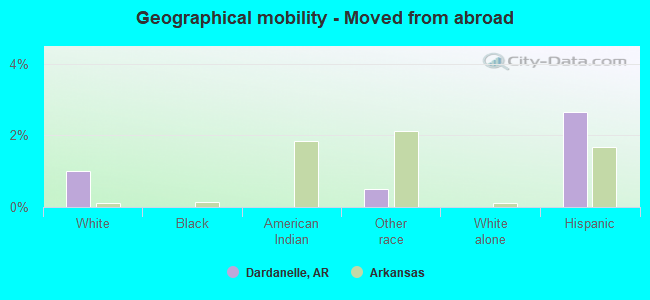
Geographical mobility - Moved from abroad (%)
Geographical mobility - Moved from abroad (%) - White
Geographical mobility - Moved from abroad (%) - Black or African American
Geographical mobility - Moved from abroad (%) - Asian
Geographical mobility - Moved from abroad (%) - Hispanic or Latino
Geographical mobility - Moved from abroad (%) - American Indian and Alaska Native
Geographical mobility - Moved from abroad (%) - Multirace
Geographical mobility - Moved from abroad (%) - Other Race
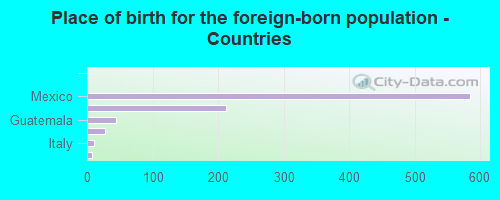
Place of birth for the foreign-born population - Ireland (%)
Place of birth for the foreign-born population - Denmark (%)
Place of birth for the foreign-born population - Norway (%)
Place of birth for the foreign-born population - Sweden (%)
Place of birth for the foreign-born population - United Kingdom (%)
Place of birth for the foreign-born population - England (%)
Place of birth for the foreign-born population - Scotland (%)
Place of birth for the foreign-born population - Other Northern Europe (%)
Place of birth for the foreign-born population - Austria (%)
Place of birth for the foreign-born population - Belgium (%)
Place of birth for the foreign-born population - France (%)
Place of birth for the foreign-born population - Germany (%)
Place of birth for the foreign-born population - Netherlands (%)
Place of birth for the foreign-born population - Switzerland (%)
Place of birth for the foreign-born population - Other Western Europe (%)
Place of birth for the foreign-born population - Greece (%)
Place of birth for the foreign-born population - Italy (%)
Place of birth for the foreign-born population - Portugal (%)
Place of birth for the foreign-born population - Spain (%)
Place of birth for the foreign-born population - Other Southern Europe (%)
Place of birth for the foreign-born population - Albania (%)
Place of birth for the foreign-born population - Belarus (%)
Place of birth for the foreign-born population - Bosnia and Herzegovina (%)
Place of birth for the foreign-born population - Bulgaria (%)
Place of birth for the foreign-born population - Croatia (%)
Place of birth for the foreign-born population - Czechoslovakia (%)
Place of birth for the foreign-born population - Hungary (%)
Place of birth for the foreign-born population - Latvia (%)
Place of birth for the foreign-born population - Lithuania (%)
Place of birth for the foreign-born population - North Macedonia (Macedonia) (%)
Place of birth for the foreign-born population - Moldova (%)
Place of birth for the foreign-born population - Poland (%)
Place of birth for the foreign-born population - Romania (%)
Place of birth for the foreign-born population - Russia (%)
Place of birth for the foreign-born population - Serbia (%)
Place of birth for the foreign-born population - Ukraine (%)
Place of birth for the foreign-born population - Other Eastern Europe (%)
Place of birth for the foreign-born population - China (%)
Place of birth for the foreign-born population - Hong Kong (%)
Place of birth for the foreign-born population - Taiwan (%)
Place of birth for the foreign-born population - Japan (%)
Place of birth for the foreign-born population - Korea (%)
Place of birth for the foreign-born population - Other Eastern Asia (%)
Place of birth for the foreign-born population - Afghanistan (%)
Place of birth for the foreign-born population - Bangladesh (%)
Place of birth for the foreign-born population - India (%)
Place of birth for the foreign-born population - Iran (%)
Place of birth for the foreign-born population - Kazakhstan (%)
Place of birth for the foreign-born population - Nepal (%)
Place of birth for the foreign-born population - Pakistan (%)
Place of birth for the foreign-born population - Sri Lanka (%)
Place of birth for the foreign-born population - Uzbekistan (%)
Place of birth for the foreign-born population - Other South Central Asia (%)
Place of birth for the foreign-born population - Burma (%)
Place of birth for the foreign-born population - Cambodia (%)
Place of birth for the foreign-born population - Indonesia (%)
Place of birth for the foreign-born population - Laos (%)
Place of birth for the foreign-born population - Malaysia (%)
Place of birth for the foreign-born population - Philippines (%)
Place of birth for the foreign-born population - Singapore (%)
Place of birth for the foreign-born population - Thailand (%)
Place of birth for the foreign-born population - Vietnam (%)
Place of birth for the foreign-born population - Other South Eastern Asia (%)
Place of birth for the foreign-born population - Armenia (%)
Place of birth for the foreign-born population - Iraq (%)
Place of birth for the foreign-born population - Israel (%)
Place of birth for the foreign-born population - Jordan (%)
Place of birth for the foreign-born population - Kuwait (%)
Place of birth for the foreign-born population - Lebanon (%)
Place of birth for the foreign-born population - Saudi Arabia (%)
Place of birth for the foreign-born population - Syria (%)
Place of birth for the foreign-born population - Turkey (%)
Place of birth for the foreign-born population - Yemen (%)
Place of birth for the foreign-born population - Other Western Asia (%)
Place of birth for the foreign-born population - Eritrea (%)
Place of birth for the foreign-born population - Ethiopia (%)
Place of birth for the foreign-born population - Kenya (%)
Place of birth for the foreign-born population - Somalia (%)
Place of birth for the foreign-born population - Uganda (%)
Place of birth for the foreign-born population - Zimbabwe (%)
Place of birth for the foreign-born population - Other Eastern Africa (%)
Place of birth for the foreign-born population - Cameroon (%)
Place of birth for the foreign-born population - Congo (%)
Place of birth for the foreign-born population - Democratic Republic of Congo (Zaire) (%)
Place of birth for the foreign-born population - Other Middle Africa (%)
Place of birth for the foreign-born population - Egypt (%)
Place of birth for the foreign-born population - Morocco (%)
Place of birth for the foreign-born population - Sudan (%)
Place of birth for the foreign-born population - Other Northern Africa (%)
Place of birth for the foreign-born population - South Africa (%)
Place of birth for the foreign-born population - Other Southern Africa (%)
Place of birth for the foreign-born population - Cabo Verde (%)
Place of birth for the foreign-born population - Ghana (%)
Place of birth for the foreign-born population - Liberia (%)
Place of birth for the foreign-born population - Nigeria (%)
Place of birth for the foreign-born population - Senegal (%)
Place of birth for the foreign-born population - Sierra Leone (%)
Place of birth for the foreign-born population - Other Western Africa (%)
Place of birth for the foreign-born population - Australia (%)
Place of birth for the foreign-born population - New Zealand (%)
Place of birth for the foreign-born population - Fiji (%)
Place of birth for the foreign-born population - Micronesia (%)
Place of birth for the foreign-born population - Bahamas (%)
Place of birth for the foreign-born population - Barbados (%)
Place of birth for the foreign-born population - Cuba (%)
Place of birth for the foreign-born population - Dominica (%)
Place of birth for the foreign-born population - Dominican Republic (%)
Place of birth for the foreign-born population - Grenada (%)
Place of birth for the foreign-born population - Haiti (%)
Place of birth for the foreign-born population - Jamaica (%)
Place of birth for the foreign-born population - St. Vincent and the Grenadines (%)
Place of birth for the foreign-born population - Trinidad and Tobago (%)
Place of birth for the foreign-born population - West Indies (%)
Place of birth for the foreign-born population - Other Caribbean (%)
Place of birth for the foreign-born population - Belize (%)
Place of birth for the foreign-born population - Costa Rica (%)
Place of birth for the foreign-born population - El Salvador (%)
Place of birth for the foreign-born population - Guatemala (%)
Place of birth for the foreign-born population - Honduras (%)
Place of birth for the foreign-born population - Mexico (%)
Place of birth for the foreign-born population - Nicaragua (%)
Place of birth for the foreign-born population - Panama (%)
Place of birth for the foreign-born population - Other Central America (%)
Place of birth for the foreign-born population - Argentina (%)
Place of birth for the foreign-born population - Bolivia (%)
Place of birth for the foreign-born population - Brazil (%)
Place of birth for the foreign-born population - Chile (%)
Place of birth for the foreign-born population - Colombia (%)
Place of birth for the foreign-born population - Ecuador (%)
Place of birth for the foreign-born population - Guyana (%)
Place of birth for the foreign-born population - Peru (%)
Place of birth for the foreign-born population - Uruguay (%)
Place of birth for the foreign-born population - Venezuela (%)
Place of birth for the foreign-born population - Other South America (%)
Place of birth for the foreign-born population - Canada (%)
Place of birth for the foreign-born population - Other Northern America (%)
Place of birth for the foreign-born population - Other (%)
Latest news about races in Dardanelle, AR collected exclusively by city-data.com from local newspapers, TV, and radio stations
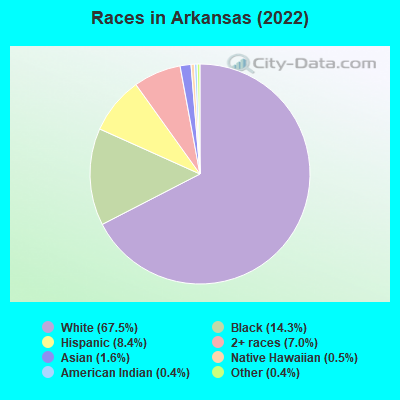
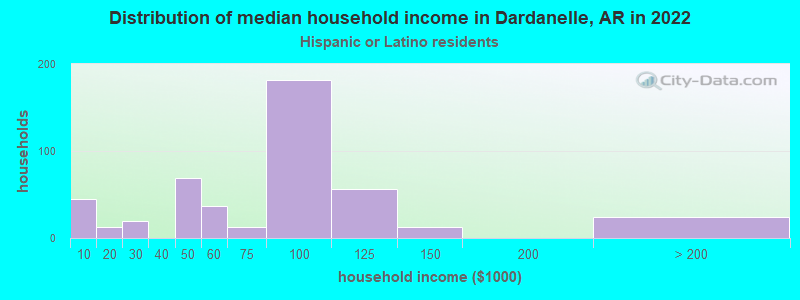
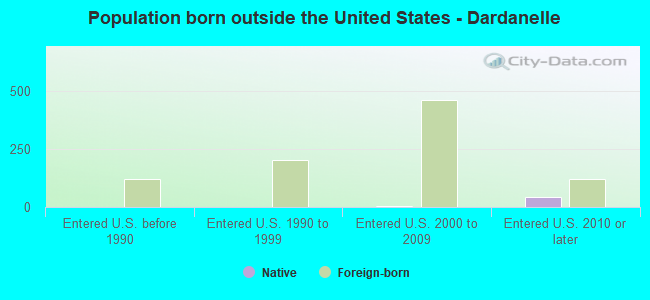
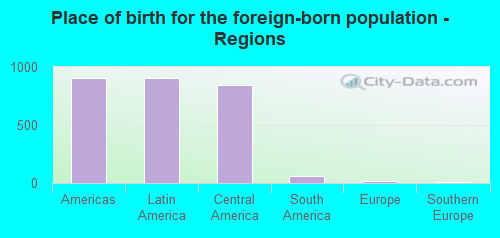
According to 2022 data, the most numerous races in Dardanelle, AR are White alone (2,599 residents), Black alone (198 residents), and Hispanic (1,882 residents). 67.5% of Dardanelle residents speak English at home. 20.0% of Dardanelle, AR residents are foreign-born (19.0% born in Latin America), which is 80.0% greater than the foreign-born rate of 4.0% across the entire state of Arkansas.
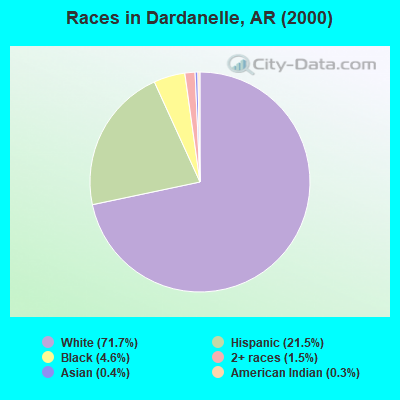
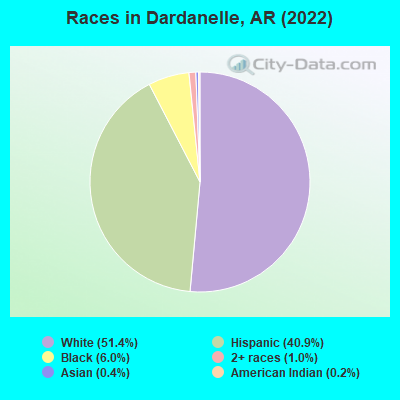
Race distribution in Dardanelle
2000 2022
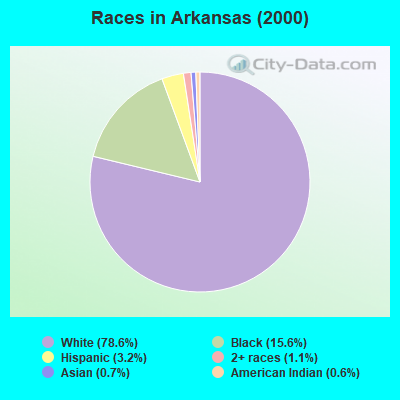
2,100,135 78.6% White alone 416,615 15.6% Black alone 86,866 3.2% Hispanic 30,364 1.1% Two or more races 19,892 0.7% Asian alone 16,702 0.6% American Indian alone 1,494 0.06% Native Hawaiian and Other 1,332 0.05% Other race alone
2,054,922 67.5% White alone 435,637 14.3% Black alone 255,416 8.4% Hispanic 213,684 7.0% Two or more races 47,592 1.6% Asian alone 14,176 0.5% Native Hawaiian and Other 12,680 0.4% American Indian alone 11,530 0.4% Other race alone
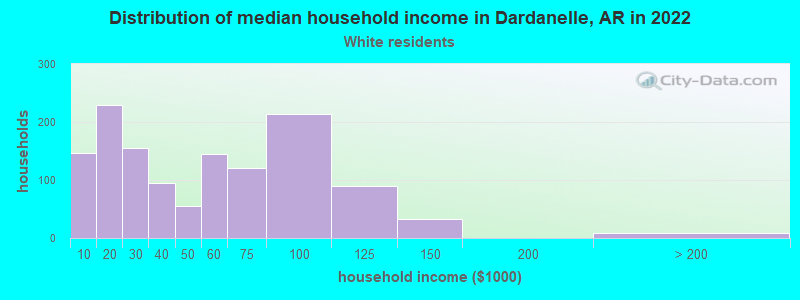
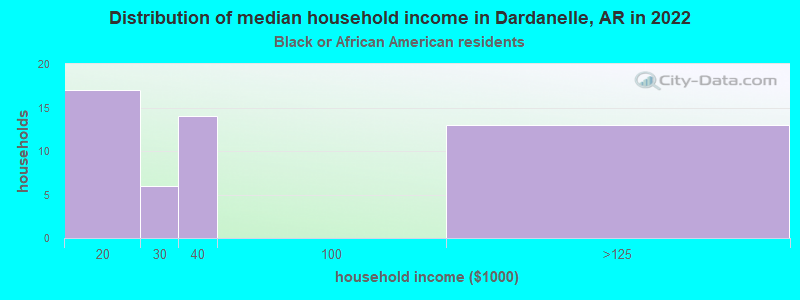
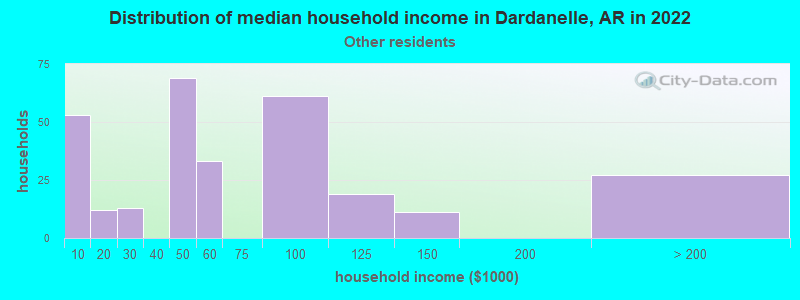
Income and house value in Dardanelle Median household income in 2022 $47,156 White non-Hispanic householders$56,570 Black householders$39,084 American Indian and Alaska Native householders$59,200 Some other race householders$37,130 Two or more races householders$57,294 Hispanic or Latino race householdersMedian 2022 house value $157,391 White Non-Hispanic householders$99,503 Black or African American householders$300,111 American Indian or Alaska Native householders$165,127 Some other race householders$165,127 Hispanic or Latino householders
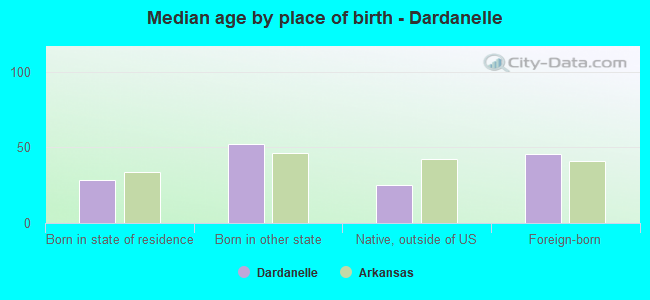
Median age by race in Dardanelle
40.7 Median age for White residents39.4 46.5 53.8 Median age for Black or African American residents49.9 58.4 25.1 Median age for Other race residents23.9 28.5 67.3 Median age for Two or more races residents46.5 Median age for White alone residents40.2 50.2 24.1 Median age for Hispanic or Latino residents23.4 34.9
Owner/renter occupied households by race in Dardanelle
House owners and renters - White residents 659 57.0% Owner occupied496 43.0% Renter occupiedHouse owners and renters - Black or African American residents 30 22.4% Owner occupied105 77.6% Renter occupiedHouse owners and renters - Other race residents 239 80.3% Owner occupied59 19.7% Renter occupiedHouse owners and renters - White alone residents 612 56.4% Owner occupied474 43.6% Renter occupiedHouse owners and renters - Hispanic or Latino residents 327 72.1% Owner occupied126 27.9% Renter occupied
Language usage in Dardanelle
English speakers - Total 67.5% of residents of Dardanelle speak English at home.
33.1% of residents speak Spanish at home 841 58.5% Speak English very well597 41.5% Speak English less than very well0.1% of residents speak other language at home 6 100.0% Speak English less than very well
English speakers - Born in the United States 86.8% of residents of Dardanelle speak English at home.
13.3% of residents speak Spanish at home 147 100.0% Speak English very well
English speakers - Native, born elsewhere 19.4% of residents of Dardanelle speak English at home.
97.2% of residents speak Spanish at home 7 20.0% Speak English very well28 80.0% Speak English less than very well
English speakers - Foreign-born 5.2% of residents of Dardanelle speak English at home.
93.9% of residents speak Spanish at home 353 41.3% Speak English very well501 58.7% Speak English less than very well0.7% of residents speak other language at home 6 100.0% Speak English less than very well
White (Caucasian) - Speak only English Native:
93.8% (2,464)Foreign-born:
26.3% (21)
White (Caucasian) - Speak another language Native:
5.8% (153)Foreign-born:
72.9% (58)
Black or African American - Speak another language Native:
7.2% (17)Foreign-born:
100.0% (49)
Other race - Speak only English Native:
26.9% (134)Foreign-born:
4.5% (31)
Other race - Speak another language Native:
71.4% (357)Foreign-born:
92.3% (633)
White alone - Speak only English Native:
98.5% (2,448)Foreign-born:
70.9% (11)
White alone - Speak another language Native:
1.5% (36)Foreign-born:
32.0% (5)
Hispanic or Latino - Speak only English Native:
24.8% (197)Foreign-born:
4.5% (43)
Hispanic or Latino - Speak another language Native:
72.1% (573)Foreign-born:
94.1% (900)
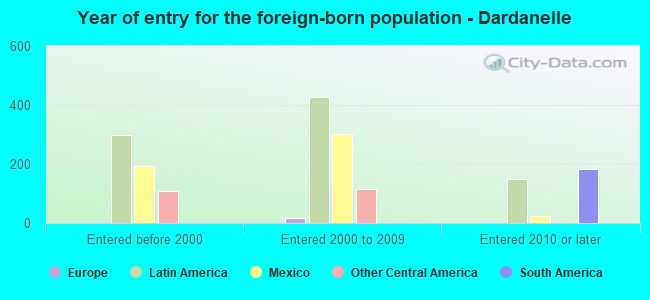
Foreign-born residents in Dardanelle 923 residents are foreign born (19.0% Latin America ).
This city:
20.0%Arkansas:
100.0%
Marital status for residents in Dardanelle Marital status - White (Caucasian) population 15 years and over
Males 28.7% Never married46.2% Now married1.9% Separated8.9% Widowed14.4% DivorcedFemales 25.8% Never married33.9% Now married4.9% Separated18.8% Widowed16.6% DivorcedWomen who gave birth in the past 12 months Now married:
42.1% (23)Unmarried:
57.9% (31)
Women who did not give birth in the past 12 months Now married:
46.6% (285)Unmarried:
53.4% (326)
Marital status - Black or African American population 15 years and over
Males 21.7% Never married54.3% Now married0.0% Separated8.5% Widowed15.5% DivorcedFemales 66.7% Never married2.8% Now married0.0% Separated30.5% Widowed0.0% DivorcedWomen who did not give birth in the past 12 months Now married:
6.5% (4)Unmarried:
93.5% (59)
Marital status - Other race population 15 years and over
Males 58.4% Never married41.6% Now married0.0% Separated0.0% Widowed0.0% DivorcedFemales 37.3% Never married43.3% Now married0.0% Separated0.0% Widowed19.3% DivorcedWomen who gave birth in the past 12 months Now married:
0.0% (0)Unmarried:
100.0% (11)
Women who did not give birth in the past 12 months Now married:
36.5% (126)Unmarried:
63.5% (220)
Marital status - White alone, not Hispanic / Latino population 15 years and over
Males 24.0% Never married48.0% Now married2.1% Separated9.9% Widowed16.0% DivorcedFemales 24.5% Never married34.2% Now married4.5% Separated19.9% Widowed17.0% DivorcedWomen who gave birth in the past 12 months Now married:
36.5% (18)Unmarried:
63.5% (32)
Women who did not give birth in the past 12 months Now married:
48.6% (272)Unmarried:
51.4% (287)
Marital status - Hispanic or Latino population 15 years and over
Males 57.8% Never married42.2% Now married0.0% Separated0.0% Widowed0.0% DivorcedFemales 38.1% Never married39.1% Now married1.8% Separated4.5% Widowed16.4% DivorcedWomen who gave birth in the past 12 months Now married:
33.3% (6)Unmarried:
66.7% (11)
Women who did not give birth in the past 12 months Now married:
33.4% (159)Unmarried:
66.6% (318)
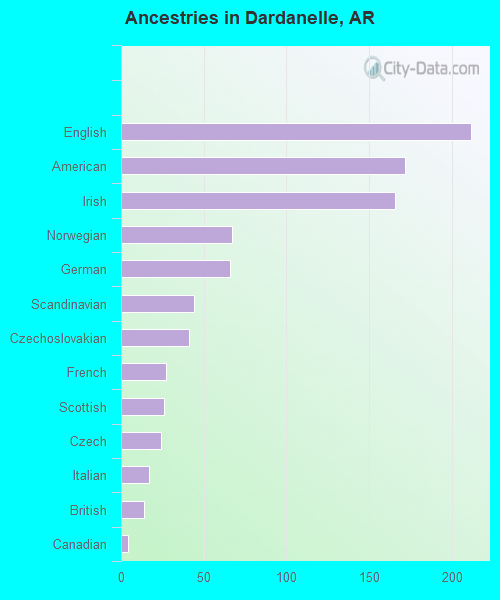
Ancestries in Dardanelle
274 11.7% American116 5.0% Irish84 3.6% English58 2.5% French47 2.0% European47 2.0% German33 1.4% Czech28 1.2% Norwegian26 1.1% Scottish22 0.9% British21 0.9% Italian5 0.2% Dutch
Children Nativity (place of birth) in Dardanelle
Children under 6 years - Living with two parents Both parents native 77 100.0% NativeBoth parents foreign-born 13 38.2% Native22 61.8% Foreign-bornOne native, one foreign-born parent 12 100.0% NativeChildren under 6 years - Living with one parent Native parent 101 100.0% NativeForeign-born parent 43 100.0% NativeChildren 6 to 17 years - Living with two parents Both parents native 186 100.0% NativeBoth parents foreign-born 143 82.1% Native31 17.9% Foreign-bornChildren 6 to 17 years - Living with one parent Native parent 168 100.0% NativeForeign-born parent 207 55.5% Native166 44.5% Foreign-born
Grandparents responsible for own grandchildren in Dardanelle
Grandparents (30 to 59 years) White / Caucasian 26 42.3% Responsible for grandchildren35 57.7% Not responsible for grandchildrenWhite alone, not Hispanic / Latino 37 100.0% Not responsible for grandchildrenHispanic or Latino 18 100.0% Responsible for grandchildrenGrandparents (60 years and over) White / Caucasian 17 74.5% Responsible for grandchildren6 25.5% Not responsible for grandchildrenWhite alone, not Hispanic / Latino 18 74.4% Responsible for grandchildren6 25.6% Not responsible for grandchildren