Races in Deerfield, Illinois (IL) Detailed Stats
Data:
Races - White alone (%)
Races - White alone (% change since 2000)
Races - Black alone (%)
Races - Black alone (% change since 2000)
Races - American Indian alone (%)
Races - American Indian alone (% change since 2000)
Races - Asian alone (%)
Races - Asian alone (% change since 2000)
Races - Hispanic (%)
Races - Hispanic (% change since 2000)
Races - Native Hawaiian and Other Pacific Islander alone (%)
Races - Native Hawaiian and Other Pacific Islander alone (% change since 2000)
Races - Two or more races(%)
Races - Two or more races(% change since 2000)
Races - Other race alone (%)
Races - Other race alone (% change since 2000)
Racial diversity
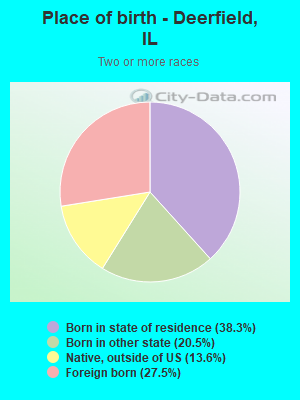
Place of birth - Born in state of residence (%)
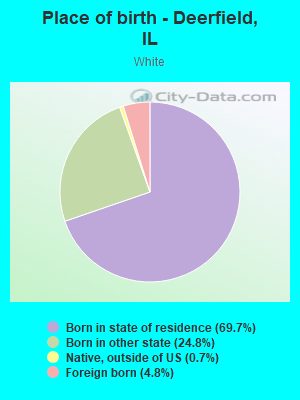
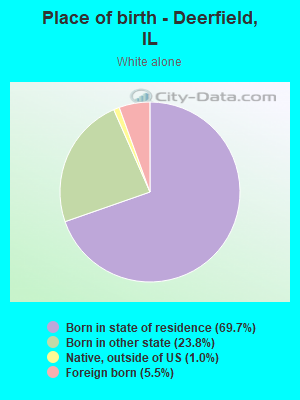
Place of birth - Born in state of residence (%) - White
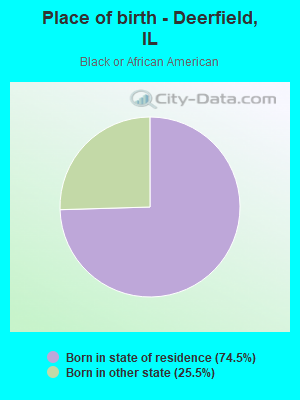
Place of birth - Born in state of residence (%) - Black or African American
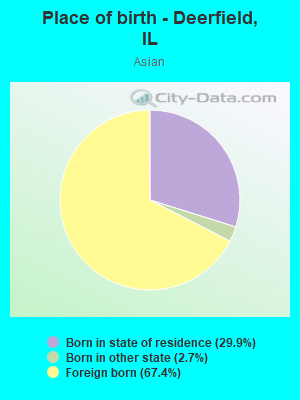
Place of birth - Born in state of residence (%) - Asian
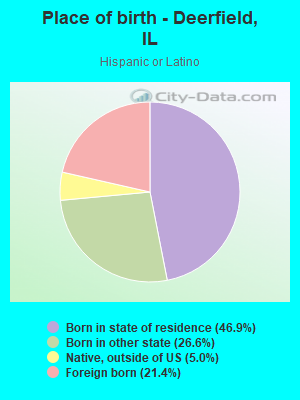
Place of birth - Born in state of residence (%) - Hispanic or Latino
Place of birth - Born in state of residence (%) - American Indian and Alaska Native
Place of birth - Born in state of residence (%) - Multirace
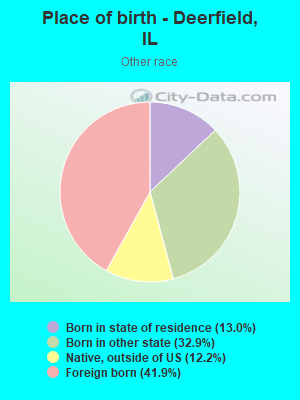
Place of birth - Born in state of residence (%) - Other Race
Place of birth - Born in other state (%)
Place of birth - Born in other state (%) - White
Place of birth - Born in other state (%) - Black or African American
Place of birth - Born in other state (%) - Asian
Place of birth - Born in other state (%) - Hispanic or Latino
Place of birth - Born in other state (%) - American Indian and Alaska Native
Place of birth - Born in other state (%) - Multirace
Place of birth - Born in other state (%) - Other Race
Place of birth - Native, outside of US (%)
Place of birth - Native, outside of US (%) - White
Place of birth - Native, outside of US (%) - Black or African American
Place of birth - Native, outside of US (%) - Asian
Place of birth - Native, outside of US (%) - Hispanic or Latino
Place of birth - Native, outside of US (%) - American Indian and Alaska Native
Place of birth - Native, outside of US (%) - Multirace
Place of birth - Native, outside of US (%) - Other Race
Place of birth - Foreign born (%)
Place of birth - Foreign born (%) - White
Place of birth - Foreign born (%) - Black or African American
Place of birth - Foreign born (%) - Asian
Place of birth - Foreign born (%) - Hispanic or Latino
Place of birth - Foreign born (%) - American Indian and Alaska Native
Place of birth - Foreign born (%) - Multirace
Place of birth - Foreign born (%) - Other Race
Residents speaking English at home (%)
Residents speaking English at home - Born in the United States (%)
Residents speaking English at home - Native, born elsewhere (%)
Residents speaking English at home - Foreign born (%)
Residents speaking Spanish at home (%)
Residents speaking Spanish at home - Born in the United States (%)
Residents speaking Spanish at home - Native, born elsewhere (%)
Residents speaking Spanish at home - Foreign born (%)
Residents speaking other language at home (%)
Residents speaking other language at home - Born in the United States (%)
Residents speaking other language at home - Native, born elsewhere (%)
Residents speaking other language at home - Foreign born (%)
Marital status - Never married (%)
Marital status - Now married (%)
Marital status - Separated (%)
Marital status - Widowed (%)
Marital status - Divorced (%)
Ancestries Reported - Arab (%)
Ancestries Reported - Czech (%)
Ancestries Reported - Danish (%)
Ancestries Reported - Dutch (%)
Ancestries Reported - English (%)
Ancestries Reported - French (%)
Ancestries Reported - French Canadian (%)
Ancestries Reported - German (%)
Ancestries Reported - Greek (%)
Ancestries Reported - Hungarian (%)
Ancestries Reported - Irish (%)
Ancestries Reported - Italian (%)
Ancestries Reported - Lithuanian (%)
Ancestries Reported - Norwegian (%)
Ancestries Reported - Polish (%)
Ancestries Reported - Portuguese (%)
Ancestries Reported - Russian (%)
Ancestries Reported - Scotch-Irish (%)
Ancestries Reported - Scottish (%)
Ancestries Reported - Slovak (%)
Ancestries Reported - Subsaharan African (%)
Ancestries Reported - Swedish (%)
Ancestries Reported - Swiss (%)
Ancestries Reported - Ukrainian (%)
Ancestries Reported - United States (%)
Ancestries Reported - Welsh (%)
Ancestries Reported - West Indian (%)
Ancestries Reported - Other (%)
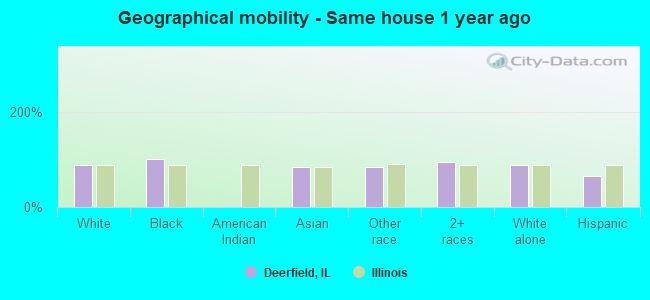
Geographical mobility - Same house 1 year ago (%)
Geographical mobility - Same house 1 year ago (%) - White
Geographical mobility - Same house 1 year ago (%) - Black or African American
Geographical mobility - Same house 1 year ago (%) - Asian
Geographical mobility - Same house 1 year ago (%) - Hispanic or Latino
Geographical mobility - Same house 1 year ago (%) - American Indian and Alaska Native
Geographical mobility - Same house 1 year ago (%) - Multirace
Geographical mobility - Same house 1 year ago (%) - Other Race
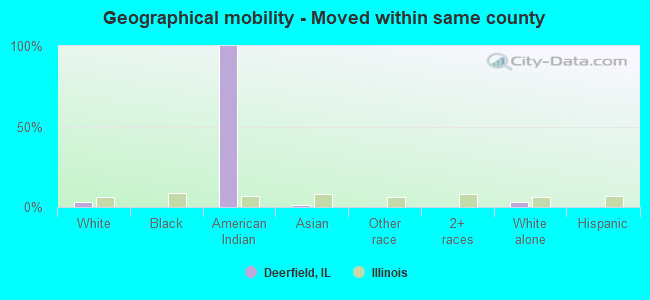
Geographical mobility - Moved within same county (%)
Geographical mobility - Moved within same county (%) - White
Geographical mobility - Moved within same county (%) - Black or African American
Geographical mobility - Moved within same county (%) - Asian
Geographical mobility - Moved within same county (%) - Hispanic or Latino
Geographical mobility - Moved within same county (%) - American Indian and Alaska Native
Geographical mobility - Moved within same county (%) - Multirace
Geographical mobility - Moved within same county (%) - Other Race
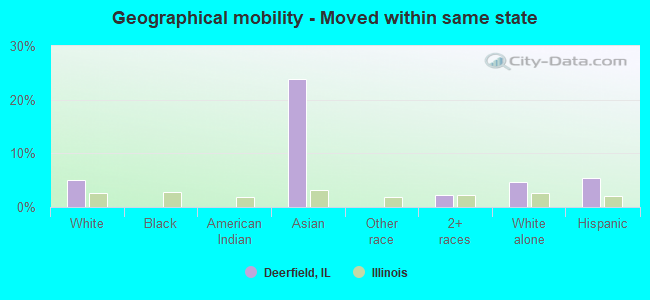
Geographical mobility - Moved from different county within same state (%)
Geographical mobility - Moved from different county within same state (%) - White
Geographical mobility - Moved from different county within same state (%) - Black or African American
Geographical mobility - Moved from different county within same state (%) - Asian
Geographical mobility - Moved from different county within same state (%) - Hispanic or Latino
Geographical mobility - Moved from different county within same state (%) - American Indian and Alaska Native
Geographical mobility - Moved from different county within same state (%) - Multirace
Geographical mobility - Moved from different county within same state (%) - Other Race
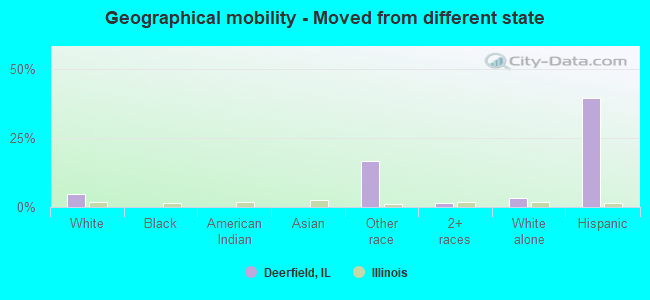
Geographical mobility - Moved from different state (%)
Geographical mobility - Moved from different state (%) - White
Geographical mobility - Moved from different state (%) - Black or African American
Geographical mobility - Moved from different state (%) - Asian
Geographical mobility - Moved from different state (%) - Hispanic or Latino
Geographical mobility - Moved from different state (%) - American Indian and Alaska Native
Geographical mobility - Moved from different state (%) - Multirace
Geographical mobility - Moved from different state (%) - Other Race
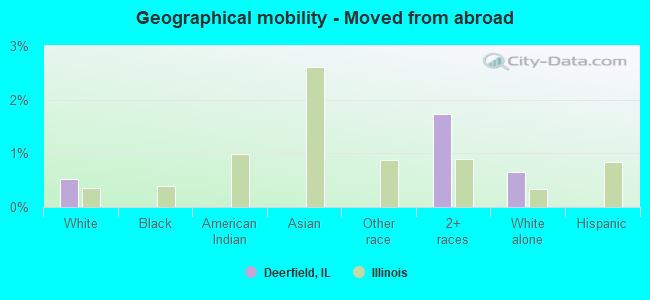
Geographical mobility - Moved from abroad (%)
Geographical mobility - Moved from abroad (%) - White
Geographical mobility - Moved from abroad (%) - Black or African American
Geographical mobility - Moved from abroad (%) - Asian
Geographical mobility - Moved from abroad (%) - Hispanic or Latino
Geographical mobility - Moved from abroad (%) - American Indian and Alaska Native
Geographical mobility - Moved from abroad (%) - Multirace
Geographical mobility - Moved from abroad (%) - Other Race
Place of birth for the foreign-born population - Ireland (%)
Place of birth for the foreign-born population - Denmark (%)
Place of birth for the foreign-born population - Norway (%)
Place of birth for the foreign-born population - Sweden (%)
Place of birth for the foreign-born population - United Kingdom (%)
Place of birth for the foreign-born population - England (%)
Place of birth for the foreign-born population - Scotland (%)
Place of birth for the foreign-born population - Other Northern Europe (%)
Place of birth for the foreign-born population - Austria (%)
Place of birth for the foreign-born population - Belgium (%)
Place of birth for the foreign-born population - France (%)
Place of birth for the foreign-born population - Germany (%)
Place of birth for the foreign-born population - Netherlands (%)
Place of birth for the foreign-born population - Switzerland (%)
Place of birth for the foreign-born population - Other Western Europe (%)
Place of birth for the foreign-born population - Greece (%)
Place of birth for the foreign-born population - Italy (%)
Place of birth for the foreign-born population - Portugal (%)
Place of birth for the foreign-born population - Spain (%)
Place of birth for the foreign-born population - Other Southern Europe (%)
Place of birth for the foreign-born population - Albania (%)
Place of birth for the foreign-born population - Belarus (%)
Place of birth for the foreign-born population - Bosnia and Herzegovina (%)
Place of birth for the foreign-born population - Bulgaria (%)
Place of birth for the foreign-born population - Croatia (%)
Place of birth for the foreign-born population - Czechoslovakia (%)
Place of birth for the foreign-born population - Hungary (%)
Place of birth for the foreign-born population - Latvia (%)
Place of birth for the foreign-born population - Lithuania (%)
Place of birth for the foreign-born population - North Macedonia (Macedonia) (%)
Place of birth for the foreign-born population - Moldova (%)
Place of birth for the foreign-born population - Poland (%)
Place of birth for the foreign-born population - Romania (%)
Place of birth for the foreign-born population - Russia (%)
Place of birth for the foreign-born population - Serbia (%)
Place of birth for the foreign-born population - Ukraine (%)
Place of birth for the foreign-born population - Other Eastern Europe (%)
Place of birth for the foreign-born population - China (%)
Place of birth for the foreign-born population - Hong Kong (%)
Place of birth for the foreign-born population - Taiwan (%)
Place of birth for the foreign-born population - Japan (%)
Place of birth for the foreign-born population - Korea (%)
Place of birth for the foreign-born population - Other Eastern Asia (%)
Place of birth for the foreign-born population - Afghanistan (%)
Place of birth for the foreign-born population - Bangladesh (%)
Place of birth for the foreign-born population - India (%)
Place of birth for the foreign-born population - Iran (%)
Place of birth for the foreign-born population - Kazakhstan (%)
Place of birth for the foreign-born population - Nepal (%)
Place of birth for the foreign-born population - Pakistan (%)
Place of birth for the foreign-born population - Sri Lanka (%)
Place of birth for the foreign-born population - Uzbekistan (%)
Place of birth for the foreign-born population - Other South Central Asia (%)
Place of birth for the foreign-born population - Burma (%)
Place of birth for the foreign-born population - Cambodia (%)
Place of birth for the foreign-born population - Indonesia (%)
Place of birth for the foreign-born population - Laos (%)
Place of birth for the foreign-born population - Malaysia (%)
Place of birth for the foreign-born population - Philippines (%)
Place of birth for the foreign-born population - Singapore (%)
Place of birth for the foreign-born population - Thailand (%)
Place of birth for the foreign-born population - Vietnam (%)
Place of birth for the foreign-born population - Other South Eastern Asia (%)
Place of birth for the foreign-born population - Armenia (%)
Place of birth for the foreign-born population - Iraq (%)
Place of birth for the foreign-born population - Israel (%)
Place of birth for the foreign-born population - Jordan (%)
Place of birth for the foreign-born population - Kuwait (%)
Place of birth for the foreign-born population - Lebanon (%)
Place of birth for the foreign-born population - Saudi Arabia (%)
Place of birth for the foreign-born population - Syria (%)
Place of birth for the foreign-born population - Turkey (%)
Place of birth for the foreign-born population - Yemen (%)
Place of birth for the foreign-born population - Other Western Asia (%)
Place of birth for the foreign-born population - Eritrea (%)
Place of birth for the foreign-born population - Ethiopia (%)
Place of birth for the foreign-born population - Kenya (%)
Place of birth for the foreign-born population - Somalia (%)
Place of birth for the foreign-born population - Uganda (%)
Place of birth for the foreign-born population - Zimbabwe (%)
Place of birth for the foreign-born population - Other Eastern Africa (%)
Place of birth for the foreign-born population - Cameroon (%)
Place of birth for the foreign-born population - Congo (%)
Place of birth for the foreign-born population - Democratic Republic of Congo (Zaire) (%)
Place of birth for the foreign-born population - Other Middle Africa (%)
Place of birth for the foreign-born population - Egypt (%)
Place of birth for the foreign-born population - Morocco (%)
Place of birth for the foreign-born population - Sudan (%)
Place of birth for the foreign-born population - Other Northern Africa (%)
Place of birth for the foreign-born population - South Africa (%)
Place of birth for the foreign-born population - Other Southern Africa (%)
Place of birth for the foreign-born population - Cabo Verde (%)
Place of birth for the foreign-born population - Ghana (%)
Place of birth for the foreign-born population - Liberia (%)
Place of birth for the foreign-born population - Nigeria (%)
Place of birth for the foreign-born population - Senegal (%)
Place of birth for the foreign-born population - Sierra Leone (%)
Place of birth for the foreign-born population - Other Western Africa (%)
Place of birth for the foreign-born population - Australia (%)
Place of birth for the foreign-born population - New Zealand (%)
Place of birth for the foreign-born population - Fiji (%)
Place of birth for the foreign-born population - Micronesia (%)
Place of birth for the foreign-born population - Bahamas (%)
Place of birth for the foreign-born population - Barbados (%)
Place of birth for the foreign-born population - Cuba (%)
Place of birth for the foreign-born population - Dominica (%)
Place of birth for the foreign-born population - Dominican Republic (%)
Place of birth for the foreign-born population - Grenada (%)
Place of birth for the foreign-born population - Haiti (%)
Place of birth for the foreign-born population - Jamaica (%)
Place of birth for the foreign-born population - St. Vincent and the Grenadines (%)
Place of birth for the foreign-born population - Trinidad and Tobago (%)
Place of birth for the foreign-born population - West Indies (%)
Place of birth for the foreign-born population - Other Caribbean (%)
Place of birth for the foreign-born population - Belize (%)
Place of birth for the foreign-born population - Costa Rica (%)
Place of birth for the foreign-born population - El Salvador (%)
Place of birth for the foreign-born population - Guatemala (%)
Place of birth for the foreign-born population - Honduras (%)
Place of birth for the foreign-born population - Mexico (%)
Place of birth for the foreign-born population - Nicaragua (%)
Place of birth for the foreign-born population - Panama (%)
Place of birth for the foreign-born population - Other Central America (%)
Place of birth for the foreign-born population - Argentina (%)
Place of birth for the foreign-born population - Bolivia (%)
Place of birth for the foreign-born population - Brazil (%)
Place of birth for the foreign-born population - Chile (%)
Place of birth for the foreign-born population - Colombia (%)
Place of birth for the foreign-born population - Ecuador (%)
Place of birth for the foreign-born population - Guyana (%)
Place of birth for the foreign-born population - Peru (%)
Place of birth for the foreign-born population - Uruguay (%)
Place of birth for the foreign-born population - Venezuela (%)
Place of birth for the foreign-born population - Other South America (%)
Place of birth for the foreign-born population - Canada (%)
Place of birth for the foreign-born population - Other Northern America (%)
Place of birth for the foreign-born population - Other (%)
Latest news about races in Deerfield, IL collected exclusively by city-data.com from local newspapers, TV, and radio stations
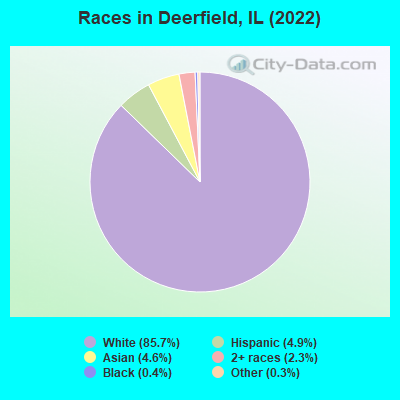
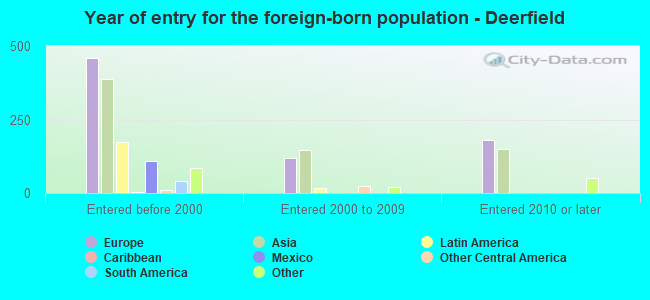
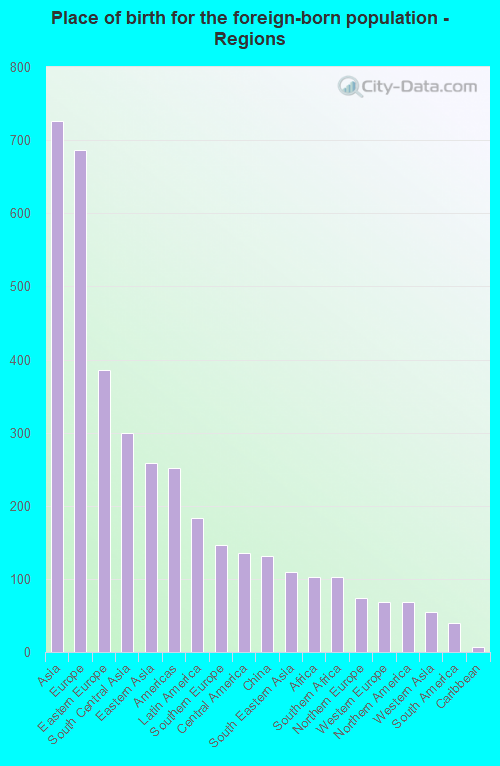
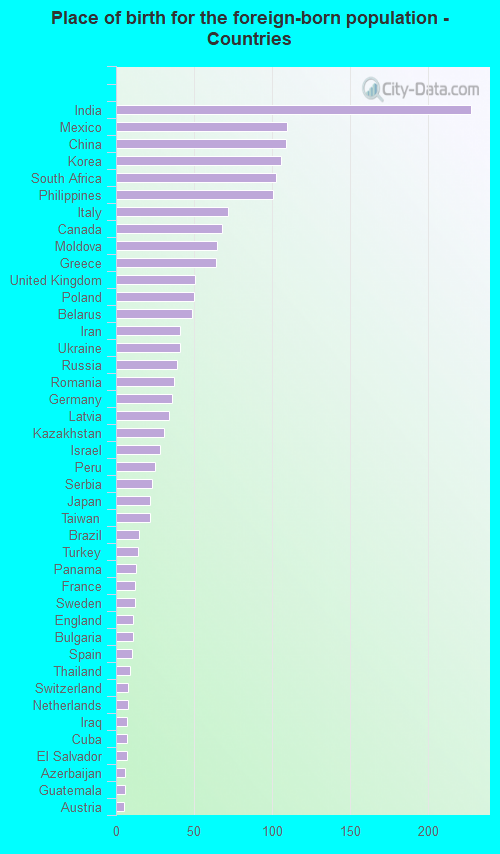
According to 2022 data, the most numerous races in Deerfield, IL are White alone (16,347 residents), Hispanic (936 residents), and Black alone (71 residents). 86.9% of Deerfield residents speak English at home. 9.3% of Deerfield, IL residents are foreign-born (3.8% born in Asia, 3.6% born in Europe, 0.9% born in Latin America), which is 51.1% less than the foreign-born rate of 14.0% across the entire state of Illinois.
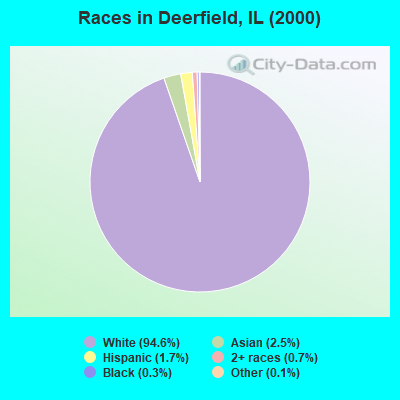
Race distribution in Deerfield
2000 2022
8,424,140 67.8% White alone 1,856,152 14.9% Black alone 1,530,262 12.3% Hispanic 419,916 3.4% Asian alone 153,996 1.2% Two or more races 13,479 0.1% Other race alone 18,232 0.1% American Indian alone 3,116 0.03% Native Hawaiian and Other
7,356,301 58.5% White alone 2,299,726 18.3% Hispanic 1,660,423 13.2% Black alone 747,296 5.9% Asian alone 458,599 3.6% Two or more races 45,386 0.4% Other race alone 10,405 0.08% American Indian alone 3,896 0.03% Native Hawaiian and Other
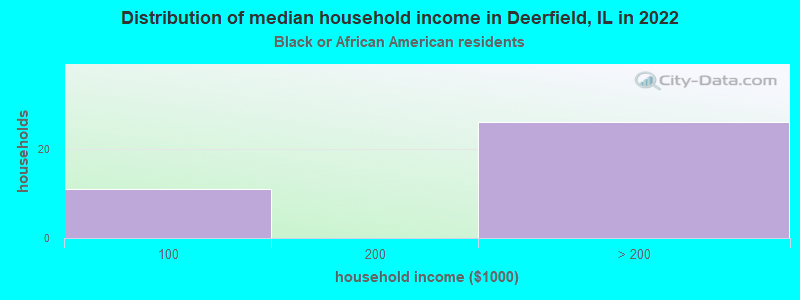
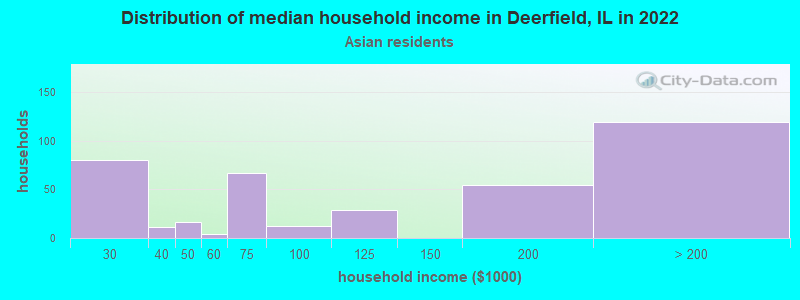
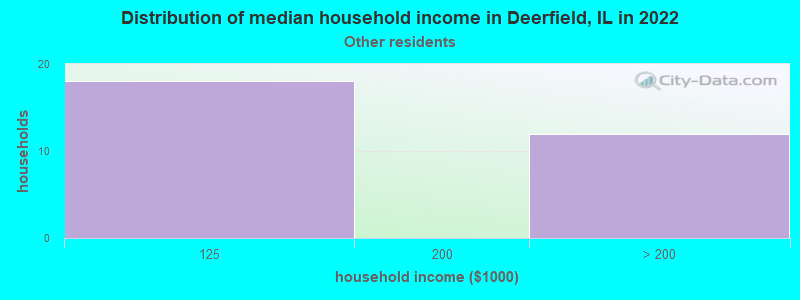
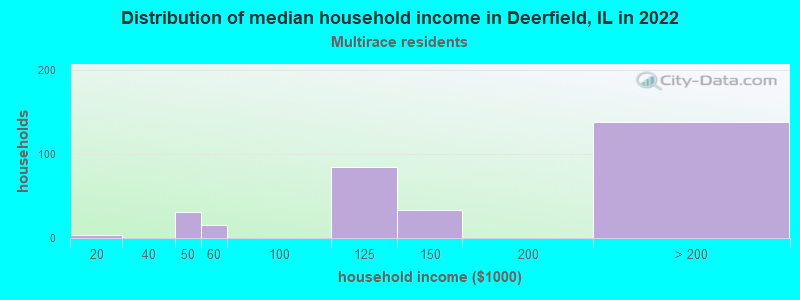
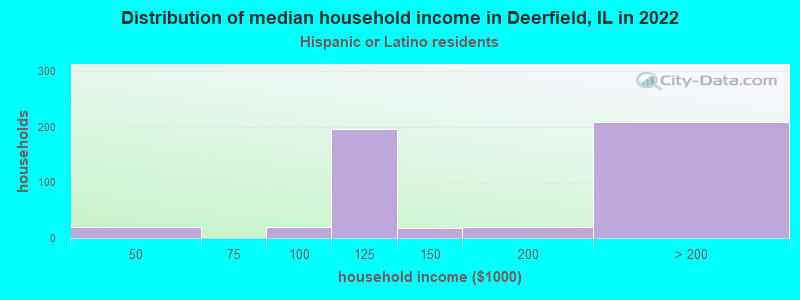
Income and house value in Deerfield Median household income in 2022 $182,710 White non-Hispanic householdersover $200,000 Black householders$174,230 Asian householders$152,570 Hispanic or Latino race householdersMedian 2022 house value $637,504 White Non-Hispanic householders $861,023 Asian householders$840,296 Some other race householders$840,296 Hispanic or Latino householders
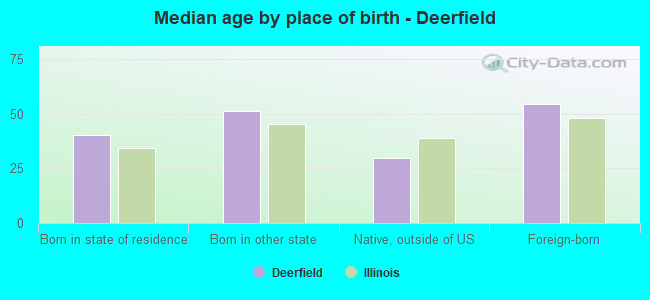
Median age by race in Deerfield
46.5 Median age for White residents45.1 48.5 37.6 Median age for Black or African American residents26.1 52.5 -657,243,815.6 Median age for American Indian / Alaska Native residents-671,532,846.0 -638,251,365.5 46.5 Median age for Asian residents48.0 44.6 -593,236,714.4 Median age for Native Hawaiian / Pacific Islander residents-658,536,584.7 -576,015,108.0 44.5 Median age for Other race residents27.8 50.1 30.7 Median age for Two or more races residents17.7 49.3 45.5 Median age for White alone residents44.5 47.9 41.4 Median age for Hispanic or Latino residents16.8 43.9
Owner/renter occupied households by race in Deerfield
House owners and renters - White residents 5,328 81.8% Owner occupied1,183 18.2% Renter occupiedHouse owners and renters - Black or African American residents 11 27.6% Owner occupied29 72.4% Renter occupiedHouse owners and renters - Asian residents 217 65.4% Owner occupied115 34.6% Renter occupiedHouse owners and renters - Other race residents 23 100.0% Owner occupiedHouse owners and renters - Two or more races residents 267 87.8% Owner occupied37 12.2% Renter occupiedHouse owners and renters - White alone residents 5,456 84.4% Owner occupied1,010 15.6% Renter occupiedHouse owners and renters - Hispanic or Latino residents 179 41.7% Owner occupied250 58.3% Renter occupied
Language usage in Deerfield
English speakers - Total 86.9% of residents of Deerfield speak English at home.
2.7% of residents speak Spanish at home 411 82.0% Speak English very well90 18.0% Speak English less than very well9.7% of residents speak other language at home 1,286 72.0% Speak English very well501 28.0% Speak English less than very well
English speakers - Born in the United States 93.5% of residents of Deerfield speak English at home.
3.4% of residents speak Spanish at home 140 95.2% Speak English very well7 4.8% Speak English less than very well2.8% of residents speak other language at home 122 100.0% Speak English very well
English speakers - Native, born elsewhere 59.8% of residents of Deerfield speak English at home.
16.2% of residents speak Spanish at home 37 100.0% Speak English very well27.1% of residents speak other language at home 35 56.5% Speak English very well27 43.5% Speak English less than very well
English speakers - Foreign-born 25.4% of residents of Deerfield speak English at home.
7.3% of residents speak Spanish at home 62 46.3% Speak English very well72 53.7% Speak English less than very well68.0% of residents speak other language at home 779 62.2% Speak English very well474 37.8% Speak English less than very well
White (Caucasian) - Speak only English Native:
99.4% (14,638)Foreign-born:
38.5% (295)
White (Caucasian) - Speak another language Native:
2.6% (382)Foreign-born:
65.3% (501)
Asian - Speak only English Native:
35.3% (91)Foreign-born:
13.6% (81)
Asian - Speak another language Native:
71.1% (183)Foreign-born:
85.9% (511)
Other race - Speak only English Native:
100.0% (54)Foreign-born:
63.1% (26)
Two or more races - Speak only English Native:
60.2% (309)Foreign-born:
21.7% (52)
Two or more races - Speak another language Native:
38.9% (199)Foreign-born:
75.6% (181)
White alone - Speak only English Native:
98.0% (14,568)Foreign-born:
31.1% (282)
White alone - Speak another language Native:
2.2% (324)Foreign-born:
69.0% (625)
Hispanic or Latino - Speak only English Native:
53.7% (375)Foreign-born:
24.6% (50)
Hispanic or Latino - Speak another language Native:
47.6% (333)Foreign-born:
81.1% (165)
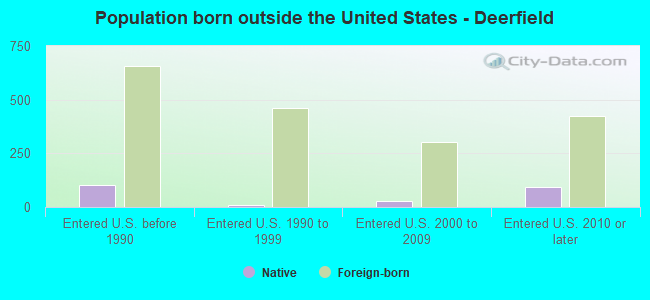
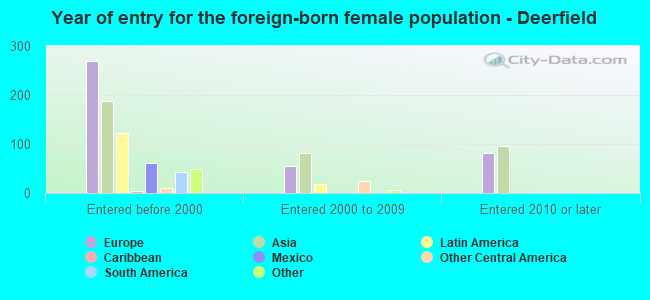
Foreign-born residents in Deerfield 1,767 residents are foreign born (3.8% Asia , 3.6% Europe , 0.9% Latin America ).
This city:
9.3%Illinois:
14.1%
Marital status for residents in Deerfield Marital status - White (Caucasian) population 15 years and over
Males 26.1% Never married66.1% Now married0.5% Separated1.8% Widowed5.5% DivorcedFemales 17.8% Never married63.7% Now married0.3% Separated8.3% Widowed10.0% DivorcedWomen who gave birth in the past 12 months Now married:
100.0% (99)Unmarried:
0.0% (0)
Women who did not give birth in the past 12 months Now married:
58.9% (1,677)Unmarried:
41.1% (1,168)
Marital status - Black or African American population 15 years and over
Males 100.0% Never married0.0% Now married0.0% Separated0.0% Widowed0.0% DivorcedFemales 0.0% Never married77.1% Now married0.0% Separated0.0% Widowed22.9% DivorcedWomen who did not give birth in the past 12 months Now married:
61.9% (12)Unmarried:
38.1% (7)
Marital status - Asian population 15 years and over
Males 20.4% Never married79.6% Now married0.0% Separated0.0% Widowed0.0% DivorcedFemales 21.4% Never married67.8% Now married0.0% Separated6.3% Widowed4.5% DivorcedWomen who gave birth in the past 12 months Now married:
100.0% (14)Unmarried:
0.0% (0)
Women who did not give birth in the past 12 months Now married:
57.2% (124)Unmarried:
42.8% (93)
Marital status - Other race population 15 years and over
Males 71.0% Never married29.0% Now married0.0% Separated0.0% Widowed0.0% DivorcedFemales 16.7% Never married83.3% Now married0.0% Separated0.0% Widowed0.0% DivorcedWomen who did not give birth in the past 12 months Now married:
61.9% (13)Unmarried:
38.1% (8)
Marital status - Two or more races population 15 years and over
Males 32.7% Never married52.6% Now married0.0% Separated0.0% Widowed14.7% DivorcedFemales 16.0% Never married65.3% Now married0.0% Separated5.3% Widowed13.3% DivorcedWomen who gave birth in the past 12 months Now married:
100.0% (7)Unmarried:
0.0% (0)
Women who did not give birth in the past 12 months Now married:
44.1% (76)Unmarried:
55.9% (97)
Marital status - White alone, not Hispanic / Latino population 15 years and over
Males 26.2% Never married66.3% Now married0.5% Separated1.8% Widowed5.2% DivorcedFemales 18.0% Never married62.7% Now married0.3% Separated8.6% Widowed10.4% DivorcedWomen who gave birth in the past 12 months Now married:
100.0% (90)Unmarried:
0.0% (0)
Women who did not give birth in the past 12 months Now married:
58.5% (1,703)Unmarried:
41.5% (1,209)
Marital status - Hispanic or Latino population 15 years and over
Males 25.8% Never married55.4% Now married0.0% Separated0.0% Widowed18.7% DivorcedFemales 16.2% Never married83.8% Now married0.0% Separated0.0% Widowed0.0% DivorcedWomen who gave birth in the past 12 months Now married:
100.0% (17)Unmarried:
0.0% (0)
Women who did not give birth in the past 12 months Now married:
65.1% (124)Unmarried:
34.9% (67)
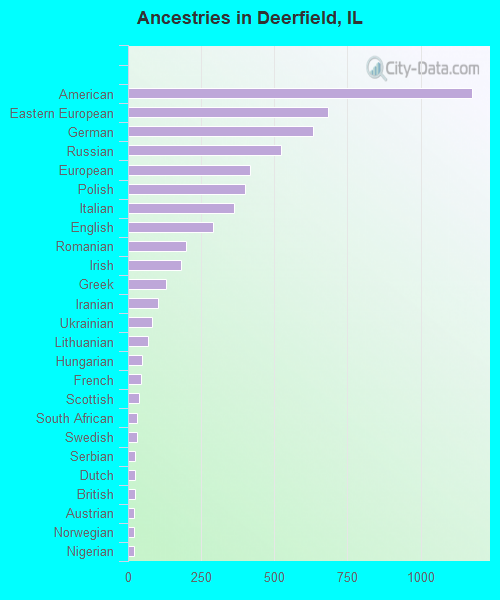
Ancestries in Deerfield
1,175 14.7% American684 8.5% Eastern European631 7.9% German522 6.5% Russian418 5.2% European400 5.0% Polish362 4.5% Italian289 3.6% English199 2.5% Romanian181 2.3% Irish131 1.6% Greek101 1.3% Iranian83 1.0% Ukrainian69 0.9% Lithuanian49 0.6% Hungarian43 0.5% French37 0.5% Scottish32 0.4% South African30 0.4% Swedish25 0.3% Serbian24 0.3% Dutch24 0.3% British22 0.3% Austrian20 0.2% Norwegian19 0.2% Nigerian17 0.2% Scandinavian15 0.2% Assyrian13 0.2% Turkish12 0.1% Jamaican12 0.1% Finnish11 0.1% Bulgarian9 0.1% Canadian8 0.10% Croatian8 0.10% Lebanese8 0.10% Swiss7 0.09% Northern European7 0.09% Armenian7 0.09% Arab7 0.09% Israeli7 0.09% Scotch-Irish6 0.07% French Canadian6 0.07% Slovak
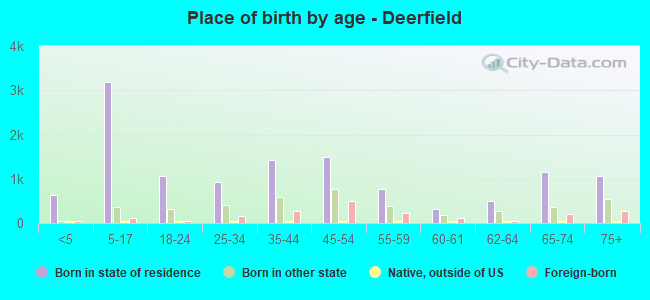
Children Nativity (place of birth) in Deerfield
Children under 6 years - Living with two parents Both parents native 606 100.0% NativeBoth parents foreign-born 110 88.2% Native15 11.8% Foreign-bornOne native, one foreign-born parent 78 100.0% NativeChildren under 6 years - Living with one parent Native parent 72 100.0% NativeForeign-born parent 5 100.0% NativeChildren 6 to 17 years - Living with two parents Both parents native 2,437 99.5% Native11 0.5% Foreign-bornBoth parents foreign-born 279 94.6% Native16 5.4% Foreign-bornOne native, one foreign-born parent 346 100.0% NativeChildren 6 to 17 years - Living with one parent Native parent 255 100.0% NativeForeign-born parent 104 58.3% Native74 41.7% Foreign-born
Grandparents responsible for own grandchildren in Deerfield
Grandparents (30 to 59 years) Asian 5 100.0% Responsible for grandchildren
Grandparents (60 years and over) Asian 32 100.0% Not responsible for grandchildren