Races in Drexel Heights, Arizona (AZ) Detailed Stats
Data:
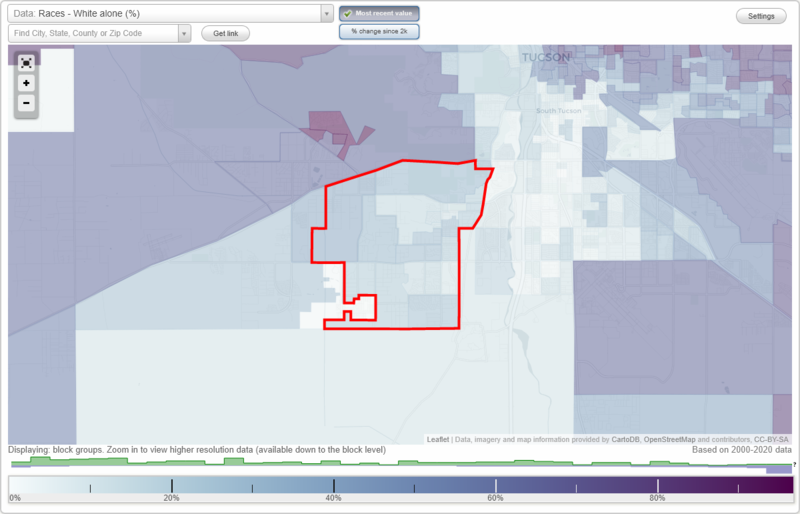
Races - White alone (%)
Races - White alone (% change since 2000)
Races - Black alone (%)
Races - Black alone (% change since 2000)
Races - American Indian alone (%)
Races - American Indian alone (% change since 2000)
Races - Asian alone (%)
Races - Asian alone (% change since 2000)
Races - Hispanic (%)
Races - Hispanic (% change since 2000)
Races - Native Hawaiian and Other Pacific Islander alone (%)
Races - Native Hawaiian and Other Pacific Islander alone (% change since 2000)
Races - Two or more races(%)
Races - Two or more races(% change since 2000)
Races - Other race alone (%)
Races - Other race alone (% change since 2000)
Racial diversity
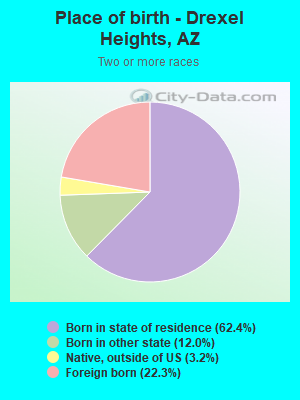
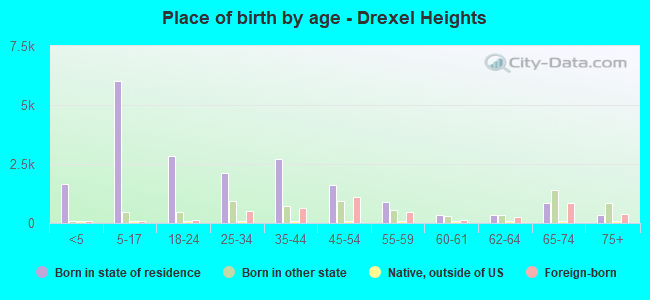
Place of birth - Born in state of residence (%)
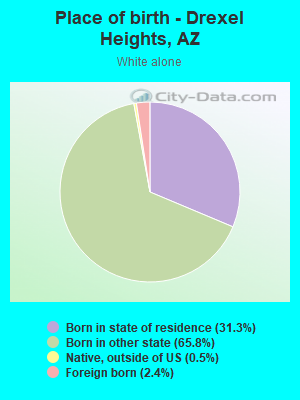
Place of birth - Born in state of residence (%) - White
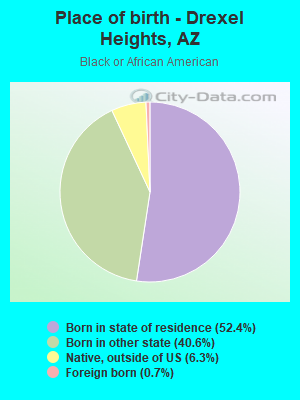
Place of birth - Born in state of residence (%) - Black or African American
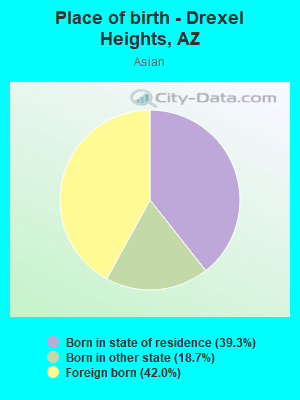
Place of birth - Born in state of residence (%) - Asian
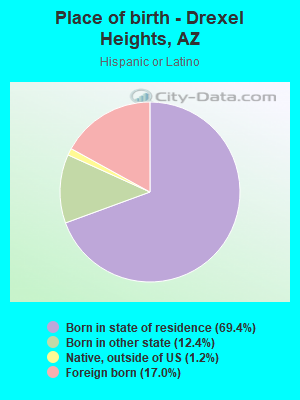
Place of birth - Born in state of residence (%) - Hispanic or Latino
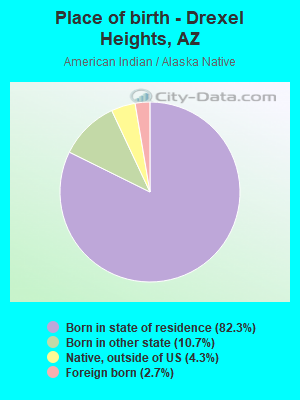
Place of birth - Born in state of residence (%) - American Indian and Alaska Native
Place of birth - Born in state of residence (%) - Multirace
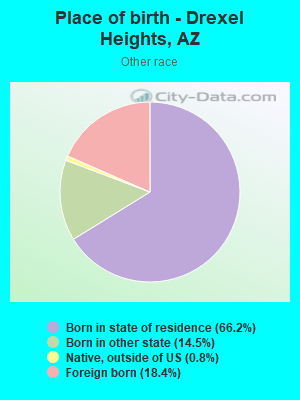
Place of birth - Born in state of residence (%) - Other Race
Place of birth - Born in other state (%)
Place of birth - Born in other state (%) - White
Place of birth - Born in other state (%) - Black or African American
Place of birth - Born in other state (%) - Asian
Place of birth - Born in other state (%) - Hispanic or Latino
Place of birth - Born in other state (%) - American Indian and Alaska Native
Place of birth - Born in other state (%) - Multirace
Place of birth - Born in other state (%) - Other Race
Place of birth - Native, outside of US (%)
Place of birth - Native, outside of US (%) - White
Place of birth - Native, outside of US (%) - Black or African American
Place of birth - Native, outside of US (%) - Asian
Place of birth - Native, outside of US (%) - Hispanic or Latino
Place of birth - Native, outside of US (%) - American Indian and Alaska Native
Place of birth - Native, outside of US (%) - Multirace
Place of birth - Native, outside of US (%) - Other Race
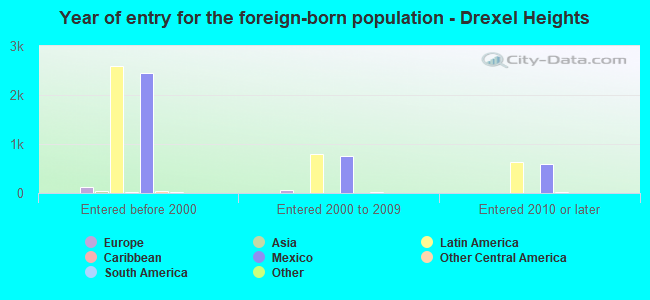
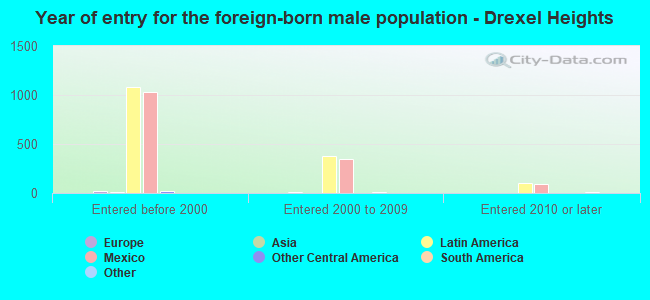
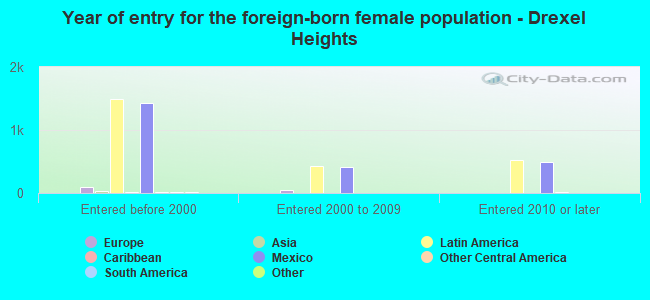
Place of birth - Foreign born (%)
Place of birth - Foreign born (%) - White
Place of birth - Foreign born (%) - Black or African American
Place of birth - Foreign born (%) - Asian
Place of birth - Foreign born (%) - Hispanic or Latino
Place of birth - Foreign born (%) - American Indian and Alaska Native
Place of birth - Foreign born (%) - Multirace
Place of birth - Foreign born (%) - Other Race
Residents speaking English at home (%)
Residents speaking English at home - Born in the United States (%)
Residents speaking English at home - Native, born elsewhere (%)
Residents speaking English at home - Foreign born (%)
Residents speaking Spanish at home (%)
Residents speaking Spanish at home - Born in the United States (%)
Residents speaking Spanish at home - Native, born elsewhere (%)
Residents speaking Spanish at home - Foreign born (%)
Residents speaking other language at home (%)
Residents speaking other language at home - Born in the United States (%)
Residents speaking other language at home - Native, born elsewhere (%)
Residents speaking other language at home - Foreign born (%)
Marital status - Never married (%)
Marital status - Now married (%)
Marital status - Separated (%)
Marital status - Widowed (%)
Marital status - Divorced (%)
Ancestries Reported - Arab (%)
Ancestries Reported - Czech (%)
Ancestries Reported - Danish (%)
Ancestries Reported - Dutch (%)
Ancestries Reported - English (%)
Ancestries Reported - French (%)
Ancestries Reported - French Canadian (%)
Ancestries Reported - German (%)
Ancestries Reported - Greek (%)
Ancestries Reported - Hungarian (%)
Ancestries Reported - Irish (%)
Ancestries Reported - Italian (%)
Ancestries Reported - Lithuanian (%)
Ancestries Reported - Norwegian (%)
Ancestries Reported - Polish (%)
Ancestries Reported - Portuguese (%)
Ancestries Reported - Russian (%)
Ancestries Reported - Scotch-Irish (%)
Ancestries Reported - Scottish (%)
Ancestries Reported - Slovak (%)
Ancestries Reported - Subsaharan African (%)
Ancestries Reported - Swedish (%)
Ancestries Reported - Swiss (%)
Ancestries Reported - Ukrainian (%)
Ancestries Reported - United States (%)
Ancestries Reported - Welsh (%)
Ancestries Reported - West Indian (%)
Ancestries Reported - Other (%)
Geographical mobility - Same house 1 year ago (%)
Geographical mobility - Same house 1 year ago (%) - White
Geographical mobility - Same house 1 year ago (%) - Black or African American
Geographical mobility - Same house 1 year ago (%) - Asian
Geographical mobility - Same house 1 year ago (%) - Hispanic or Latino
Geographical mobility - Same house 1 year ago (%) - American Indian and Alaska Native
Geographical mobility - Same house 1 year ago (%) - Multirace
Geographical mobility - Same house 1 year ago (%) - Other Race
Geographical mobility - Moved within same county (%)
Geographical mobility - Moved within same county (%) - White
Geographical mobility - Moved within same county (%) - Black or African American
Geographical mobility - Moved within same county (%) - Asian
Geographical mobility - Moved within same county (%) - Hispanic or Latino
Geographical mobility - Moved within same county (%) - American Indian and Alaska Native
Geographical mobility - Moved within same county (%) - Multirace
Geographical mobility - Moved within same county (%) - Other Race
Geographical mobility - Moved from different county within same state (%)
Geographical mobility - Moved from different county within same state (%) - White
Geographical mobility - Moved from different county within same state (%) - Black or African American
Geographical mobility - Moved from different county within same state (%) - Asian
Geographical mobility - Moved from different county within same state (%) - Hispanic or Latino
Geographical mobility - Moved from different county within same state (%) - American Indian and Alaska Native
Geographical mobility - Moved from different county within same state (%) - Multirace
Geographical mobility - Moved from different county within same state (%) - Other Race
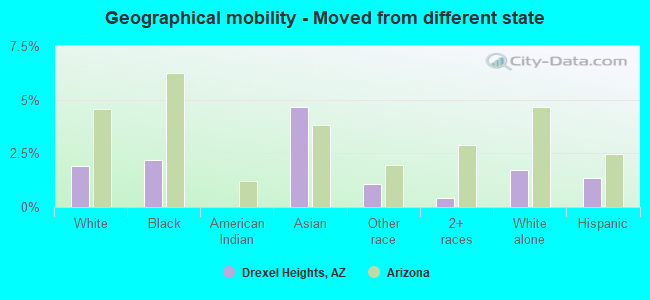
Geographical mobility - Moved from different state (%)
Geographical mobility - Moved from different state (%) - White
Geographical mobility - Moved from different state (%) - Black or African American
Geographical mobility - Moved from different state (%) - Asian
Geographical mobility - Moved from different state (%) - Hispanic or Latino
Geographical mobility - Moved from different state (%) - American Indian and Alaska Native
Geographical mobility - Moved from different state (%) - Multirace
Geographical mobility - Moved from different state (%) - Other Race
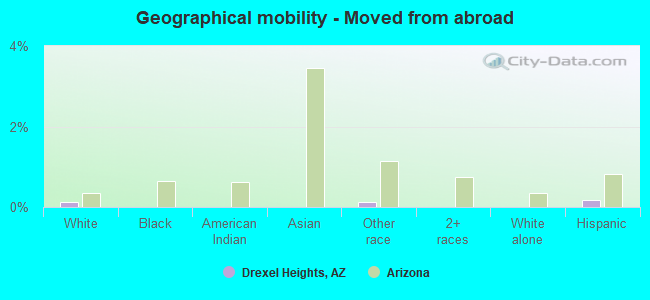
Geographical mobility - Moved from abroad (%)
Geographical mobility - Moved from abroad (%) - White
Geographical mobility - Moved from abroad (%) - Black or African American
Geographical mobility - Moved from abroad (%) - Asian
Geographical mobility - Moved from abroad (%) - Hispanic or Latino
Geographical mobility - Moved from abroad (%) - American Indian and Alaska Native
Geographical mobility - Moved from abroad (%) - Multirace
Geographical mobility - Moved from abroad (%) - Other Race
Place of birth for the foreign-born population - Ireland (%)
Place of birth for the foreign-born population - Denmark (%)
Place of birth for the foreign-born population - Norway (%)
Place of birth for the foreign-born population - Sweden (%)
Place of birth for the foreign-born population - United Kingdom (%)
Place of birth for the foreign-born population - England (%)
Place of birth for the foreign-born population - Scotland (%)
Place of birth for the foreign-born population - Other Northern Europe (%)
Place of birth for the foreign-born population - Austria (%)
Place of birth for the foreign-born population - Belgium (%)
Place of birth for the foreign-born population - France (%)
Place of birth for the foreign-born population - Germany (%)
Place of birth for the foreign-born population - Netherlands (%)
Place of birth for the foreign-born population - Switzerland (%)
Place of birth for the foreign-born population - Other Western Europe (%)
Place of birth for the foreign-born population - Greece (%)
Place of birth for the foreign-born population - Italy (%)
Place of birth for the foreign-born population - Portugal (%)
Place of birth for the foreign-born population - Spain (%)
Place of birth for the foreign-born population - Other Southern Europe (%)
Place of birth for the foreign-born population - Albania (%)
Place of birth for the foreign-born population - Belarus (%)
Place of birth for the foreign-born population - Bosnia and Herzegovina (%)
Place of birth for the foreign-born population - Bulgaria (%)
Place of birth for the foreign-born population - Croatia (%)
Place of birth for the foreign-born population - Czechoslovakia (%)
Place of birth for the foreign-born population - Hungary (%)
Place of birth for the foreign-born population - Latvia (%)
Place of birth for the foreign-born population - Lithuania (%)
Place of birth for the foreign-born population - North Macedonia (Macedonia) (%)
Place of birth for the foreign-born population - Moldova (%)
Place of birth for the foreign-born population - Poland (%)
Place of birth for the foreign-born population - Romania (%)
Place of birth for the foreign-born population - Russia (%)
Place of birth for the foreign-born population - Serbia (%)
Place of birth for the foreign-born population - Ukraine (%)
Place of birth for the foreign-born population - Other Eastern Europe (%)
Place of birth for the foreign-born population - China (%)
Place of birth for the foreign-born population - Hong Kong (%)
Place of birth for the foreign-born population - Taiwan (%)
Place of birth for the foreign-born population - Japan (%)
Place of birth for the foreign-born population - Korea (%)
Place of birth for the foreign-born population - Other Eastern Asia (%)
Place of birth for the foreign-born population - Afghanistan (%)
Place of birth for the foreign-born population - Bangladesh (%)
Place of birth for the foreign-born population - India (%)
Place of birth for the foreign-born population - Iran (%)
Place of birth for the foreign-born population - Kazakhstan (%)
Place of birth for the foreign-born population - Nepal (%)
Place of birth for the foreign-born population - Pakistan (%)
Place of birth for the foreign-born population - Sri Lanka (%)
Place of birth for the foreign-born population - Uzbekistan (%)
Place of birth for the foreign-born population - Other South Central Asia (%)
Place of birth for the foreign-born population - Burma (%)
Place of birth for the foreign-born population - Cambodia (%)
Place of birth for the foreign-born population - Indonesia (%)
Place of birth for the foreign-born population - Laos (%)
Place of birth for the foreign-born population - Malaysia (%)
Place of birth for the foreign-born population - Philippines (%)
Place of birth for the foreign-born population - Singapore (%)
Place of birth for the foreign-born population - Thailand (%)
Place of birth for the foreign-born population - Vietnam (%)
Place of birth for the foreign-born population - Other South Eastern Asia (%)
Place of birth for the foreign-born population - Armenia (%)
Place of birth for the foreign-born population - Iraq (%)
Place of birth for the foreign-born population - Israel (%)
Place of birth for the foreign-born population - Jordan (%)
Place of birth for the foreign-born population - Kuwait (%)
Place of birth for the foreign-born population - Lebanon (%)
Place of birth for the foreign-born population - Saudi Arabia (%)
Place of birth for the foreign-born population - Syria (%)
Place of birth for the foreign-born population - Turkey (%)
Place of birth for the foreign-born population - Yemen (%)
Place of birth for the foreign-born population - Other Western Asia (%)
Place of birth for the foreign-born population - Eritrea (%)
Place of birth for the foreign-born population - Ethiopia (%)
Place of birth for the foreign-born population - Kenya (%)
Place of birth for the foreign-born population - Somalia (%)
Place of birth for the foreign-born population - Uganda (%)
Place of birth for the foreign-born population - Zimbabwe (%)
Place of birth for the foreign-born population - Other Eastern Africa (%)
Place of birth for the foreign-born population - Cameroon (%)
Place of birth for the foreign-born population - Congo (%)
Place of birth for the foreign-born population - Democratic Republic of Congo (Zaire) (%)
Place of birth for the foreign-born population - Other Middle Africa (%)
Place of birth for the foreign-born population - Egypt (%)
Place of birth for the foreign-born population - Morocco (%)
Place of birth for the foreign-born population - Sudan (%)
Place of birth for the foreign-born population - Other Northern Africa (%)
Place of birth for the foreign-born population - South Africa (%)
Place of birth for the foreign-born population - Other Southern Africa (%)
Place of birth for the foreign-born population - Cabo Verde (%)
Place of birth for the foreign-born population - Ghana (%)
Place of birth for the foreign-born population - Liberia (%)
Place of birth for the foreign-born population - Nigeria (%)
Place of birth for the foreign-born population - Senegal (%)
Place of birth for the foreign-born population - Sierra Leone (%)
Place of birth for the foreign-born population - Other Western Africa (%)
Place of birth for the foreign-born population - Australia (%)
Place of birth for the foreign-born population - New Zealand (%)
Place of birth for the foreign-born population - Fiji (%)
Place of birth for the foreign-born population - Micronesia (%)
Place of birth for the foreign-born population - Bahamas (%)
Place of birth for the foreign-born population - Barbados (%)
Place of birth for the foreign-born population - Cuba (%)
Place of birth for the foreign-born population - Dominica (%)
Place of birth for the foreign-born population - Dominican Republic (%)
Place of birth for the foreign-born population - Grenada (%)
Place of birth for the foreign-born population - Haiti (%)
Place of birth for the foreign-born population - Jamaica (%)
Place of birth for the foreign-born population - St. Vincent and the Grenadines (%)
Place of birth for the foreign-born population - Trinidad and Tobago (%)
Place of birth for the foreign-born population - West Indies (%)
Place of birth for the foreign-born population - Other Caribbean (%)
Place of birth for the foreign-born population - Belize (%)
Place of birth for the foreign-born population - Costa Rica (%)
Place of birth for the foreign-born population - El Salvador (%)
Place of birth for the foreign-born population - Guatemala (%)
Place of birth for the foreign-born population - Honduras (%)
Place of birth for the foreign-born population - Mexico (%)
Place of birth for the foreign-born population - Nicaragua (%)
Place of birth for the foreign-born population - Panama (%)
Place of birth for the foreign-born population - Other Central America (%)
Place of birth for the foreign-born population - Argentina (%)
Place of birth for the foreign-born population - Bolivia (%)
Place of birth for the foreign-born population - Brazil (%)
Place of birth for the foreign-born population - Chile (%)
Place of birth for the foreign-born population - Colombia (%)
Place of birth for the foreign-born population - Ecuador (%)
Place of birth for the foreign-born population - Guyana (%)
Place of birth for the foreign-born population - Peru (%)
Place of birth for the foreign-born population - Uruguay (%)
Place of birth for the foreign-born population - Venezuela (%)
Place of birth for the foreign-born population - Other South America (%)
Place of birth for the foreign-born population - Canada (%)
Place of birth for the foreign-born population - Other Northern America (%)
Place of birth for the foreign-born population - Other (%)
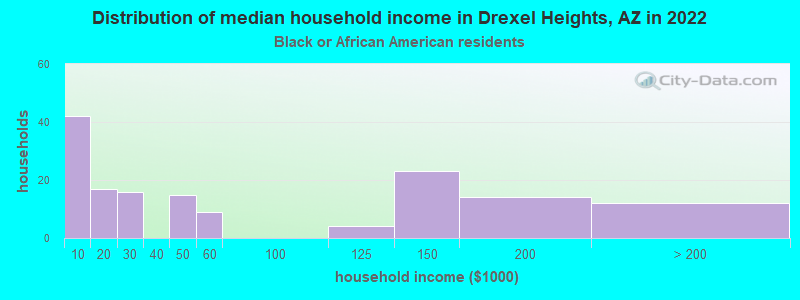
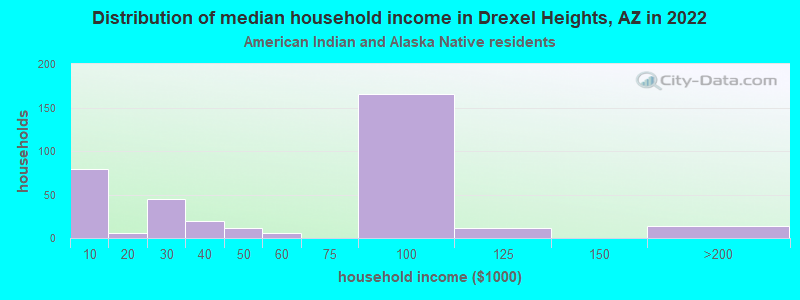
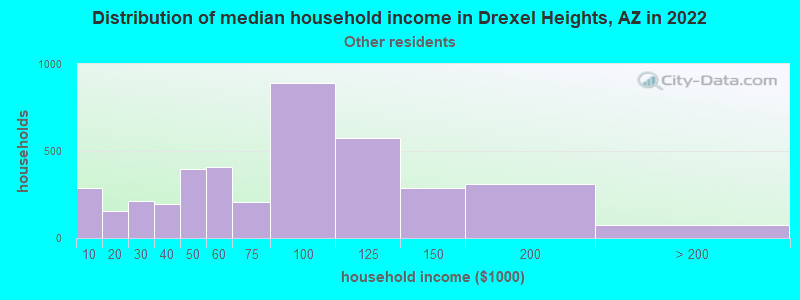
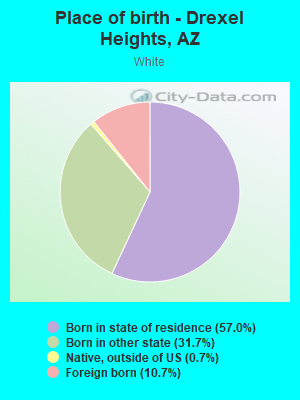
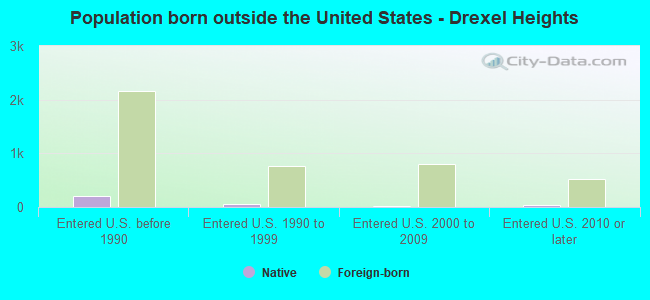
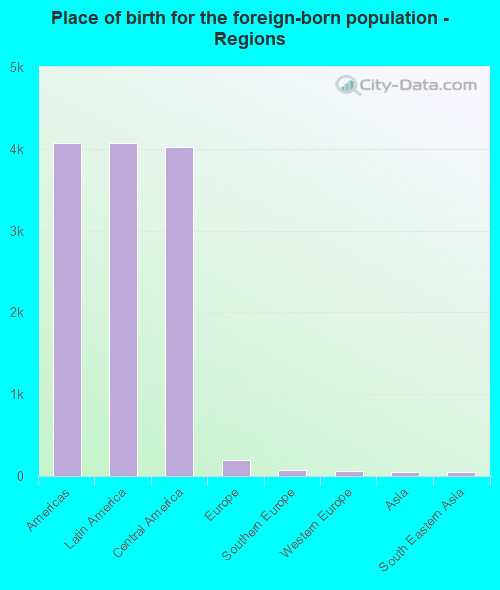
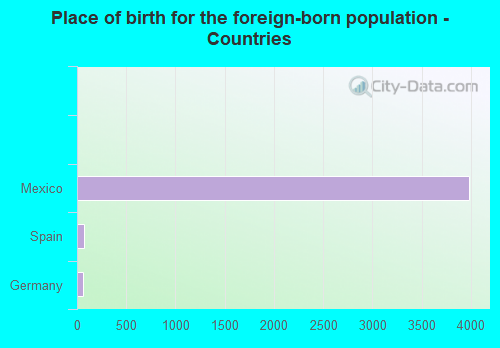
According to 2022 data, the most numerous races in Drexel Heights, AZ are White alone (5,240 residents), Hispanic (24,325 residents), and Black alone (673 residents). 52.0% of Drexel Heights residents speak English at home. 14.1% of Drexel Heights, AZ residents are foreign-born (13.4% born in Latin America), which is 7.9% greater than the foreign-born rate of 13.0% across the entire state of Arizona.
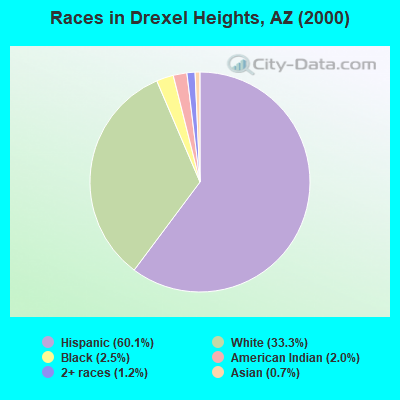
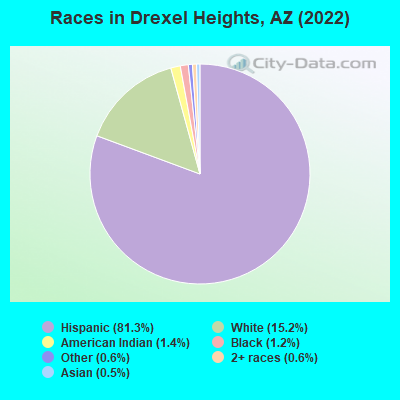
Race distribution in Drexel Heights
2000 2022
3,274,258 63.8% White alone 1,295,617 25.3% Hispanic 233,370 4.5% American Indian alone 149,941 2.9% Black alone 89,315 1.7% Asian alone 76,372 1.5% Two or more races 6,120 0.1% Other race alone 5,639 0.1% Native Hawaiian and Other
3,814,587 51.8% White alone 2,388,520 32.5% Hispanic 322,459 4.4% Black alone 284,994 3.9% Two or more races 257,020 3.5% Asian alone 241,688 3.3% American Indian alone 36,042 0.5% Other race alone 13,887 0.2% Native Hawaiian and Other
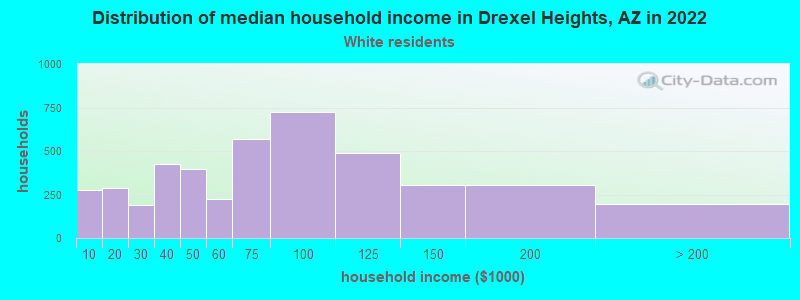
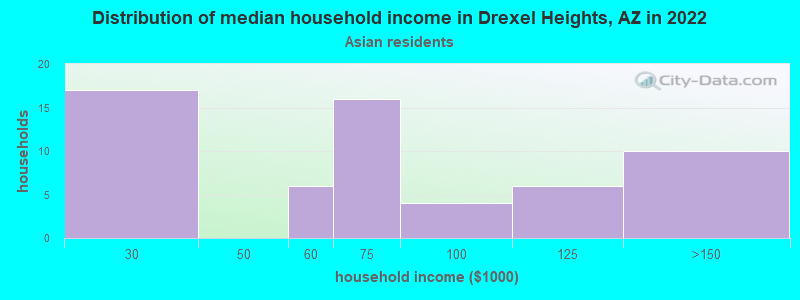
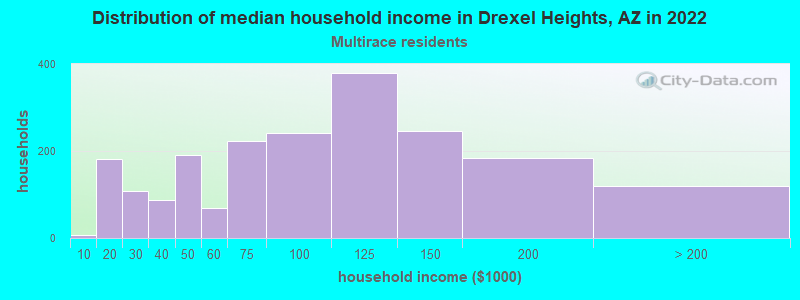
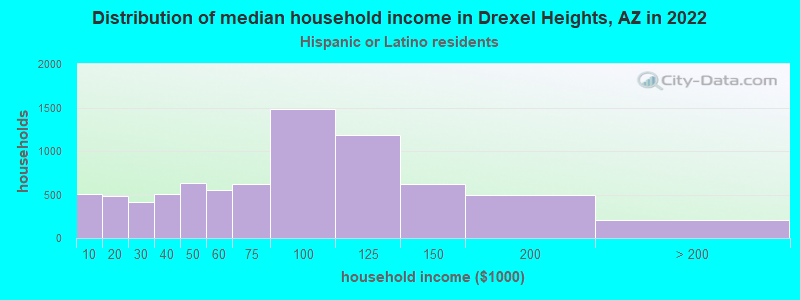
Income and house value in Drexel Heights Median household income in 2022 $77,144 White non-Hispanic householders$60,973 Black householders$72,594 American Indian and Alaska Native householders$58,082 Asian householders$153,723 Native Hawaiian and other Pacific Islander householders$80,700 Some other race householders$54,839 Two or more races householders$78,093 Hispanic or Latino race householdersMedian 2022 house value $336,893 White Non-Hispanic householders$366,349 Black or African American householders$351,989 American Indian or Alaska Native householders $246,319 Asian householders$349,780 Native Hawaiian and other Pacific Islander householders$328,425 Some other race householders$324,375 Two or more races householders$331,739 Hispanic or Latino householders
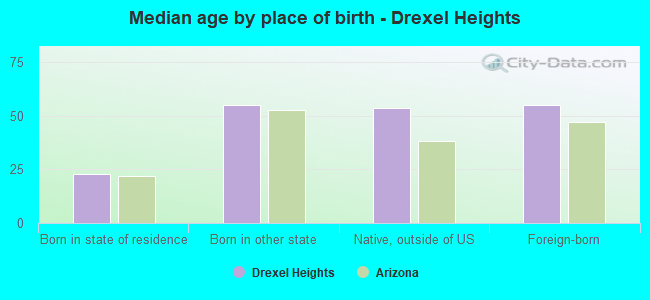
Median age by race in Drexel Heights
41.4 Median age for White residents42.9 40.4 29.8 Median age for Black or African American residents45.1 28.5 38.0 Median age for American Indian / Alaska Native residents40.5 38.0 58.4 Median age for Asian residents38.6 66.0 23.7 Median age for Native Hawaiian / Pacific Islander residents32.1 Median age for Other race residents29.4 33.7 32.5 Median age for Two or more races residents40.7 27.6 60.7 Median age for White alone residents59.9 61.2 31.1 Median age for Hispanic or Latino residents31.3 31.2
Owner/renter occupied households by race in Drexel Heights
House owners and renters - White residents 4,617 82.8% Owner occupied959 17.2% Renter occupiedHouse owners and renters - Black or African American residents 174 88.7% Owner occupied22 11.3% Renter occupiedHouse owners and renters - American Indian / Alaska Native residents 311 61.8% Owner occupied192 38.2% Renter occupiedHouse owners and renters - Asian residents 41 70.3% Owner occupied17 29.7% Renter occupiedHouse owners and renters - Other race residents 2,270 70.6% Owner occupied946 29.4% Renter occupiedHouse owners and renters - Two or more races residents 2,452 89.3% Owner occupied295 10.7% Renter occupiedHouse owners and renters - White alone residents 2,195 86.4% Owner occupied344 13.6% Renter occupiedHouse owners and renters - Hispanic or Latino residents 5,821 75.3% Owner occupied1,908 24.7% Renter occupied
Language usage in Drexel Heights
English speakers - Total 52.0% of residents of Drexel Heights speak English at home.
47.0% of residents speak Spanish at home 10,384 77.9% Speak English very well2,951 22.1% Speak English less than very well0.6% of residents speak other language at home 163 89.1% Speak English very well20 10.9% Speak English less than very well
English speakers - Born in the United States 75.6% of residents of Drexel Heights speak English at home.
24.0% of residents speak Spanish at home 1,497 92.0% Speak English very well131 8.0% Speak English less than very well0.5% of residents speak other language at home 28 87.5% Speak English very well4 12.5% Speak English less than very well
English speakers - Native, born elsewhere 43.4% of residents of Drexel Heights speak English at home.
58.1% of residents speak Spanish at home 86 44.6% Speak English very well107 55.4% Speak English less than very well
English speakers - Foreign-born 5.9% of residents of Drexel Heights speak English at home.
91.4% of residents speak Spanish at home 1,823 47.5% Speak English very well2,013 52.5% Speak English less than very well2.4% of residents speak other language at home 85 84.2% Speak English very well16 15.8% Speak English less than very well
White (Caucasian) - Speak only English Native:
69.8% (8,902)Foreign-born:
10.0% (159)
White (Caucasian) - Speak another language Native:
23.4% (2,982)Foreign-born:
85.2% (1,353)
Black or African American - Speak another language Native:
3.0% (24)Foreign-born:
99.2% (6)
American Indian / Alaska Native - Speak another language Native:
27.5% (304)Foreign-born:
100.0% (32)
Asian - Speak only English Native:
95.1% (58)Foreign-born:
12.2% (8)
Asian - Speak another language Native:
11.4% (7)Foreign-born:
86.4% (55)
Other race - Speak only English Native:
40.7% (3,249)Foreign-born:
3.2% (54)
Other race - Speak another language Native:
58.8% (4,696)Foreign-born:
95.7% (1,616)
Two or more races - Speak only English Native:
55.2% (2,618)Foreign-born:
1.2% (27)
Two or more races - Speak another language Native:
63.1% (2,993)Foreign-born:
100.0% (2,176)
White alone - Speak only English Native:
96.3% (4,892)Foreign-born:
58.7% (77)
White alone - Speak another language Native:
3.6% (184)Foreign-born:
41.2% (54)
Hispanic or Latino - Speak only English Native:
49.9% (9,284)Foreign-born:
4.0% (168)
Hispanic or Latino - Speak another language Native:
49.9% (9,284)Foreign-born:
95.6% (4,064)
Foreign-born residents in Drexel Heights 4,328 residents are foreign born (13.4% Latin America ).
This city:
14.1%Arizona:
100.0%
Marital status for residents in Drexel Heights Marital status - White (Caucasian) population 15 years and over
Males 34.4% Never married51.5% Now married1.7% Separated3.5% Widowed8.9% DivorcedFemales 29.8% Never married47.9% Now married1.8% Separated8.8% Widowed11.7% DivorcedWomen who gave birth in the past 12 months Now married:
31.0% (61)Unmarried:
69.0% (136)
Women who did not give birth in the past 12 months Now married:
41.8% (1,380)Unmarried:
58.2% (1,924)
Marital status - Black or African American population 15 years and over
Males 28.1% Never married44.6% Now married0.0% Separated5.0% Widowed22.4% DivorcedFemales 61.4% Never married29.9% Now married5.6% Separated0.0% Widowed3.1% DivorcedWomen who did not give birth in the past 12 months Now married:
16.7% (36)Unmarried:
83.3% (181)
Marital status - American Indian / Alaska Native population 15 years and over
Males 28.9% Never married48.0% Now married3.7% Separated13.5% Widowed6.0% DivorcedFemales 50.8% Never married19.0% Now married3.9% Separated11.1% Widowed15.2% DivorcedWomen who gave birth in the past 12 months Now married:
0.0% (0)Unmarried:
100.0% (21)
Women who did not give birth in the past 12 months Now married:
25.6% (82)Unmarried:
74.4% (239)
Marital status - Asian population 15 years and over
Males 41.5% Never married43.9% Now married0.0% Separated0.0% Widowed14.6% DivorcedFemales 27.1% Never married32.9% Now married0.0% Separated40.0% Widowed0.0% DivorcedWomen who did not give birth in the past 12 months Now married:
37.5% (6)Unmarried:
62.5% (10)
Marital status - Other race population 15 years and over
Males 38.9% Never married41.2% Now married3.6% Separated4.6% Widowed11.6% DivorcedFemales 43.1% Never married43.4% Now married2.1% Separated1.0% Widowed10.5% DivorcedWomen who gave birth in the past 12 months Now married:
35.8% (40)Unmarried:
64.2% (71)
Women who did not give birth in the past 12 months Now married:
34.9% (874)Unmarried:
65.1% (1,627)
Marital status - Two or more races population 15 years and over
Males 56.9% Never married38.3% Now married0.0% Separated0.4% Widowed4.5% DivorcedFemales 41.7% Never married32.8% Now married9.7% Separated3.0% Widowed12.8% DivorcedWomen who gave birth in the past 12 months Now married:
100.0% (32)Unmarried:
0.0% (0)
Women who did not give birth in the past 12 months Now married:
27.2% (344)Unmarried:
72.8% (919)
Marital status - White alone, not Hispanic / Latino population 15 years and over
Males 22.9% Never married57.5% Now married1.8% Separated5.2% Widowed12.5% DivorcedFemales 16.3% Never married53.7% Now married2.0% Separated12.2% Widowed15.9% DivorcedWomen who gave birth in the past 12 months Now married:
100.0% (8)Unmarried:
0.0% (0)
Women who did not give birth in the past 12 months Now married:
42.9% (339)Unmarried:
57.1% (452)
Marital status - Hispanic or Latino population 15 years and over
Males 40.6% Never married44.5% Now married2.5% Separated3.7% Widowed8.6% DivorcedFemales 39.9% Never married42.4% Now married2.5% Separated4.4% Widowed10.7% DivorcedWomen who gave birth in the past 12 months Now married:
29.0% (109)Unmarried:
71.0% (267)
Women who did not give birth in the past 12 months Now married:
37.1% (2,336)Unmarried:
62.9% (3,960)
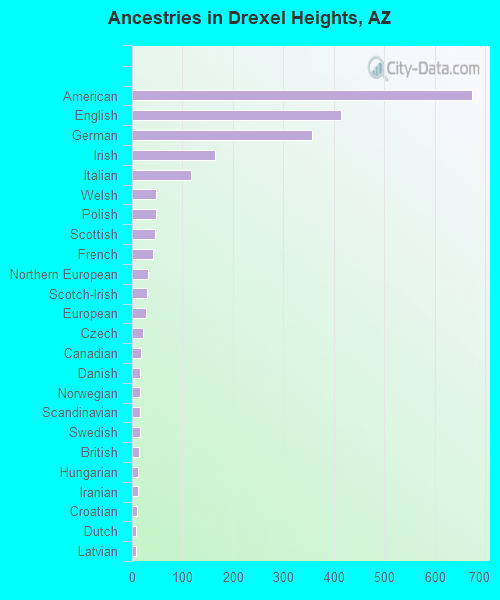
Ancestries in Drexel Heights
500 2.5% American391 1.9% German123 0.6% Irish113 0.6% English83 0.4% Italian69 0.3% Scottish68 0.3% Northern European66 0.3% European63 0.3% Polish56 0.3% Scotch-Irish50 0.2% French45 0.2% Welsh27 0.1% Dutch26 0.1% Czech26 0.1% Scandinavian24 0.1% British22 0.1% Norwegian17 0.08% Brazilian17 0.08% Portuguese13 0.06% French Canadian9 0.04% Greek9 0.04% Iranian8 0.04% Hungarian8 0.04% Russian8 0.04% Swedish8 0.04% Swiss6 0.03% Latvian4 0.02% Cajun4 0.02% Yugoslavian
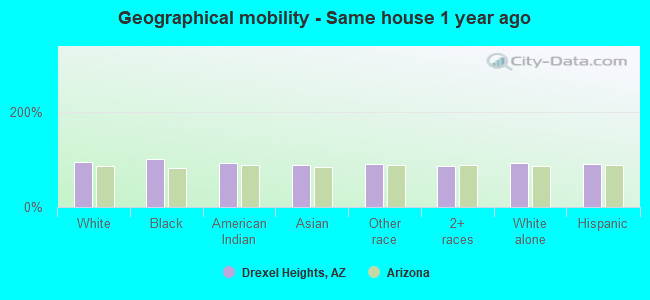
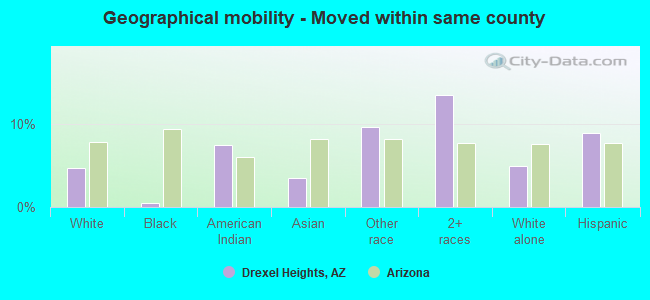
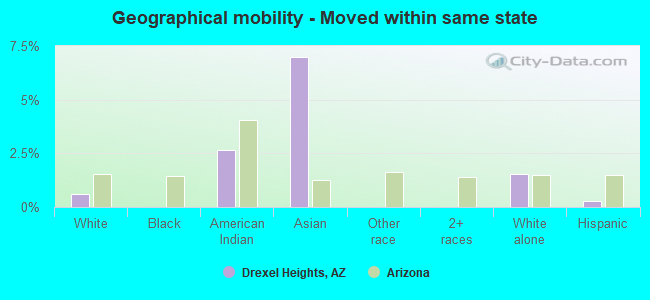
Geographical mobility in Drexel Heights Same house 1 year ago 14,240 94.5% White (Caucasian)903 100.0% Black or African American1,095 91.9% American Indian / Alaska Native113 87.7% Asian8,833 89.6% Other race4,828 85.5% Two or more races4,833 92.8% White alone, not Hispanic / Latino20,812 89.6% Hispanic or LatinoMoved within same county 719 4.8% White / Caucasian4 0.4% Black or African American90 7.5% American Indian / Alaska Native5 3.5% Asian951 9.6% Other race764 13.5% Two or more races256 4.9% White alone, not Hispanic / Latino2,093 9.0% Hispanic or LatinoMoved within same state 92 0.6% White / Caucasian31 2.6% American Indian / Alaska Native9 7.0% Asian80 1.5% White alone, not Hispanic / Latino66 0.3% Hispanic or LatinoMoved from different state 285 1.9% White / Caucasian19 2.2% Black or African American6 4.6% Asian106 1.1% Other race22 0.4% Two or more races90 1.7% White alone, not Hispanic / Latino316 1.4% Hispanic or LatinoMoved from abroad 19 0.1% White12 0.1% Other race39 0.2% Hispanic or Latino
Children Nativity (place of birth) in Drexel Heights
Children under 6 years - Living with two parents Both parents native 554 100.0% NativeBoth parents foreign-born 117 100.0% NativeOne native, one foreign-born parent 235 100.0% NativeChildren under 6 years - Living with one parent Native parent 824 100.0% NativeForeign-born parent 96 100.0% NativeChildren 6 to 17 years - Living with two parents Both parents native 1,949 100.0% NativeBoth parents foreign-born 475 97.3% Native13 2.7% Foreign-bornOne native, one foreign-born parent 392 100.0% NativeChildren 6 to 17 years - Living with one parent Native parent 2,492 100.0% NativeForeign-born parent 232 50.3% Native229 49.7% Foreign-born
Grandparents responsible for own grandchildren in Drexel Heights
Grandparents (30 to 59 years) White / Caucasian 81 30.8% Responsible for grandchildren181 69.2% Not responsible for grandchildrenBlack or African American 20 100.0% Responsible for grandchildrenAmerican Indian / Alaska Native 20 100.0% Responsible for grandchildrenOther race 33 16.2% Responsible for grandchildren169 83.8% Not responsible for grandchildrenTwo or more races 48 100.0% Not responsible for grandchildrenWhite alone, not Hispanic / Latino 14 31.4% Responsible for grandchildren31 68.6% Not responsible for grandchildrenHispanic or Latino 121 23.0% Responsible for grandchildren403 77.0% Not responsible for grandchildrenGrandparents (60 years and over) White / Caucasian 104 27.0% Responsible for grandchildren281 73.0% Not responsible for grandchildrenBlack or African American 12 77.3% Responsible for grandchildren3 22.7% Not responsible for grandchildrenAmerican Indian / Alaska Native 26 100.0% Responsible for grandchildrenOther race 47 6.3% Responsible for grandchildren698 93.7% Not responsible for grandchildrenTwo or more races 53 100.0% Not responsible for grandchildrenWhite alone, not Hispanic / Latino 81 43.8% Responsible for grandchildren104 56.2% Not responsible for grandchildrenHispanic or Latino 105 14.7% Responsible for grandchildren608 85.3% Not responsible for grandchildren