Races in Duluth, Minnesota (MN) Detailed Stats
Data:
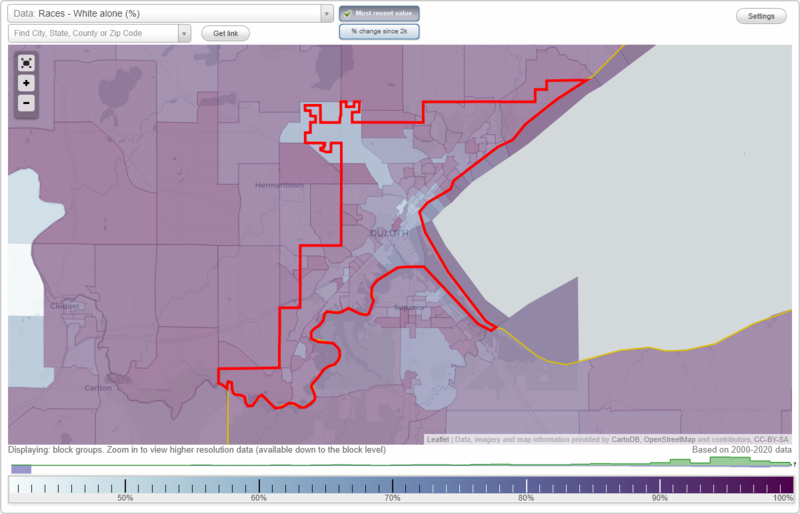
Races - White alone (%)
Races - White alone (% change since 2000)
Races - Black alone (%)
Races - Black alone (% change since 2000)
Races - American Indian alone (%)
Races - American Indian alone (% change since 2000)
Races - Asian alone (%)
Races - Asian alone (% change since 2000)
Races - Hispanic (%)
Races - Hispanic (% change since 2000)
Races - Native Hawaiian and Other Pacific Islander alone (%)
Races - Native Hawaiian and Other Pacific Islander alone (% change since 2000)
Races - Two or more races(%)
Races - Two or more races(% change since 2000)
Races - Other race alone (%)
Races - Other race alone (% change since 2000)
Racial diversity
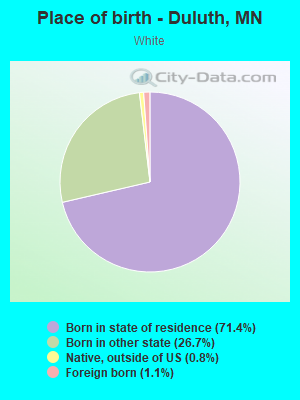
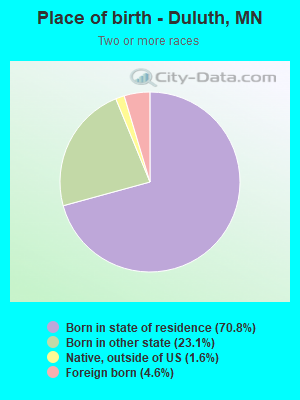
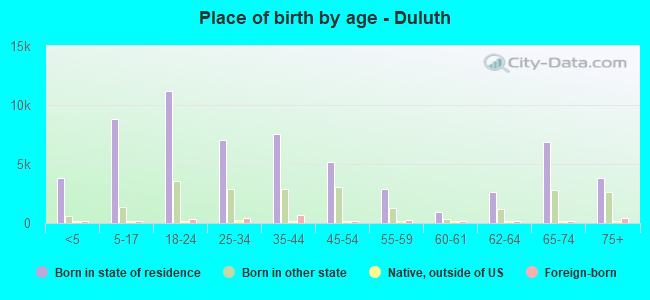
Place of birth - Born in state of residence (%)
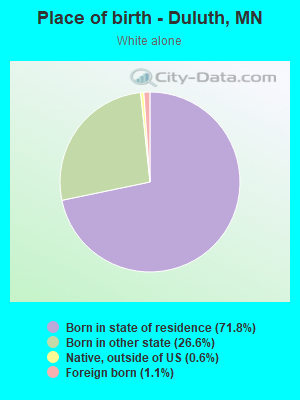
Place of birth - Born in state of residence (%) - White
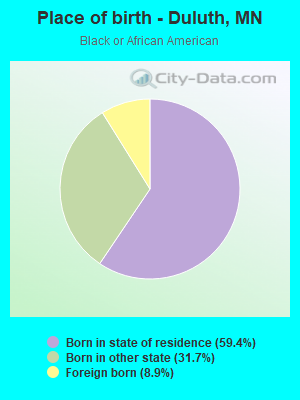
Place of birth - Born in state of residence (%) - Black or African American
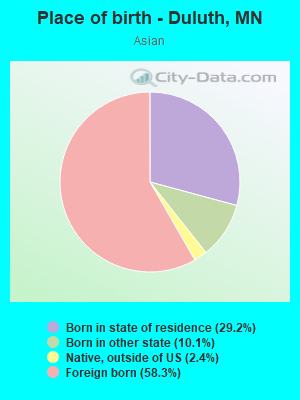
Place of birth - Born in state of residence (%) - Asian
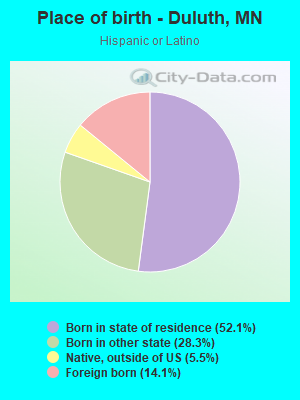
Place of birth - Born in state of residence (%) - Hispanic or Latino
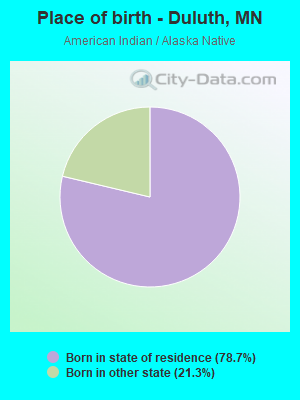
Place of birth - Born in state of residence (%) - American Indian and Alaska Native
Place of birth - Born in state of residence (%) - Multirace
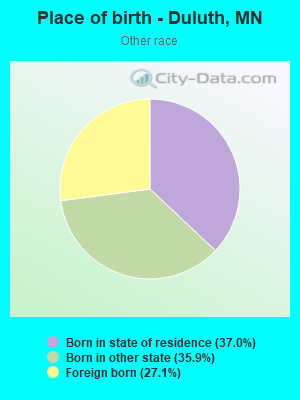
Place of birth - Born in state of residence (%) - Other Race
Place of birth - Born in other state (%)
Place of birth - Born in other state (%) - White
Place of birth - Born in other state (%) - Black or African American
Place of birth - Born in other state (%) - Asian
Place of birth - Born in other state (%) - Hispanic or Latino
Place of birth - Born in other state (%) - American Indian and Alaska Native
Place of birth - Born in other state (%) - Multirace
Place of birth - Born in other state (%) - Other Race
Place of birth - Native, outside of US (%)
Place of birth - Native, outside of US (%) - White
Place of birth - Native, outside of US (%) - Black or African American
Place of birth - Native, outside of US (%) - Asian
Place of birth - Native, outside of US (%) - Hispanic or Latino
Place of birth - Native, outside of US (%) - American Indian and Alaska Native
Place of birth - Native, outside of US (%) - Multirace
Place of birth - Native, outside of US (%) - Other Race
Place of birth - Foreign born (%)
Place of birth - Foreign born (%) - White
Place of birth - Foreign born (%) - Black or African American
Place of birth - Foreign born (%) - Asian
Place of birth - Foreign born (%) - Hispanic or Latino
Place of birth - Foreign born (%) - American Indian and Alaska Native
Place of birth - Foreign born (%) - Multirace
Place of birth - Foreign born (%) - Other Race
Residents speaking English at home (%)
Residents speaking English at home - Born in the United States (%)
Residents speaking English at home - Native, born elsewhere (%)
Residents speaking English at home - Foreign born (%)
Residents speaking Spanish at home (%)
Residents speaking Spanish at home - Born in the United States (%)
Residents speaking Spanish at home - Native, born elsewhere (%)
Residents speaking Spanish at home - Foreign born (%)
Residents speaking other language at home (%)
Residents speaking other language at home - Born in the United States (%)
Residents speaking other language at home - Native, born elsewhere (%)
Residents speaking other language at home - Foreign born (%)
Marital status - Never married (%)
Marital status - Now married (%)
Marital status - Separated (%)
Marital status - Widowed (%)
Marital status - Divorced (%)
Ancestries Reported - Arab (%)
Ancestries Reported - Czech (%)
Ancestries Reported - Danish (%)
Ancestries Reported - Dutch (%)
Ancestries Reported - English (%)
Ancestries Reported - French (%)
Ancestries Reported - French Canadian (%)
Ancestries Reported - German (%)
Ancestries Reported - Greek (%)
Ancestries Reported - Hungarian (%)
Ancestries Reported - Irish (%)
Ancestries Reported - Italian (%)
Ancestries Reported - Lithuanian (%)
Ancestries Reported - Norwegian (%)
Ancestries Reported - Polish (%)
Ancestries Reported - Portuguese (%)
Ancestries Reported - Russian (%)
Ancestries Reported - Scotch-Irish (%)
Ancestries Reported - Scottish (%)
Ancestries Reported - Slovak (%)
Ancestries Reported - Subsaharan African (%)
Ancestries Reported - Swedish (%)
Ancestries Reported - Swiss (%)
Ancestries Reported - Ukrainian (%)
Ancestries Reported - United States (%)
Ancestries Reported - Welsh (%)
Ancestries Reported - West Indian (%)
Ancestries Reported - Other (%)
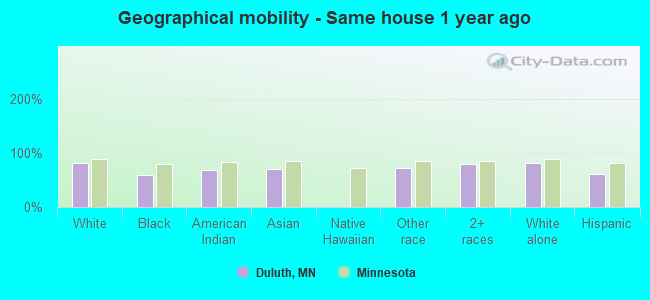
Geographical mobility - Same house 1 year ago (%)
Geographical mobility - Same house 1 year ago (%) - White
Geographical mobility - Same house 1 year ago (%) - Black or African American
Geographical mobility - Same house 1 year ago (%) - Asian
Geographical mobility - Same house 1 year ago (%) - Hispanic or Latino
Geographical mobility - Same house 1 year ago (%) - American Indian and Alaska Native
Geographical mobility - Same house 1 year ago (%) - Multirace
Geographical mobility - Same house 1 year ago (%) - Other Race
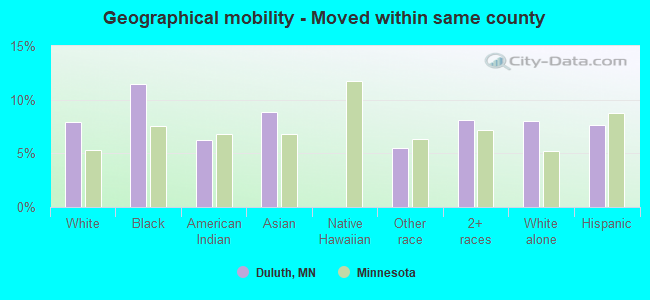
Geographical mobility - Moved within same county (%)
Geographical mobility - Moved within same county (%) - White
Geographical mobility - Moved within same county (%) - Black or African American
Geographical mobility - Moved within same county (%) - Asian
Geographical mobility - Moved within same county (%) - Hispanic or Latino
Geographical mobility - Moved within same county (%) - American Indian and Alaska Native
Geographical mobility - Moved within same county (%) - Multirace
Geographical mobility - Moved within same county (%) - Other Race
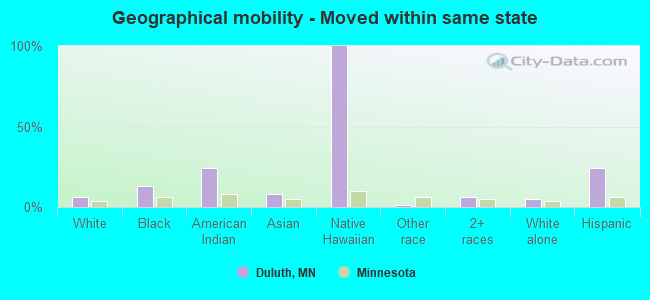
Geographical mobility - Moved from different county within same state (%)
Geographical mobility - Moved from different county within same state (%) - White
Geographical mobility - Moved from different county within same state (%) - Black or African American
Geographical mobility - Moved from different county within same state (%) - Asian
Geographical mobility - Moved from different county within same state (%) - Hispanic or Latino
Geographical mobility - Moved from different county within same state (%) - American Indian and Alaska Native
Geographical mobility - Moved from different county within same state (%) - Multirace
Geographical mobility - Moved from different county within same state (%) - Other Race
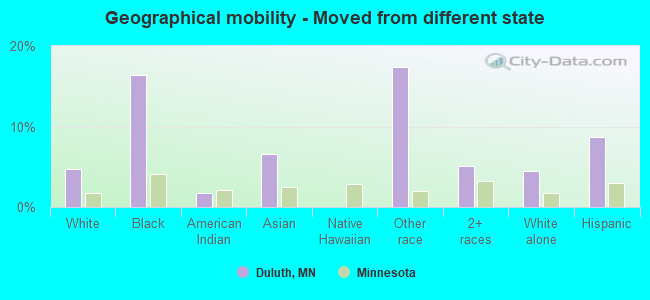
Geographical mobility - Moved from different state (%)
Geographical mobility - Moved from different state (%) - White
Geographical mobility - Moved from different state (%) - Black or African American
Geographical mobility - Moved from different state (%) - Asian
Geographical mobility - Moved from different state (%) - Hispanic or Latino
Geographical mobility - Moved from different state (%) - American Indian and Alaska Native
Geographical mobility - Moved from different state (%) - Multirace
Geographical mobility - Moved from different state (%) - Other Race
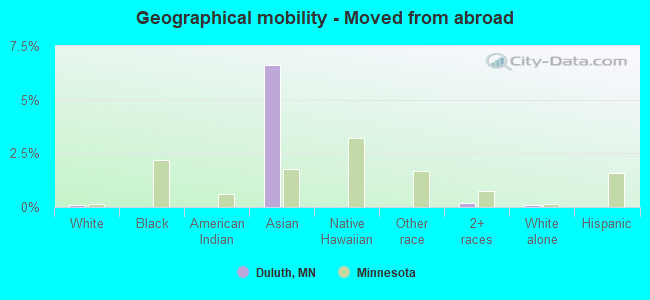
Geographical mobility - Moved from abroad (%)
Geographical mobility - Moved from abroad (%) - White
Geographical mobility - Moved from abroad (%) - Black or African American
Geographical mobility - Moved from abroad (%) - Asian
Geographical mobility - Moved from abroad (%) - Hispanic or Latino
Geographical mobility - Moved from abroad (%) - American Indian and Alaska Native
Geographical mobility - Moved from abroad (%) - Multirace
Geographical mobility - Moved from abroad (%) - Other Race
Place of birth for the foreign-born population - Ireland (%)
Place of birth for the foreign-born population - Denmark (%)
Place of birth for the foreign-born population - Norway (%)
Place of birth for the foreign-born population - Sweden (%)
Place of birth for the foreign-born population - United Kingdom (%)
Place of birth for the foreign-born population - England (%)
Place of birth for the foreign-born population - Scotland (%)
Place of birth for the foreign-born population - Other Northern Europe (%)
Place of birth for the foreign-born population - Austria (%)
Place of birth for the foreign-born population - Belgium (%)
Place of birth for the foreign-born population - France (%)
Place of birth for the foreign-born population - Germany (%)
Place of birth for the foreign-born population - Netherlands (%)
Place of birth for the foreign-born population - Switzerland (%)
Place of birth for the foreign-born population - Other Western Europe (%)
Place of birth for the foreign-born population - Greece (%)
Place of birth for the foreign-born population - Italy (%)
Place of birth for the foreign-born population - Portugal (%)
Place of birth for the foreign-born population - Spain (%)
Place of birth for the foreign-born population - Other Southern Europe (%)
Place of birth for the foreign-born population - Albania (%)
Place of birth for the foreign-born population - Belarus (%)
Place of birth for the foreign-born population - Bosnia and Herzegovina (%)
Place of birth for the foreign-born population - Bulgaria (%)
Place of birth for the foreign-born population - Croatia (%)
Place of birth for the foreign-born population - Czechoslovakia (%)
Place of birth for the foreign-born population - Hungary (%)
Place of birth for the foreign-born population - Latvia (%)
Place of birth for the foreign-born population - Lithuania (%)
Place of birth for the foreign-born population - North Macedonia (Macedonia) (%)
Place of birth for the foreign-born population - Moldova (%)
Place of birth for the foreign-born population - Poland (%)
Place of birth for the foreign-born population - Romania (%)
Place of birth for the foreign-born population - Russia (%)
Place of birth for the foreign-born population - Serbia (%)
Place of birth for the foreign-born population - Ukraine (%)
Place of birth for the foreign-born population - Other Eastern Europe (%)
Place of birth for the foreign-born population - China (%)
Place of birth for the foreign-born population - Hong Kong (%)
Place of birth for the foreign-born population - Taiwan (%)
Place of birth for the foreign-born population - Japan (%)
Place of birth for the foreign-born population - Korea (%)
Place of birth for the foreign-born population - Other Eastern Asia (%)
Place of birth for the foreign-born population - Afghanistan (%)
Place of birth for the foreign-born population - Bangladesh (%)
Place of birth for the foreign-born population - India (%)
Place of birth for the foreign-born population - Iran (%)
Place of birth for the foreign-born population - Kazakhstan (%)
Place of birth for the foreign-born population - Nepal (%)
Place of birth for the foreign-born population - Pakistan (%)
Place of birth for the foreign-born population - Sri Lanka (%)
Place of birth for the foreign-born population - Uzbekistan (%)
Place of birth for the foreign-born population - Other South Central Asia (%)
Place of birth for the foreign-born population - Burma (%)
Place of birth for the foreign-born population - Cambodia (%)
Place of birth for the foreign-born population - Indonesia (%)
Place of birth for the foreign-born population - Laos (%)
Place of birth for the foreign-born population - Malaysia (%)
Place of birth for the foreign-born population - Philippines (%)
Place of birth for the foreign-born population - Singapore (%)
Place of birth for the foreign-born population - Thailand (%)
Place of birth for the foreign-born population - Vietnam (%)
Place of birth for the foreign-born population - Other South Eastern Asia (%)
Place of birth for the foreign-born population - Armenia (%)
Place of birth for the foreign-born population - Iraq (%)
Place of birth for the foreign-born population - Israel (%)
Place of birth for the foreign-born population - Jordan (%)
Place of birth for the foreign-born population - Kuwait (%)
Place of birth for the foreign-born population - Lebanon (%)
Place of birth for the foreign-born population - Saudi Arabia (%)
Place of birth for the foreign-born population - Syria (%)
Place of birth for the foreign-born population - Turkey (%)
Place of birth for the foreign-born population - Yemen (%)
Place of birth for the foreign-born population - Other Western Asia (%)
Place of birth for the foreign-born population - Eritrea (%)
Place of birth for the foreign-born population - Ethiopia (%)
Place of birth for the foreign-born population - Kenya (%)
Place of birth for the foreign-born population - Somalia (%)
Place of birth for the foreign-born population - Uganda (%)
Place of birth for the foreign-born population - Zimbabwe (%)
Place of birth for the foreign-born population - Other Eastern Africa (%)
Place of birth for the foreign-born population - Cameroon (%)
Place of birth for the foreign-born population - Congo (%)
Place of birth for the foreign-born population - Democratic Republic of Congo (Zaire) (%)
Place of birth for the foreign-born population - Other Middle Africa (%)
Place of birth for the foreign-born population - Egypt (%)
Place of birth for the foreign-born population - Morocco (%)
Place of birth for the foreign-born population - Sudan (%)
Place of birth for the foreign-born population - Other Northern Africa (%)
Place of birth for the foreign-born population - South Africa (%)
Place of birth for the foreign-born population - Other Southern Africa (%)
Place of birth for the foreign-born population - Cabo Verde (%)
Place of birth for the foreign-born population - Ghana (%)
Place of birth for the foreign-born population - Liberia (%)
Place of birth for the foreign-born population - Nigeria (%)
Place of birth for the foreign-born population - Senegal (%)
Place of birth for the foreign-born population - Sierra Leone (%)
Place of birth for the foreign-born population - Other Western Africa (%)
Place of birth for the foreign-born population - Australia (%)
Place of birth for the foreign-born population - New Zealand (%)
Place of birth for the foreign-born population - Fiji (%)
Place of birth for the foreign-born population - Micronesia (%)
Place of birth for the foreign-born population - Bahamas (%)
Place of birth for the foreign-born population - Barbados (%)
Place of birth for the foreign-born population - Cuba (%)
Place of birth for the foreign-born population - Dominica (%)
Place of birth for the foreign-born population - Dominican Republic (%)
Place of birth for the foreign-born population - Grenada (%)
Place of birth for the foreign-born population - Haiti (%)
Place of birth for the foreign-born population - Jamaica (%)
Place of birth for the foreign-born population - St. Vincent and the Grenadines (%)
Place of birth for the foreign-born population - Trinidad and Tobago (%)
Place of birth for the foreign-born population - West Indies (%)
Place of birth for the foreign-born population - Other Caribbean (%)
Place of birth for the foreign-born population - Belize (%)
Place of birth for the foreign-born population - Costa Rica (%)
Place of birth for the foreign-born population - El Salvador (%)
Place of birth for the foreign-born population - Guatemala (%)
Place of birth for the foreign-born population - Honduras (%)
Place of birth for the foreign-born population - Mexico (%)
Place of birth for the foreign-born population - Nicaragua (%)
Place of birth for the foreign-born population - Panama (%)
Place of birth for the foreign-born population - Other Central America (%)
Place of birth for the foreign-born population - Argentina (%)
Place of birth for the foreign-born population - Bolivia (%)
Place of birth for the foreign-born population - Brazil (%)
Place of birth for the foreign-born population - Chile (%)
Place of birth for the foreign-born population - Colombia (%)
Place of birth for the foreign-born population - Ecuador (%)
Place of birth for the foreign-born population - Guyana (%)
Place of birth for the foreign-born population - Peru (%)
Place of birth for the foreign-born population - Uruguay (%)
Place of birth for the foreign-born population - Venezuela (%)
Place of birth for the foreign-born population - Other South America (%)
Place of birth for the foreign-born population - Canada (%)
Place of birth for the foreign-born population - Other Northern America (%)
Place of birth for the foreign-born population - Other (%)
Latest news about races in Duluth, MN collected exclusively by city-data.com from local newspapers, TV, and radio stations
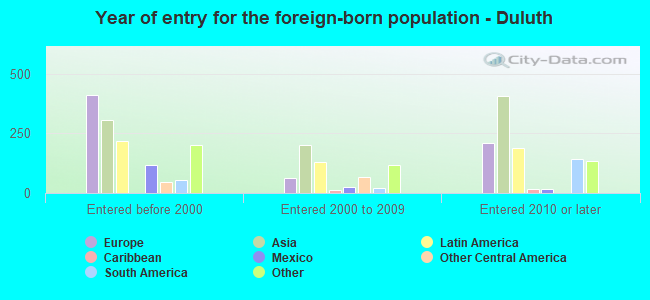
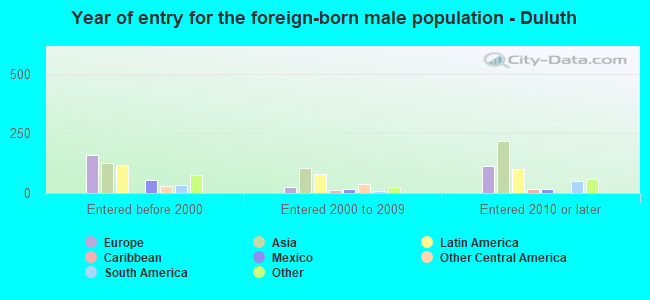
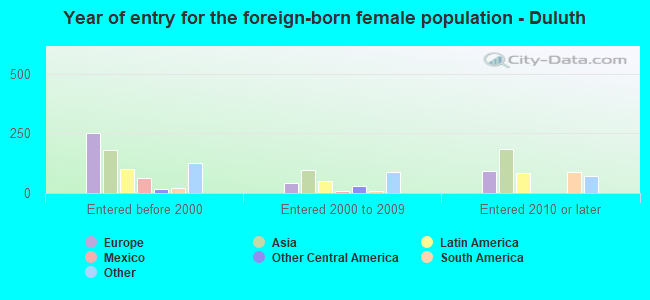
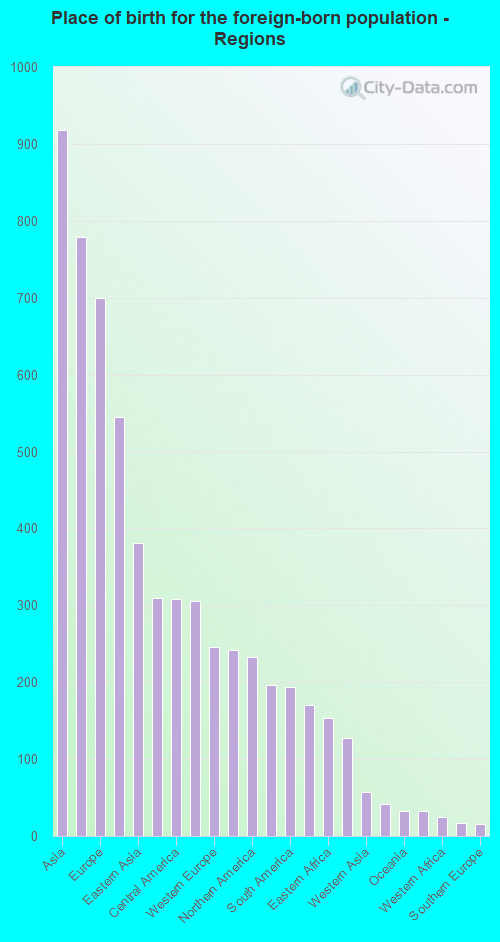
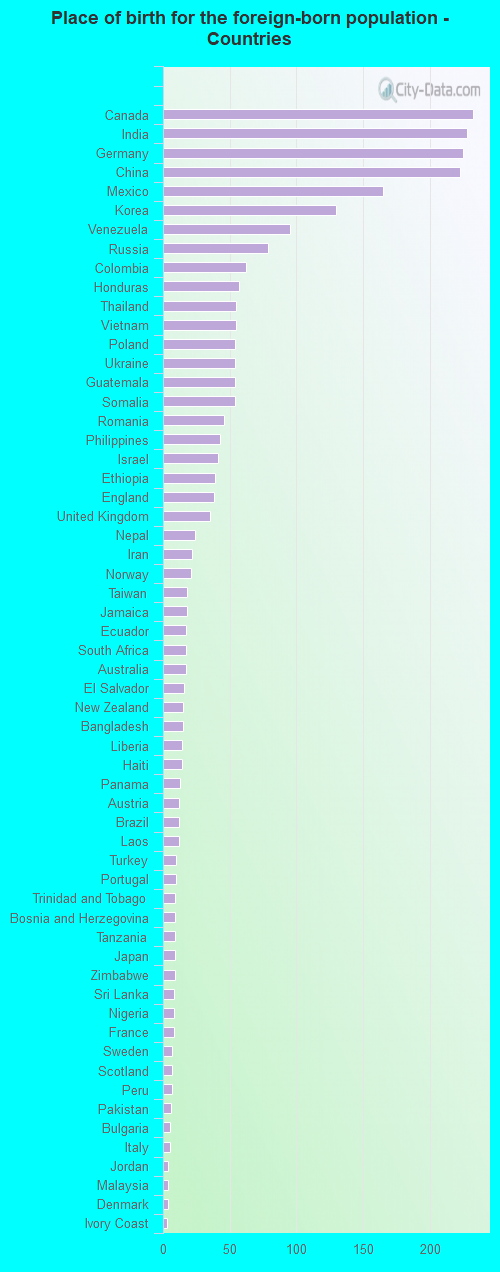
According to 2022 data, the most numerous races in Duluth, MN are White alone (74,085 residents), Black alone (2,984 residents), and Hispanic (2,498 residents). 96.3% of Duluth residents speak English at home. 3.0% of Duluth, MN residents are foreign-born (1.0% born in Asia, 0.8% born in Europe, 0.6% born in Latin America), which is 163.5% less than the foreign-born rate of 8.0% across the entire state of Minnesota.
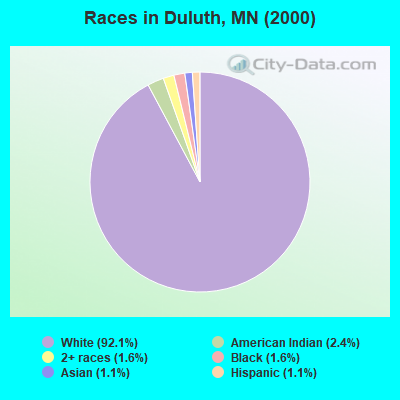
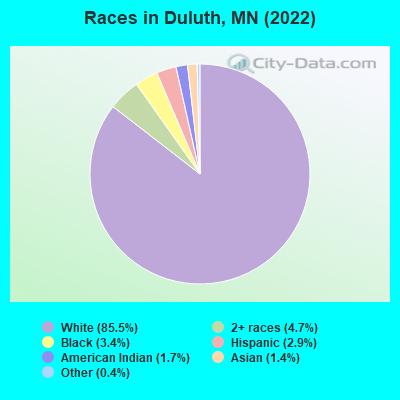
Race distribution in Duluth
2000 2022
80,043 92.1% White alone 2,056 2.4% American Indian alone 1,389 1.6% Black alone 1,431 1.6% Two or more races 921 1.1% Hispanic 989 1.1% Asian alone 64 0.07% Other race alone 25 0.03% Native Hawaiian and Other
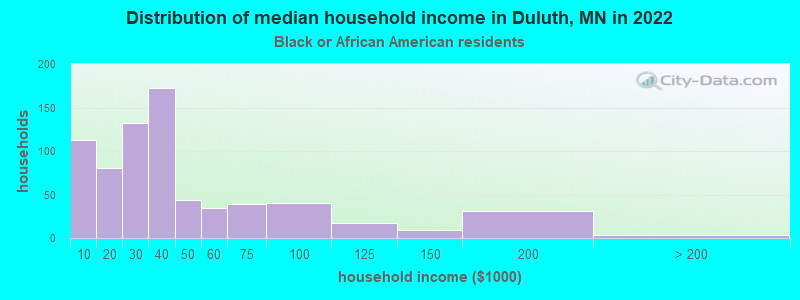
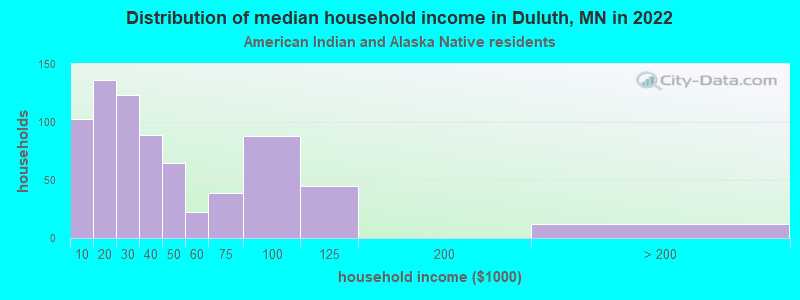
74,085 85.5% White alone 4,029 4.7% Two or more races 2,984 3.4% Black alone 2,498 2.9% Hispanic 1,441 1.7% American Indian alone 1,248 1.4% Asian alone 330 0.4% Other race alone
2000 2022
4,337,143 88.2% White alone 168,813 3.4% Black alone 143,382 2.9% Hispanic 141,083 2.9% Asian alone 70,304 1.4% Two or more races 52,009 1.1% American Indian alone 5,031 0.1% Other race alone 1,714 0.03% Native Hawaiian and Other
4,356,347 76.2% White alone 395,179 6.9% Black alone 333,830 5.8% Hispanic 294,800 5.2% Asian alone 259,649 4.5% Two or more races 42,125 0.7% American Indian alone 32,976 0.6% Other race alone 2,278 0.04% Native Hawaiian and Other
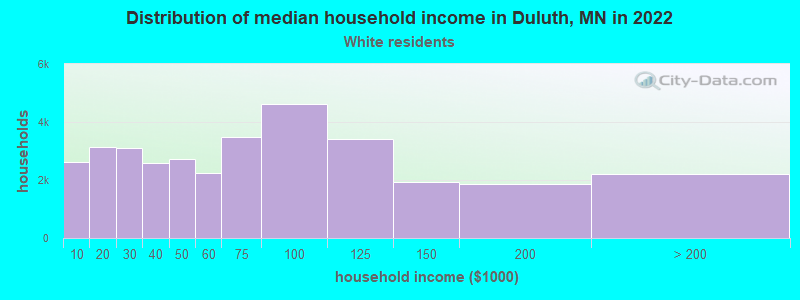
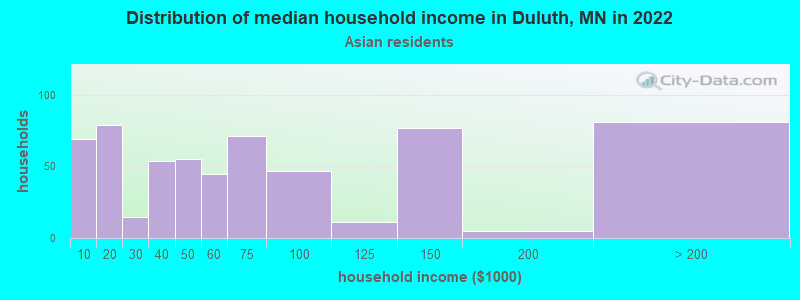
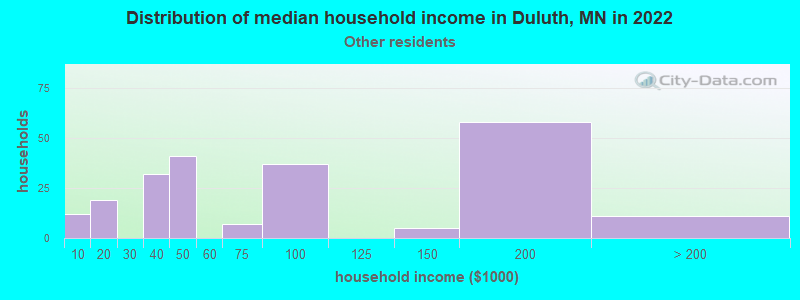
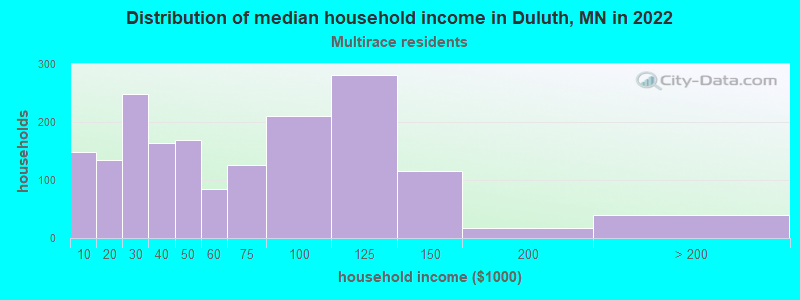
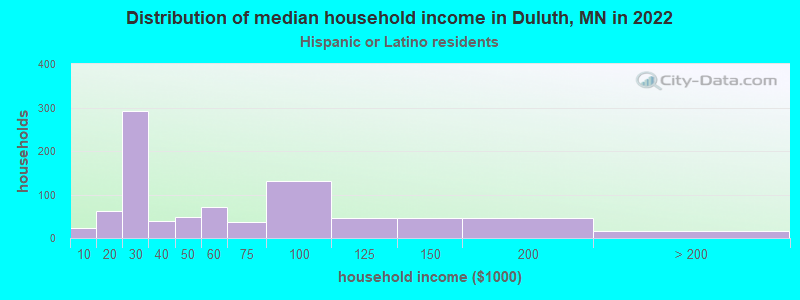
Income and house value in Duluth Median household income in 2022 $62,012 White non-Hispanic householders$41,178 Black householders$23,419 American Indian and Alaska Native householders$55,250 Asian householders$46,288 Two or more races householders$50,210 Hispanic or Latino race householdersMedian 2022 house value $234,874 White Non-Hispanic householders$198,939 Black or African American householders$211,301 American Indian or Alaska Native householders $248,386 Asian householders$646,840 Native Hawaiian and other Pacific Islander householders$209,863 Some other race householders$231,425 Two or more races householders$221,075 Hispanic or Latino householders
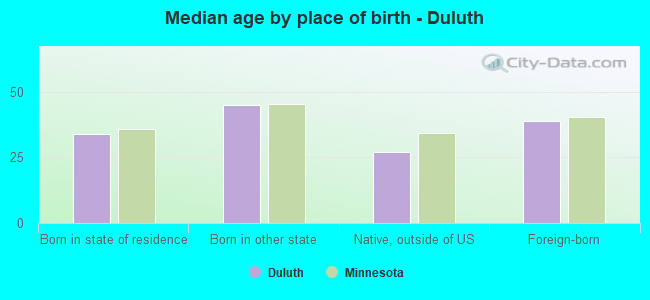
Median age by race in Duluth
38.6 Median age for White residents37.7 39.6 20.8 Median age for Black or African American residents18.7 23.5 23.9 Median age for American Indian / Alaska Native residents43.1 23.5 38.9 Median age for Asian residents36.9 38.9 -666,666,666.0 Median age for Native Hawaiian / Pacific Islander residents-666,666,666.0 -666,666,666.0 22.8 Median age for Other race residents21.8 43.5 22.2 Median age for Two or more races residents18.1 37.2 39.1 Median age for White alone residents37.9 39.9 20.7 Median age for Hispanic or Latino residents23.4 20.0
Owner/renter occupied households by race in Duluth
House owners and renters - White residents 20,775 61.2% Owner occupied13,153 38.8% Renter occupiedHouse owners and renters - Black or African American residents 348 36.9% Owner occupied596 63.1% Renter occupiedHouse owners and renters - American Indian / Alaska Native residents 186 16.8% Owner occupied918 83.2% Renter occupiedHouse owners and renters - Asian residents 679 88.2% Owner occupied91 11.8% Renter occupiedHouse owners and renters - Other race residents 143 65.7% Owner occupied75 34.3% Renter occupiedHouse owners and renters - Two or more races residents 557 31.8% Owner occupied1,196 68.2% Renter occupiedHouse owners and renters - White alone residents 20,702 61.8% Owner occupied12,817 38.2% Renter occupiedHouse owners and renters - Hispanic or Latino residents 256 24.1% Owner occupied806 75.9% Renter occupied
Language usage in Duluth
English speakers - Total 96.3% of residents of Duluth speak English at home.
1.3% of residents speak Spanish at home 689 66.2% Speak English very well352 33.8% Speak English less than very well2.1% of residents speak other language at home 1,229 69.9% Speak English very well528 30.1% Speak English less than very well
English speakers - Born in the United States 96.9% of residents of Duluth speak English at home.
1.7% of residents speak Spanish at home 317 85.0% Speak English very well56 15.0% Speak English less than very well0.9% of residents speak other language at home 174 92.6% Speak English very well14 7.4% Speak English less than very well
English speakers - Native, born elsewhere 98.1% of residents of Duluth speak English at home.
0.4% of residents speak Spanish at home 3 100.0% Speak English very well16.7% of residents speak other language at home 117 100.0% Speak English very well
English speakers - Foreign-born 43.0% of residents of Duluth speak English at home.
17.0% of residents speak Spanish at home 186 53.1% Speak English very well164 46.9% Speak English less than very well44.8% of residents speak other language at home 512 55.5% Speak English very well410 44.5% Speak English less than very well
White (Caucasian) - Speak only English Native:
98.8% (70,176)Foreign-born:
85.7% (724)
White (Caucasian) - Speak another language Native:
1.2% (884)Foreign-born:
14.3% (121)
Black or African American - Speak only English Native:
89.3% (1,625)Foreign-born:
18.6% (39)
Black or African American - Speak another language Native:
9.6% (174)Foreign-born:
81.5% (172)
Asian - Speak only English Native:
80.5% (194)Foreign-born:
30.2% (314)
Asian - Speak another language Native:
19.5% (47)Foreign-born:
69.8% (727)
Other race - Speak only English Native:
64.6% (376)Foreign-born:
3.1% (7)
Other race - Speak another language Native:
37.3% (217)Foreign-born:
94.9% (222)
Two or more races - Speak only English Native:
92.4% (4,096)Foreign-born:
27.7% (92)
Two or more races - Speak another language Native:
7.8% (346)Foreign-born:
70.5% (235)
White alone - Speak only English Native:
98.8% (69,345)Foreign-born:
84.9% (682)
White alone - Speak another language Native:
1.2% (818)Foreign-born:
15.1% (121)
Hispanic or Latino - Speak only English Native:
81.5% (1,448)Foreign-born:
48.8% (163)
Hispanic or Latino - Speak another language Native:
18.1% (322)Foreign-born:
54.2% (181)
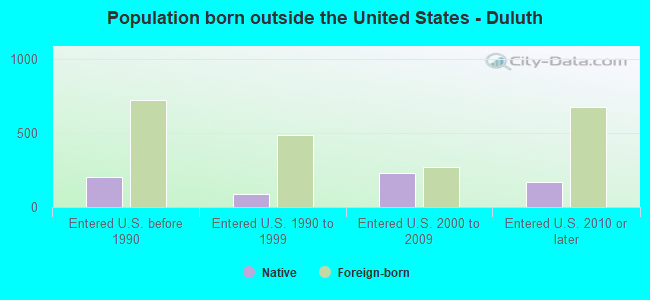
Foreign-born residents in Duluth 2,627 residents are foreign born (1.0% Asia , 0.8% Europe , 0.6% Latin America ).
This city:
3.0%Minnesota:
8.5%
Marital status for residents in Duluth Marital status - White (Caucasian) population 15 years and over
Males 42.7% Never married45.1% Now married0.1% Separated1.7% Widowed10.4% DivorcedFemales 39.2% Never married38.8% Now married0.2% Separated10.2% Widowed11.5% DivorcedWomen who gave birth in the past 12 months Now married:
82.9% (603)Unmarried:
17.1% (124)
Women who did not give birth in the past 12 months Now married:
31.0% (5,873)Unmarried:
69.0% (13,093)
Marital status - Black or African American population 15 years and over
Males 76.2% Never married11.3% Now married1.0% Separated3.2% Widowed8.3% DivorcedFemales 58.7% Never married21.8% Now married4.2% Separated3.3% Widowed12.0% DivorcedWomen who gave birth in the past 12 months Now married:
50.0% (18)Unmarried:
50.0% (18)
Women who did not give birth in the past 12 months Now married:
20.3% (112)Unmarried:
79.7% (441)
Marital status - American Indian / Alaska Native population 15 years and over
Males 66.8% Never married13.0% Now married2.7% Separated4.5% Widowed13.0% DivorcedFemales 72.9% Never married8.0% Now married1.4% Separated7.3% Widowed10.5% DivorcedWomen who gave birth in the past 12 months Now married:
0.0% (0)Unmarried:
100.0% (48)
Women who did not give birth in the past 12 months Now married:
7.2% (40)Unmarried:
92.8% (510)
Marital status - Asian population 15 years and over
Males 57.4% Never married35.0% Now married4.6% Separated0.0% Widowed2.9% DivorcedFemales 56.1% Never married36.7% Now married0.0% Separated3.0% Widowed4.2% DivorcedWomen who gave birth in the past 12 months Now married:
100.0% (18)Unmarried:
0.0% (0)
Women who did not give birth in the past 12 months Now married:
27.8% (142)Unmarried:
72.2% (369)
Marital status - Other race population 15 years and over
Males 47.2% Never married22.4% Now married6.8% Separated4.0% Widowed19.6% DivorcedFemales 53.6% Never married28.2% Now married1.2% Separated6.0% Widowed10.9% DivorcedWomen who did not give birth in the past 12 months Now married:
35.4% (96)Unmarried:
64.6% (174)
Marital status - Two or more races population 15 years and over
Males 81.3% Never married18.7% Now married0.0% Separated0.0% Widowed0.0% DivorcedFemales 39.2% Never married18.9% Now married0.0% Separated6.2% Widowed35.7% DivorcedWomen who gave birth in the past 12 months Now married:
50.0% (37)Unmarried:
50.0% (37)
Women who did not give birth in the past 12 months Now married:
26.7% (273)Unmarried:
73.3% (751)
Marital status - White alone, not Hispanic / Latino population 15 years and over
Males 41.9% Never married45.9% Now married0.1% Separated1.8% Widowed10.3% DivorcedFemales 38.9% Never married39.1% Now married0.2% Separated10.4% Widowed11.4% DivorcedWomen who gave birth in the past 12 months Now married:
82.9% (603)Unmarried:
17.1% (124)
Women who did not give birth in the past 12 months Now married:
31.2% (5,845)Unmarried:
68.8% (12,867)
Marital status - Hispanic or Latino population 15 years and over
Males 54.5% Never married28.8% Now married2.0% Separated1.2% Widowed13.6% DivorcedFemales 59.8% Never married27.0% Now married0.4% Separated2.3% Widowed10.6% DivorcedWomen who did not give birth in the past 12 months Now married:
28.7% (187)Unmarried:
71.3% (464)
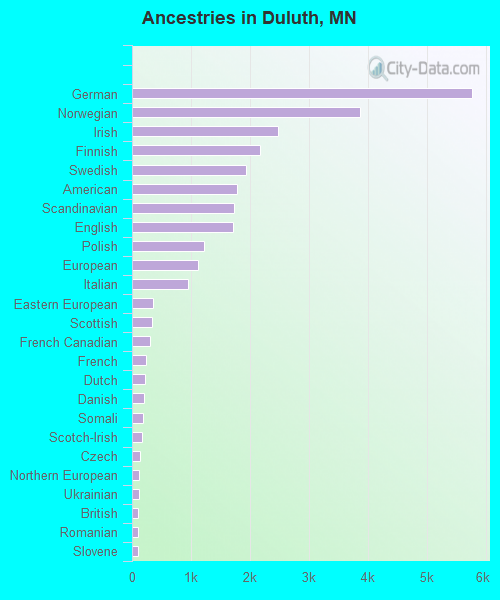
Ancestries in Duluth
5,769 16.5% German3,867 11.0% Norwegian2,471 7.1% Irish2,177 6.2% Finnish1,937 5.5% Swedish1,789 5.1% American1,739 5.0% Scandinavian1,714 4.9% English1,216 3.5% Polish1,117 3.2% European955 2.7% Italian355 1.0% Eastern European332 0.9% Scottish297 0.8% French Canadian238 0.7% French224 0.6% Dutch204 0.6% Danish185 0.5% Somali176 0.5% Scotch-Irish140 0.4% Czech124 0.4% Northern European121 0.3% Ukrainian104 0.3% British101 0.3% Romanian97 0.3% Slovene74 0.2% Serbian73 0.2% Russian67 0.2% Welsh63 0.2% Greek57 0.2% Croatian56 0.2% Israeli55 0.2% Slovak52 0.1% Iraqi48 0.1% Canadian46 0.1% African40 0.1% Albanian31 0.09% Jamaican30 0.09% Portuguese30 0.09% Iranian27 0.08% Hungarian26 0.07% Luxembourger24 0.07% Celtic19 0.05% Belgian18 0.05% Pennsylvania German18 0.05% Ethiopian17 0.05% Haitian13 0.04% Australian12 0.03% Palestinian11 0.03% Bulgarian11 0.03% Latvian9 0.03% Trinidadian and Tobagonian8 0.02% German Russian8 0.02% Swiss7 0.02% Lithuanian7 0.02% Turkish6 0.02% Austrian5 0.01% Czechoslovakian5 0.01% Nigerian3 0.01% Yugoslavian2 0.01% Arab
Geographical mobility in Duluth Same house 1 year ago 60,967 81.7% White (Caucasian)1,596 59.7% Black or African American1,199 68.2% American Indian / Alaska Native1,013 69.6% Asian629 72.0% Other race4,140 80.0% Two or more races60,154 82.0% White alone, not Hispanic / Latino1,500 60.0% Hispanic or LatinoMoved within same county 5,926 7.9% White / Caucasian306 11.4% Black or African American109 6.2% American Indian / Alaska Native129 8.9% Asian48 5.5% Other race421 8.1% Two or more races5,885 8.0% White alone, not Hispanic / Latino192 7.7% Hispanic or LatinoMoved within same state 4,185 5.6% White / Caucasian335 12.5% Black or African American419 23.8% American Indian / Alaska Native124 8.5% Asian3 100.0% Native Hawaiian / Pacific Islander10 1.2% Other race320 6.2% Two or more races3,965 5.4% White alone, not Hispanic / Latino590 23.6% Hispanic or LatinoMoved from different state 3,487 4.7% White / Caucasian438 16.4% Black or African American30 1.7% American Indian / Alaska Native95 6.5% Asian152 17.4% Other race267 5.2% Two or more races3,322 4.5% White alone, not Hispanic / Latino216 8.6% Hispanic or LatinoMoved from abroad 61 0.1% White96 6.6% Asian10 0.2% Two or more races61 0.1% White alone, not Hispanic / Latino
Children Nativity (place of birth) in Duluth
Children under 6 years - Living with two parents Both parents native 3,222 100.0% Native0 0.0% Foreign-bornBoth parents foreign-born 165 98.1% Native3 1.9% Foreign-bornOne native, one foreign-born parent 219 100.0% NativeChildren under 6 years - Living with one parent Native parent 1,504 100.0% NativeForeign-born parent 105 100.0% NativeChildren 6 to 17 years - Living with two parents Both parents native 5,012 99.0% Native50 1.0% Foreign-bornBoth parents foreign-born 126 83.8% Native24 16.2% Foreign-bornOne native, one foreign-born parent 360 100.0% NativeChildren 6 to 17 years - Living with one parent Native parent 2,666 100.0% NativeForeign-born parent 212 52.0% Native196 48.0% Foreign-born
Grandparents responsible for own grandchildren in Duluth
Grandparents (30 to 59 years) White / Caucasian 28 26.3% Responsible for grandchildren78 73.7% Not responsible for grandchildrenBlack or African American 24 100.0% Not responsible for grandchildrenAmerican Indian / Alaska Native 7 100.0% Not responsible for grandchildrenTwo or more races 12 100.0% Responsible for grandchildrenWhite alone, not Hispanic / Latino 28 26.3% Responsible for grandchildren80 73.7% Not responsible for grandchildrenHispanic or Latino 7 100.0% Responsible for grandchildrenGrandparents (60 years and over) White / Caucasian 105 33.5% Responsible for grandchildren208 66.5% Not responsible for grandchildrenBlack or African American 2 100.0% Not responsible for grandchildrenAmerican Indian / Alaska Native 3 14.7% Responsible for grandchildren19 85.3% Not responsible for grandchildrenTwo or more races 1 100.0% Not responsible for grandchildrenWhite alone, not Hispanic / Latino 108 33.7% Responsible for grandchildren213 66.3% Not responsible for grandchildren