Races in Dunbarton, New Hampshire (NH) Detailed Stats
Ancestries, Foreign-born residents, place of birth
3.4% of Dunbarton, NH residents are foreign-born (2.1% born in Europe, 0.6% born in North America, 0.4% born in Latin America), which is 48.4% less than the foreign-born rate of 5.0% across the entire state of New Hampshire.
Race distribution in Dunbarton

- 2,18598.2%White alone
- 120.5%Two or more races
- 100.4%Asian alone
- 90.4%American Indian alone
- 70.3%Hispanic
- 20.09%Black alone
- 10.04%Other race alone
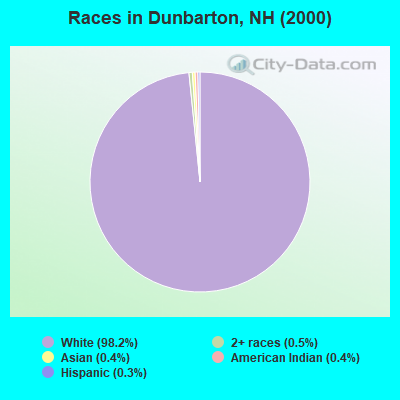
2000
2022
-
- 1,175,25295.1%White alone
- 20,4891.7%Hispanic
- 15,8031.3%Asian alone
- 11,6060.9%Two or more races
- 8,3540.7%Black alone
- 2,6980.2%American Indian alone
- 1,2540.1%Other race alone
- 3300.03%Native Hawaiian and Other
Pacific Islander alone

-
- 1,208,10186.6%White alone
- 63,4794.5%Hispanic
- 60,7244.4%Two or more races
- 36,5192.6%Asian alone
- 17,9311.3%Black alone
- 6,6150.5%Other race alone
- 1,0140.07%American Indian alone
- 8480.06%Native Hawaiian and Other
Pacific Islander alone

Income and house value in Dunbarton
- Median household income in 2022
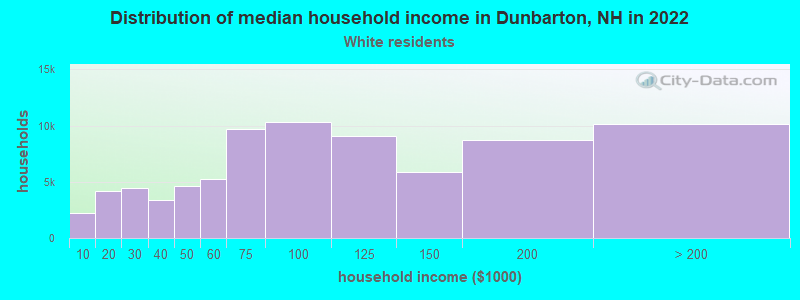
- $114,518White non-Hispanic householders
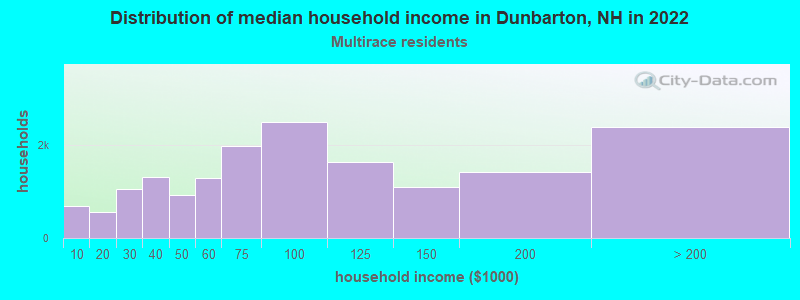
- $97,855Two or more races householders
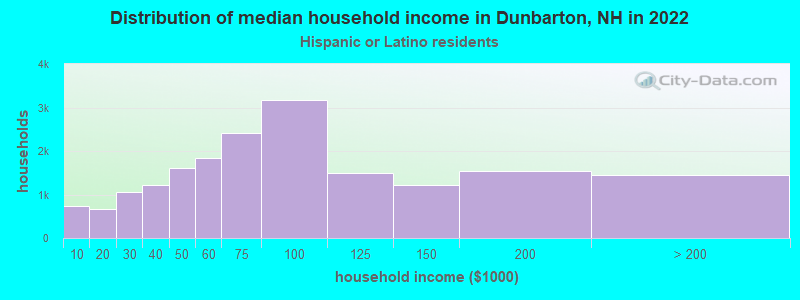
- $63,530Hispanic or Latino race householders
- Median 2022 house value
- $465,975White Non-Hispanic householders
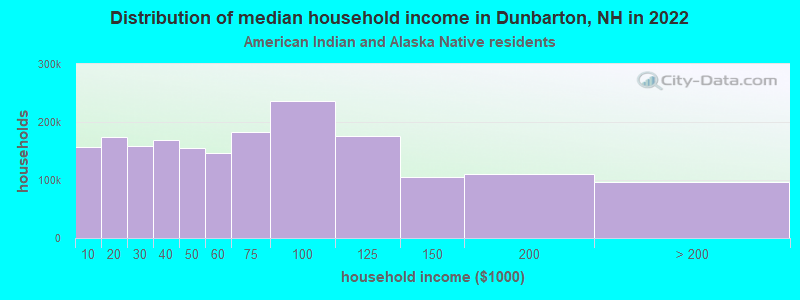
- $456,274American Indian or Alaska Native householders
- $303,556Two or more races householders
- $704,126Hispanic or Latino householders
Household income for White non-Hispanic householders
Household income for American Indian and Alaska Native householders
Household income for Two or more races householders
Household income for Hispanic or Latino race householders
Foreign-born residents in Dunbarton
75 residents are foreign born (2.1% Europe, 0.6% North America, 0.4% Latin America).
| This city: | 3.4% |
| New Hampshire: | 4.4% |
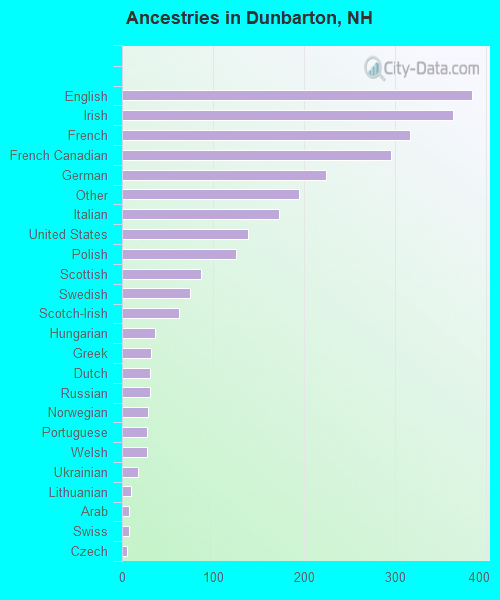
Ancestries in Dunbarton

- 38414.2%English
- 36413.5%Irish
- 31611.7%French
- 29611.0%French Canadian
- 2248.3%German
- 1947.2%Other
- 1726.4%Italian
- 1385.1%United States
- 1254.6%Polish
- 873.2%Scottish
- 752.8%Swedish
- 632.3%Scotch-Irish
- 361.3%Hungarian
- 321.2%Greek
- 311.1%Dutch
- 311.1%Russian
- 291.1%Norwegian
- 281.0%Portuguese
- 271.0%Welsh
- 180.7%Ukrainian
- 100.4%Lithuanian
- 80.3%Arab
- 80.3%Swiss
- 50.2%Czech
Zip codes: 03045.