Races in Dunkirk, Maryland (MD) Detailed Stats
Ancestries, Foreign-born residents, place of birth
Data:
Latest news about races in Dunkirk, MD collected exclusively by city-data.com from local newspapers, TV, and radio stations
1.0% of Dunkirk, MD residents are foreign-born , which is 1543.8% less than the foreign-born rate of 16.0% across the entire state of Maryland.
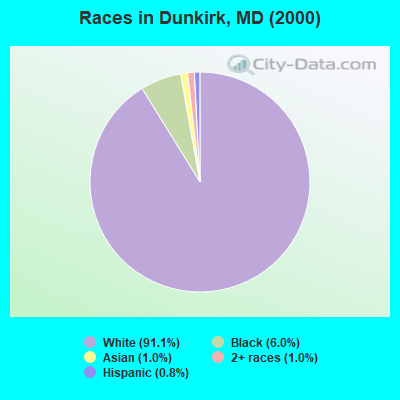
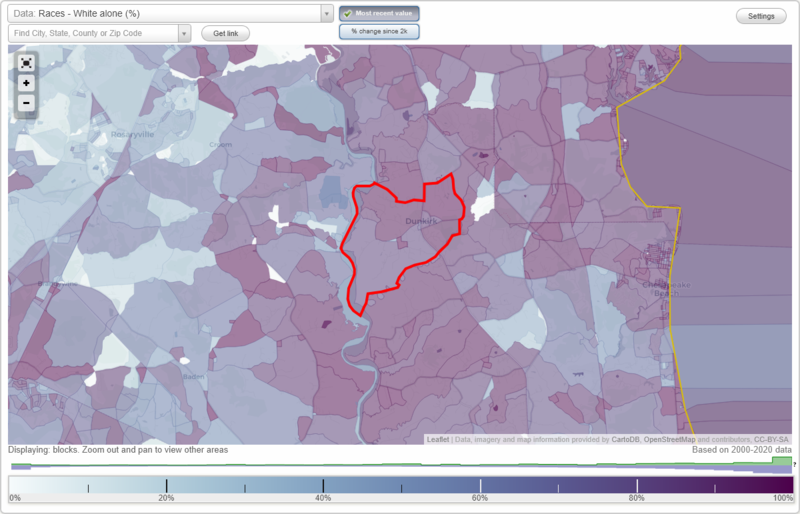
Race distribution in Dunkirk

- 2,15291.1%White alone
- 1416.0%Black alone
- 231.0%Asian alone
- 231.0%Two or more races
- 200.8%Hispanic
- 20.08%Other race alone
- 20.08%American Indian alone
2000
2022
-
- 3,286,54762.1%White alone
- 1,464,73527.7%Black alone
- 227,9164.3%Hispanic
- 209,7384.0%Asian alone
- 82,9461.6%Two or more races
- 13,3120.3%American Indian alone
- 9,3790.2%Other race alone
- 1,9130.04%Native Hawaiian and Other
Pacific Islander alone
-
- 2,906,49247.1%White alone
- 1,800,91429.2%Black alone
- 705,84211.4%Hispanic
- 401,8186.5%Asian alone
- 291,3174.7%Two or more races
- 46,9300.8%Other race alone
- 8,9300.1%American Indian alone
- 2,4170.04%Native Hawaiian and Other
Pacific Islander alone
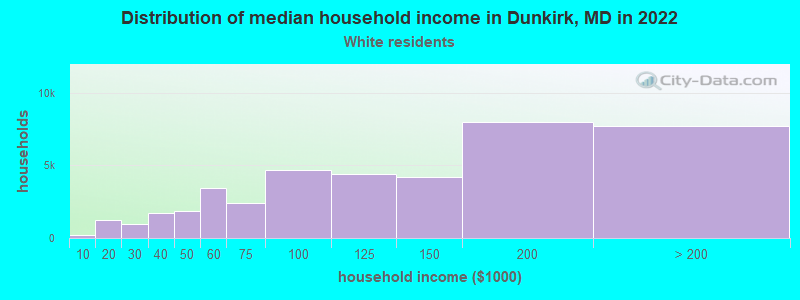
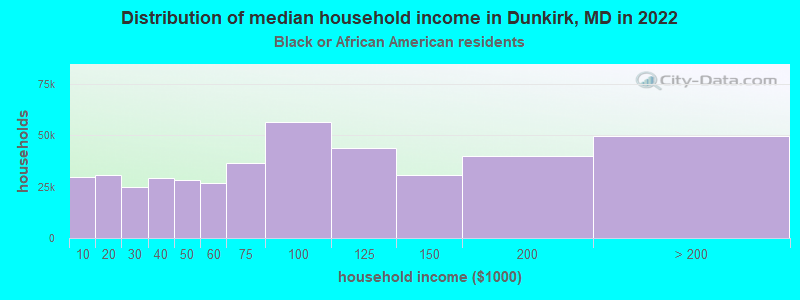
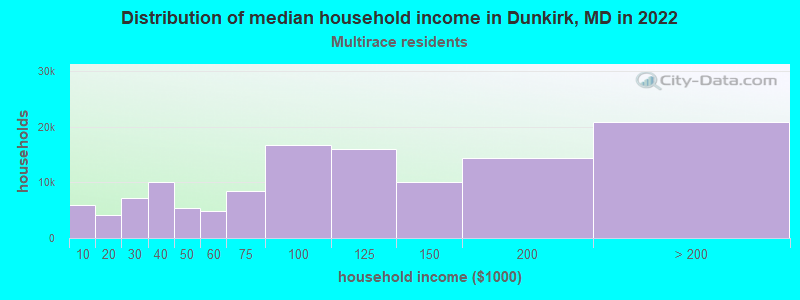
Income and house value in Dunkirk
- Median household income in 2022
- $177,327White non-Hispanic householders
- $90,690Black householders
- over $200,000Two or more races householders
- Median 2022 house value
- $589,225White Non-Hispanic householders
- $578,176Black or African American householders
- $289,088Two or more races householders
Foreign-born residents in Dunkirk
23 residents are foreign born
| This city: | 1.0% |
| Maryland: | 9.8% |
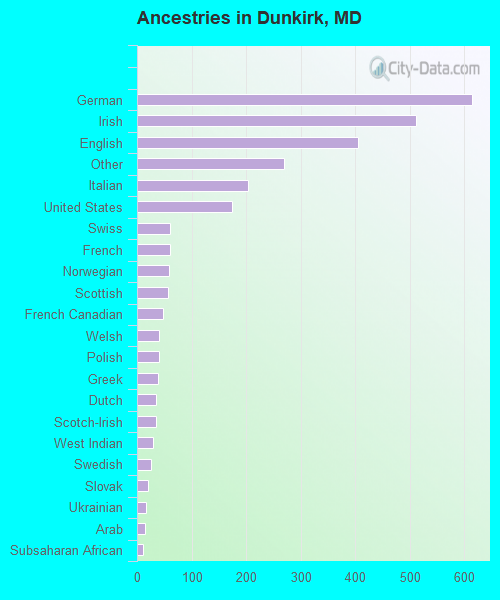
Ancestries in Dunkirk

- 61522.1%German
- 51218.4%Irish
- 40614.6%English
- 2709.7%Other
- 2047.3%Italian
- 1746.3%United States
- 612.2%Swiss
- 602.2%French
- 592.1%Norwegian
- 572.1%Scottish
- 481.7%French Canadian
- 411.5%Welsh
- 401.4%Polish
- 381.4%Greek
- 341.2%Dutch
- 341.2%Scotch-Irish
- 291.0%West Indian
- 250.9%Swedish
- 210.8%Slovak
- 160.6%Ukrainian
- 150.5%Arab
- 110.4%Subsaharan African
- 50.2%Danish
- 50.2%Lithuanian