Races in East Adams, Colorado (CO) Detailed Stats
Ancestries, Foreign-born residents, place of birth
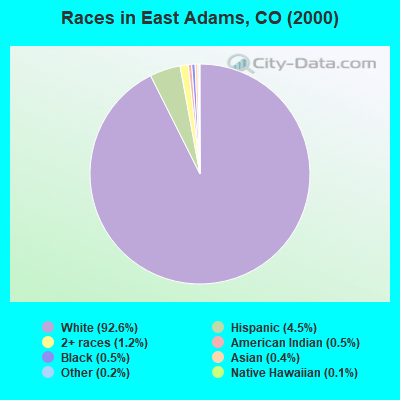
Race distribution in East Adams

- 5,23092.6%White alone
- 2544.5%Hispanic
- 681.2%Two or more races
- 290.5%Black alone
- 310.5%American Indian alone
- 200.4%Asian alone
- 120.2%Other race alone
- 60.1%Native Hawaiian and Other
Pacific Islander alone
2000
2022
-
- 3,202,88074.5%White alone
- 735,60117.1%Hispanic
- 158,4433.7%Black alone
- 93,2772.2%Asian alone
- 72,7211.7%Two or more races
- 28,9820.7%American Indian alone
- 5,5120.1%Other race alone
- 3,8450.09%Native Hawaiian and Other
Pacific Islander alone

-
- 3,793,27065.0%White alone
- 1,314,96222.5%Hispanic
- 268,7544.6%Two or more races
- 220,7563.8%Black alone
- 182,6583.1%Asian alone
- 29,7980.5%Other race alone
- 23,3890.4%American Indian alone
- 6,3390.1%Native Hawaiian and Other
Pacific Islander alone

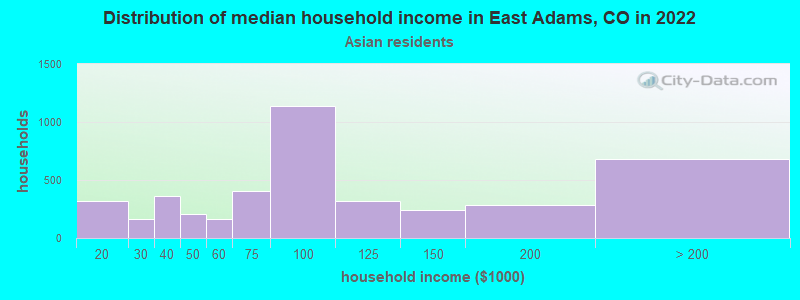
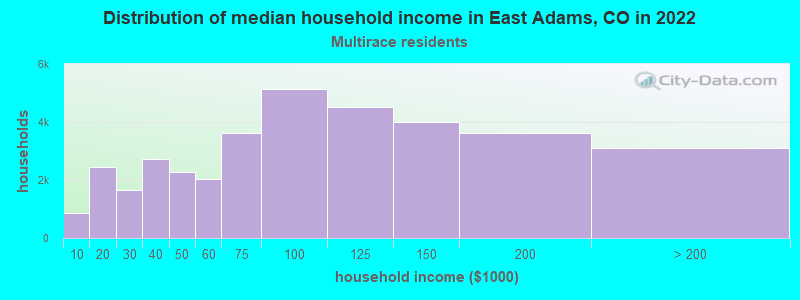
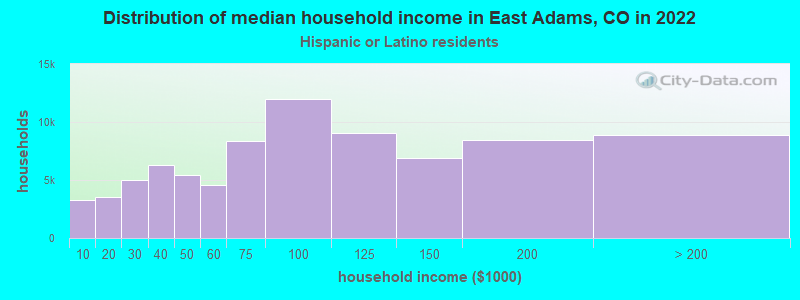
Income and house value in East Adams
- Median household income in 2022
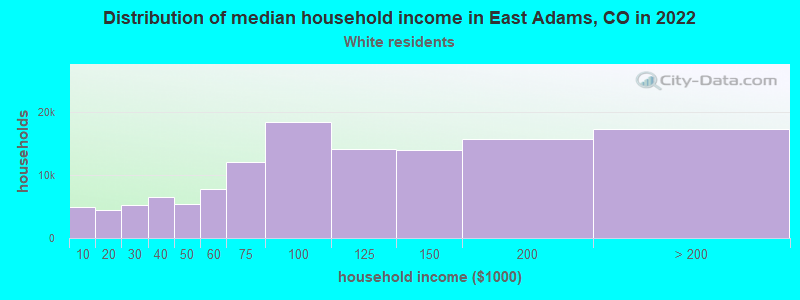
- $94,916White non-Hispanic householders
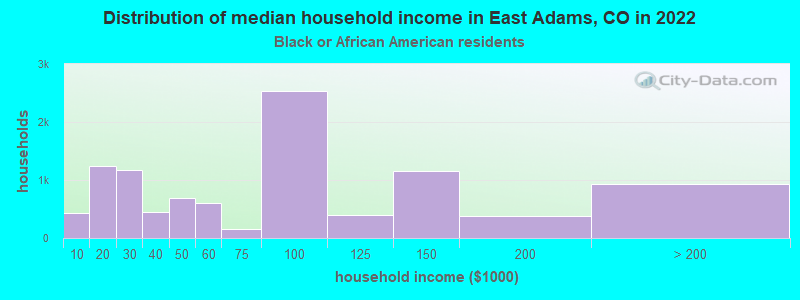
- $143,506Black householders
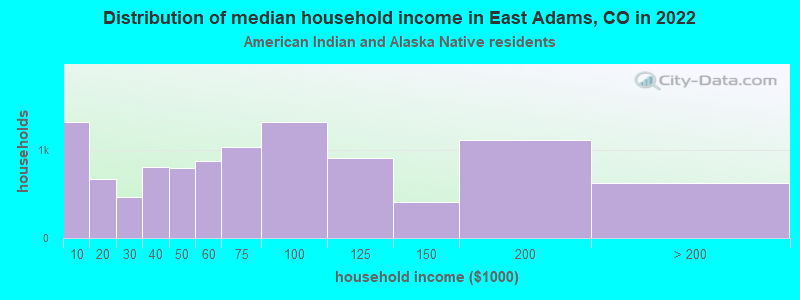
- $57,221American Indian and Alaska Native householders
- $68,123Asian householders
- $63,568Some other race householders
- $86,992Two or more races householders
- $112,970Hispanic or Latino race householders
- Median 2022 house value
- $472,052White Non-Hispanic householders
- $456,128Black or African American householders
- $373,196American Indian or Alaska Native householders
- $477,027Asian householders
- $331,730Two or more races householders
- $490,628Hispanic or Latino householders
Household income for White non-Hispanic householders
Household income for Black householders
Household income for American Indian and Alaska Native householders
Household income for Asian householders
Household income for Two or more races householders
Household income for Hispanic or Latino race householders
Zip code: 80136