Races in East Haddam, Connecticut (CT) Detailed Stats
Ancestries, Foreign-born residents, place of birth

Recent posts about races in East Haddam, Connecticut on our local forum with over 2,400,000 registered users:
 | 2024 Connecticut Town Tournament VI (Celebrating the 10-Year Anniversary & Dazzleman's Memorial) (641 replies) |
| Why the bad rap for East Haddam? (18 replies) |
| Connecticut TOWN TOURNAMENT V (2022) (831 replies) |
| PLEASE WEIGH IN on Essex/Chester/East Haddam VS. East Lyme, Old Saybrook & Niantic (13 replies) |
| Ideas for Late Sept Visit (43 replies) |
| Anywhere in CT fit this description? (54 replies) |
2.6% of East Haddam, CT residents are foreign-born (2.0% born in Europe, 0.6% born in North America), which is 473.4% less than the foreign-born rate of 15.0% across the entire state of Connecticut.
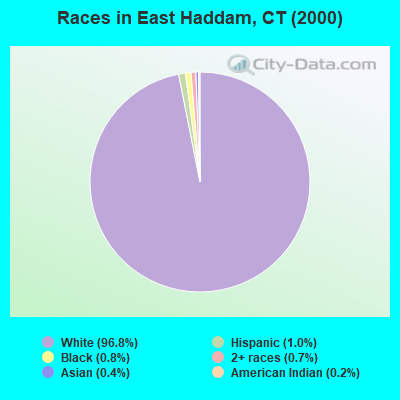
Race distribution in East Haddam

- 8,06496.8%White alone
- 821.0%Hispanic
- 670.8%Black alone
- 610.7%Two or more races
- 330.4%Asian alone
- 190.2%American Indian alone
- 70.08%Other race alone
2000
2022
-
- 2,638,84577.5%White alone
- 320,3239.4%Hispanic
- 295,5718.7%Black alone
- 81,5642.4%Asian alone
- 52,8961.6%Two or more races
- 8,1410.2%Other race alone
- 7,2670.2%American Indian alone
- 9580.03%Native Hawaiian and Other
Pacific Islander alone

-
- 2,246,91362.0%White alone
- 658,97818.2%Hispanic
- 353,9739.8%Black alone
- 172,9294.8%Asian alone
- 159,6314.4%Two or more races
- 29,7610.8%Other race alone
- 3,4280.09%American Indian alone
- 5920.02%Native Hawaiian and Other
Pacific Islander alone

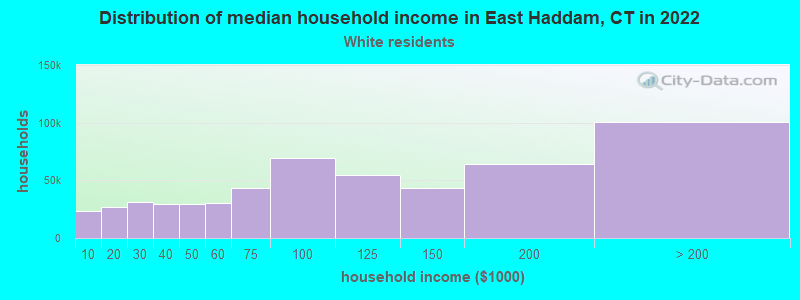
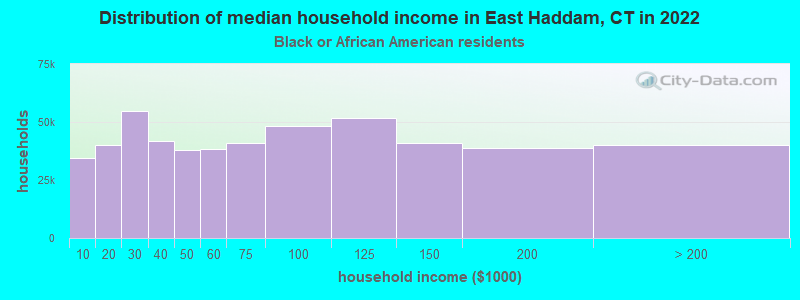
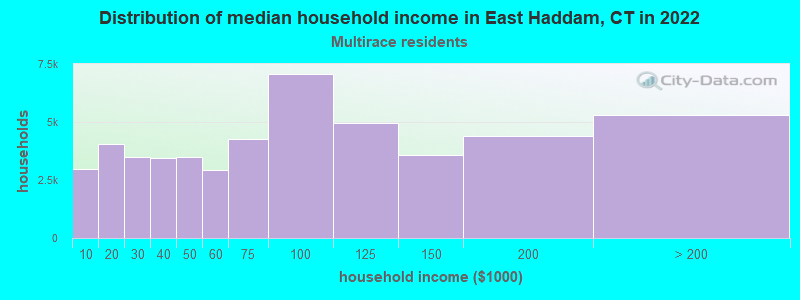
Income and house value in East Haddam
- Median household income in 2022
- $107,766White non-Hispanic householders
- $189,114Black householders
- $33,324Two or more races householders
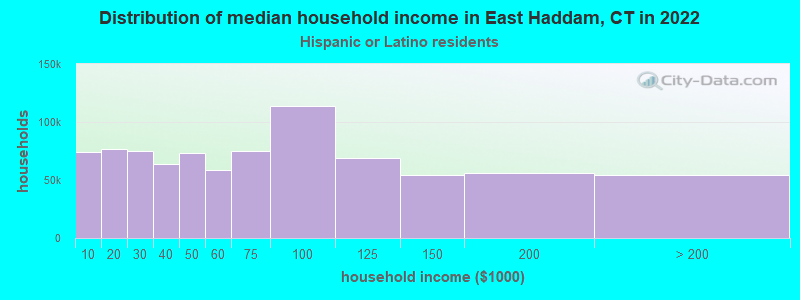
- $198,131Hispanic or Latino race householders
- Median 2022 house value
- $359,090White Non-Hispanic householders
- $486,425Black or African American householders
- $297,260Hispanic or Latino householders
Household income for White non-Hispanic householders
Household income for Black householders
Household income for Two or more races householders
Household income for Hispanic or Latino race householders
Foreign-born residents in East Haddam
218 residents are foreign born (2.0% Europe, 0.6% North America).
| This city: | 2.6% |
| Connecticut: | 10.9% |
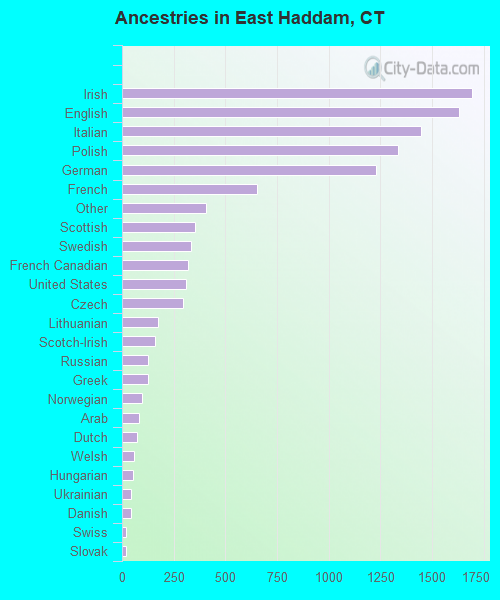
Ancestries in East Haddam

- 1,69215.2%Irish
- 1,63214.7%English
- 1,44613.0%Italian
- 1,33612.0%Polish
- 1,23211.1%German
- 6555.9%French
- 4073.7%Other
- 3533.2%Scottish
- 3343.0%Swedish
- 3202.9%French Canadian
- 3092.8%United States
- 2932.6%Czech
- 1721.5%Lithuanian
- 1621.5%Scotch-Irish
- 1271.1%Russian
- 1261.1%Greek
- 970.9%Norwegian
- 840.8%Arab
- 730.7%Dutch
- 570.5%Welsh
- 520.5%Hungarian
- 450.4%Ukrainian
- 430.4%Danish
- 210.2%Swiss
- 190.2%Slovak
- 90.08%Portuguese
- 80.07%West Indian
Zip codes: 06423.