Races in East Honolulu, Hawaii (HI) Detailed Stats
Data:
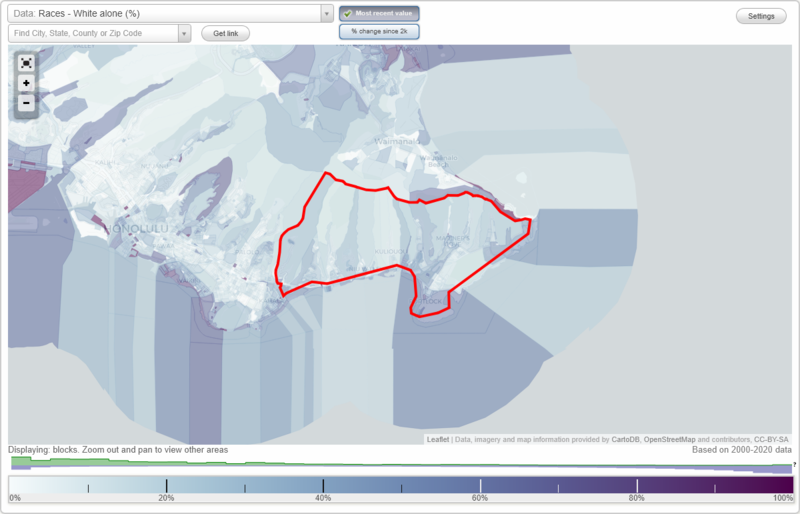
Races - White alone (%)
Races - White alone (% change since 2000)
Races - Black alone (%)
Races - Black alone (% change since 2000)
Races - American Indian alone (%)
Races - American Indian alone (% change since 2000)
Races - Asian alone (%)
Races - Asian alone (% change since 2000)
Races - Hispanic (%)
Races - Hispanic (% change since 2000)
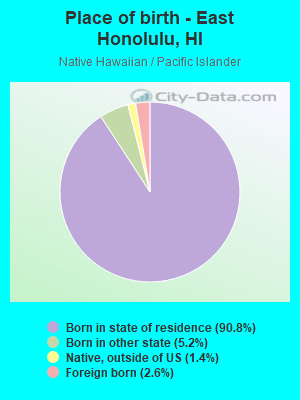
Races - Native Hawaiian and Other Pacific Islander alone (%)
Races - Native Hawaiian and Other Pacific Islander alone (% change since 2000)
Races - Two or more races(%)
Races - Two or more races(% change since 2000)
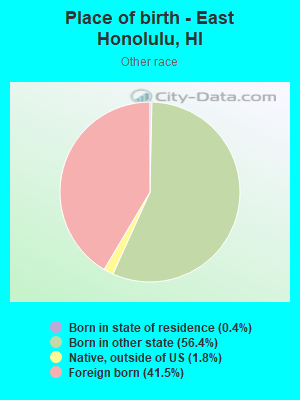
Races - Other race alone (%)
Races - Other race alone (% change since 2000)
Racial diversity
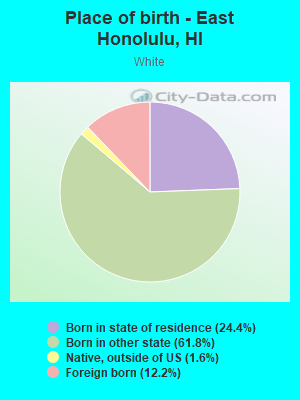
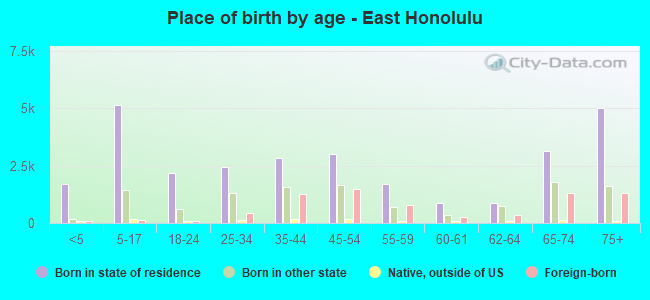
Place of birth - Born in state of residence (%)
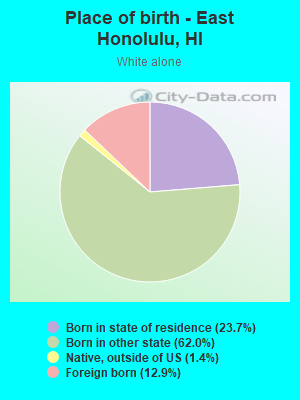
Place of birth - Born in state of residence (%) - White
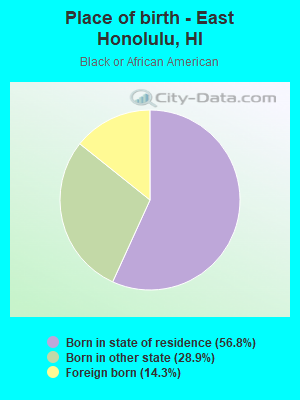
Place of birth - Born in state of residence (%) - Black or African American
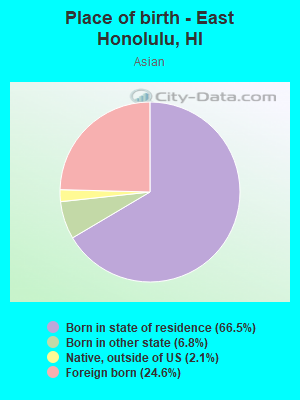
Place of birth - Born in state of residence (%) - Asian
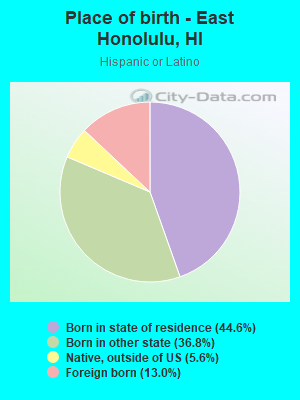
Place of birth - Born in state of residence (%) - Hispanic or Latino
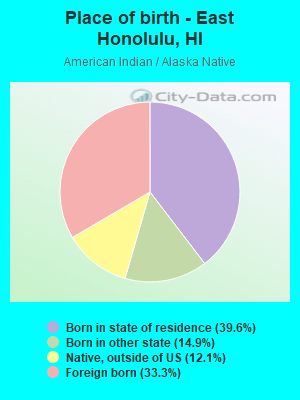
Place of birth - Born in state of residence (%) - American Indian and Alaska Native
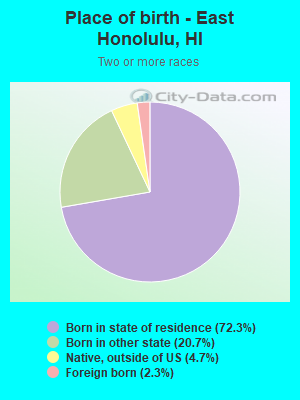
Place of birth - Born in state of residence (%) - Multirace
Place of birth - Born in state of residence (%) - Other Race
Place of birth - Born in other state (%)
Place of birth - Born in other state (%) - White
Place of birth - Born in other state (%) - Black or African American
Place of birth - Born in other state (%) - Asian
Place of birth - Born in other state (%) - Hispanic or Latino
Place of birth - Born in other state (%) - American Indian and Alaska Native
Place of birth - Born in other state (%) - Multirace
Place of birth - Born in other state (%) - Other Race
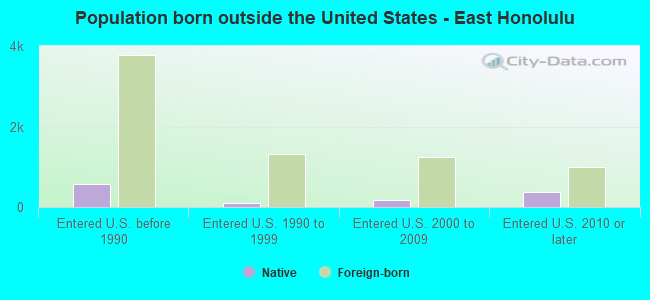
Place of birth - Native, outside of US (%)
Place of birth - Native, outside of US (%) - White
Place of birth - Native, outside of US (%) - Black or African American
Place of birth - Native, outside of US (%) - Asian
Place of birth - Native, outside of US (%) - Hispanic or Latino
Place of birth - Native, outside of US (%) - American Indian and Alaska Native
Place of birth - Native, outside of US (%) - Multirace
Place of birth - Native, outside of US (%) - Other Race
Place of birth - Foreign born (%)
Place of birth - Foreign born (%) - White
Place of birth - Foreign born (%) - Black or African American
Place of birth - Foreign born (%) - Asian
Place of birth - Foreign born (%) - Hispanic or Latino
Place of birth - Foreign born (%) - American Indian and Alaska Native
Place of birth - Foreign born (%) - Multirace
Place of birth - Foreign born (%) - Other Race
Residents speaking English at home (%)
Residents speaking English at home - Born in the United States (%)
Residents speaking English at home - Native, born elsewhere (%)
Residents speaking English at home - Foreign born (%)
Residents speaking Spanish at home (%)
Residents speaking Spanish at home - Born in the United States (%)
Residents speaking Spanish at home - Native, born elsewhere (%)
Residents speaking Spanish at home - Foreign born (%)
Residents speaking other language at home (%)
Residents speaking other language at home - Born in the United States (%)
Residents speaking other language at home - Native, born elsewhere (%)
Residents speaking other language at home - Foreign born (%)
Marital status - Never married (%)
Marital status - Now married (%)
Marital status - Separated (%)
Marital status - Widowed (%)
Marital status - Divorced (%)
Ancestries Reported - Arab (%)
Ancestries Reported - Czech (%)
Ancestries Reported - Danish (%)
Ancestries Reported - Dutch (%)
Ancestries Reported - English (%)
Ancestries Reported - French (%)
Ancestries Reported - French Canadian (%)
Ancestries Reported - German (%)
Ancestries Reported - Greek (%)
Ancestries Reported - Hungarian (%)
Ancestries Reported - Irish (%)
Ancestries Reported - Italian (%)
Ancestries Reported - Lithuanian (%)
Ancestries Reported - Norwegian (%)
Ancestries Reported - Polish (%)
Ancestries Reported - Portuguese (%)
Ancestries Reported - Russian (%)
Ancestries Reported - Scotch-Irish (%)
Ancestries Reported - Scottish (%)
Ancestries Reported - Slovak (%)
Ancestries Reported - Subsaharan African (%)
Ancestries Reported - Swedish (%)
Ancestries Reported - Swiss (%)
Ancestries Reported - Ukrainian (%)
Ancestries Reported - United States (%)
Ancestries Reported - Welsh (%)
Ancestries Reported - West Indian (%)
Ancestries Reported - Other (%)
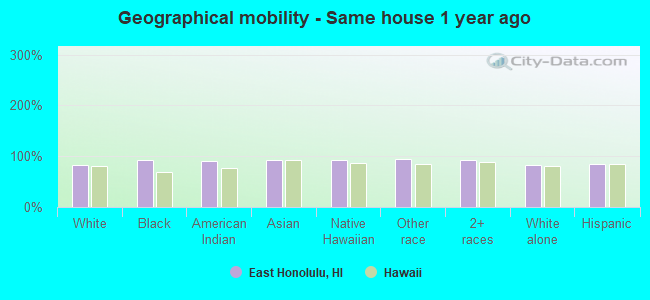
Geographical mobility - Same house 1 year ago (%)
Geographical mobility - Same house 1 year ago (%) - White
Geographical mobility - Same house 1 year ago (%) - Black or African American
Geographical mobility - Same house 1 year ago (%) - Asian
Geographical mobility - Same house 1 year ago (%) - Hispanic or Latino
Geographical mobility - Same house 1 year ago (%) - American Indian and Alaska Native
Geographical mobility - Same house 1 year ago (%) - Multirace
Geographical mobility - Same house 1 year ago (%) - Other Race
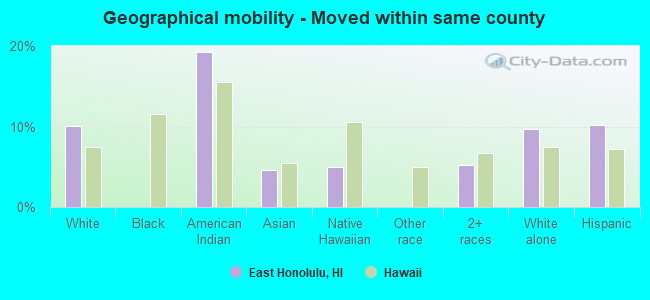
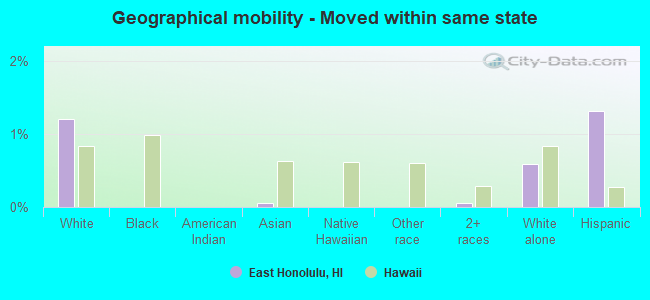
Geographical mobility - Moved within same county (%)
Geographical mobility - Moved within same county (%) - White
Geographical mobility - Moved within same county (%) - Black or African American
Geographical mobility - Moved within same county (%) - Asian
Geographical mobility - Moved within same county (%) - Hispanic or Latino
Geographical mobility - Moved within same county (%) - American Indian and Alaska Native
Geographical mobility - Moved within same county (%) - Multirace
Geographical mobility - Moved within same county (%) - Other Race
Geographical mobility - Moved from different county within same state (%)
Geographical mobility - Moved from different county within same state (%) - White
Geographical mobility - Moved from different county within same state (%) - Black or African American
Geographical mobility - Moved from different county within same state (%) - Asian
Geographical mobility - Moved from different county within same state (%) - Hispanic or Latino
Geographical mobility - Moved from different county within same state (%) - American Indian and Alaska Native
Geographical mobility - Moved from different county within same state (%) - Multirace
Geographical mobility - Moved from different county within same state (%) - Other Race
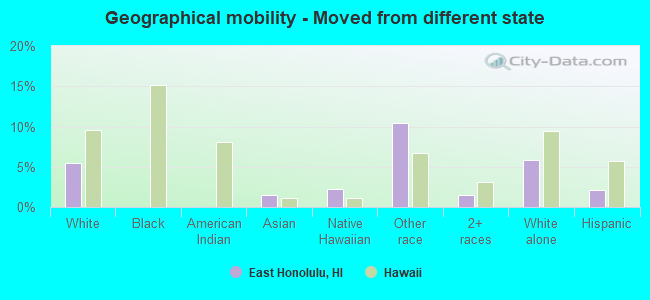
Geographical mobility - Moved from different state (%)
Geographical mobility - Moved from different state (%) - White
Geographical mobility - Moved from different state (%) - Black or African American
Geographical mobility - Moved from different state (%) - Asian
Geographical mobility - Moved from different state (%) - Hispanic or Latino
Geographical mobility - Moved from different state (%) - American Indian and Alaska Native
Geographical mobility - Moved from different state (%) - Multirace
Geographical mobility - Moved from different state (%) - Other Race
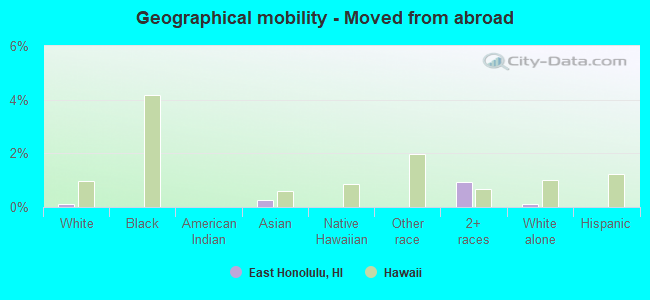
Geographical mobility - Moved from abroad (%)
Geographical mobility - Moved from abroad (%) - White
Geographical mobility - Moved from abroad (%) - Black or African American
Geographical mobility - Moved from abroad (%) - Asian
Geographical mobility - Moved from abroad (%) - Hispanic or Latino
Geographical mobility - Moved from abroad (%) - American Indian and Alaska Native
Geographical mobility - Moved from abroad (%) - Multirace
Geographical mobility - Moved from abroad (%) - Other Race
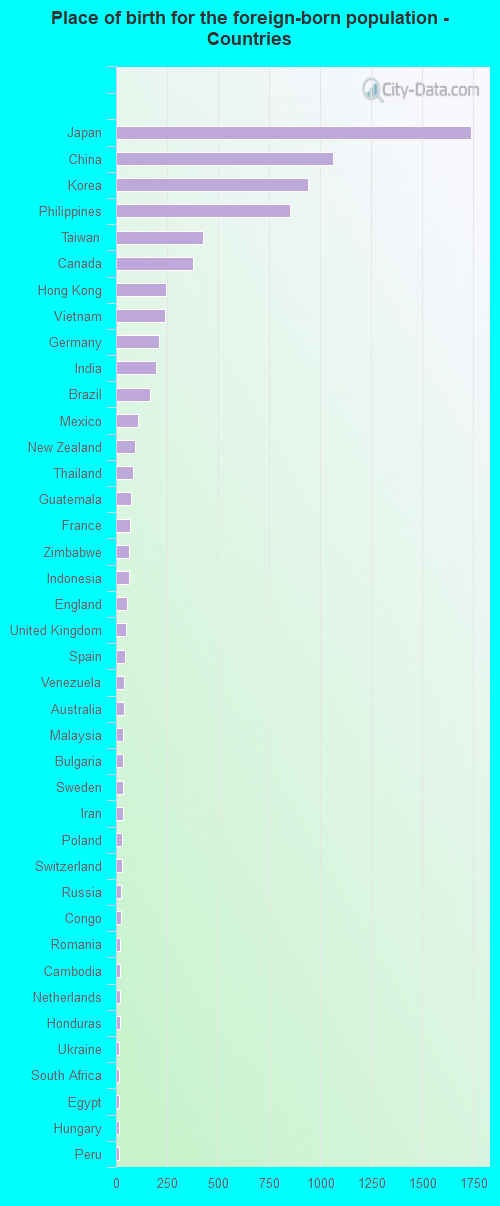
Place of birth for the foreign-born population - Ireland (%)
Place of birth for the foreign-born population - Denmark (%)
Place of birth for the foreign-born population - Norway (%)
Place of birth for the foreign-born population - Sweden (%)
Place of birth for the foreign-born population - United Kingdom (%)
Place of birth for the foreign-born population - England (%)
Place of birth for the foreign-born population - Scotland (%)
Place of birth for the foreign-born population - Other Northern Europe (%)
Place of birth for the foreign-born population - Austria (%)
Place of birth for the foreign-born population - Belgium (%)
Place of birth for the foreign-born population - France (%)
Place of birth for the foreign-born population - Germany (%)
Place of birth for the foreign-born population - Netherlands (%)
Place of birth for the foreign-born population - Switzerland (%)
Place of birth for the foreign-born population - Other Western Europe (%)
Place of birth for the foreign-born population - Greece (%)
Place of birth for the foreign-born population - Italy (%)
Place of birth for the foreign-born population - Portugal (%)
Place of birth for the foreign-born population - Spain (%)
Place of birth for the foreign-born population - Other Southern Europe (%)
Place of birth for the foreign-born population - Albania (%)
Place of birth for the foreign-born population - Belarus (%)
Place of birth for the foreign-born population - Bosnia and Herzegovina (%)
Place of birth for the foreign-born population - Bulgaria (%)
Place of birth for the foreign-born population - Croatia (%)
Place of birth for the foreign-born population - Czechoslovakia (%)
Place of birth for the foreign-born population - Hungary (%)
Place of birth for the foreign-born population - Latvia (%)
Place of birth for the foreign-born population - Lithuania (%)
Place of birth for the foreign-born population - North Macedonia (Macedonia) (%)
Place of birth for the foreign-born population - Moldova (%)
Place of birth for the foreign-born population - Poland (%)
Place of birth for the foreign-born population - Romania (%)
Place of birth for the foreign-born population - Russia (%)
Place of birth for the foreign-born population - Serbia (%)
Place of birth for the foreign-born population - Ukraine (%)
Place of birth for the foreign-born population - Other Eastern Europe (%)
Place of birth for the foreign-born population - China (%)
Place of birth for the foreign-born population - Hong Kong (%)
Place of birth for the foreign-born population - Taiwan (%)
Place of birth for the foreign-born population - Japan (%)
Place of birth for the foreign-born population - Korea (%)
Place of birth for the foreign-born population - Other Eastern Asia (%)
Place of birth for the foreign-born population - Afghanistan (%)
Place of birth for the foreign-born population - Bangladesh (%)
Place of birth for the foreign-born population - India (%)
Place of birth for the foreign-born population - Iran (%)
Place of birth for the foreign-born population - Kazakhstan (%)
Place of birth for the foreign-born population - Nepal (%)
Place of birth for the foreign-born population - Pakistan (%)
Place of birth for the foreign-born population - Sri Lanka (%)
Place of birth for the foreign-born population - Uzbekistan (%)
Place of birth for the foreign-born population - Other South Central Asia (%)
Place of birth for the foreign-born population - Burma (%)
Place of birth for the foreign-born population - Cambodia (%)
Place of birth for the foreign-born population - Indonesia (%)
Place of birth for the foreign-born population - Laos (%)
Place of birth for the foreign-born population - Malaysia (%)
Place of birth for the foreign-born population - Philippines (%)
Place of birth for the foreign-born population - Singapore (%)
Place of birth for the foreign-born population - Thailand (%)
Place of birth for the foreign-born population - Vietnam (%)
Place of birth for the foreign-born population - Other South Eastern Asia (%)
Place of birth for the foreign-born population - Armenia (%)
Place of birth for the foreign-born population - Iraq (%)
Place of birth for the foreign-born population - Israel (%)
Place of birth for the foreign-born population - Jordan (%)
Place of birth for the foreign-born population - Kuwait (%)
Place of birth for the foreign-born population - Lebanon (%)
Place of birth for the foreign-born population - Saudi Arabia (%)
Place of birth for the foreign-born population - Syria (%)
Place of birth for the foreign-born population - Turkey (%)
Place of birth for the foreign-born population - Yemen (%)
Place of birth for the foreign-born population - Other Western Asia (%)
Place of birth for the foreign-born population - Eritrea (%)
Place of birth for the foreign-born population - Ethiopia (%)
Place of birth for the foreign-born population - Kenya (%)
Place of birth for the foreign-born population - Somalia (%)
Place of birth for the foreign-born population - Uganda (%)
Place of birth for the foreign-born population - Zimbabwe (%)
Place of birth for the foreign-born population - Other Eastern Africa (%)
Place of birth for the foreign-born population - Cameroon (%)
Place of birth for the foreign-born population - Congo (%)
Place of birth for the foreign-born population - Democratic Republic of Congo (Zaire) (%)
Place of birth for the foreign-born population - Other Middle Africa (%)
Place of birth for the foreign-born population - Egypt (%)
Place of birth for the foreign-born population - Morocco (%)
Place of birth for the foreign-born population - Sudan (%)
Place of birth for the foreign-born population - Other Northern Africa (%)
Place of birth for the foreign-born population - South Africa (%)
Place of birth for the foreign-born population - Other Southern Africa (%)
Place of birth for the foreign-born population - Cabo Verde (%)
Place of birth for the foreign-born population - Ghana (%)
Place of birth for the foreign-born population - Liberia (%)
Place of birth for the foreign-born population - Nigeria (%)
Place of birth for the foreign-born population - Senegal (%)
Place of birth for the foreign-born population - Sierra Leone (%)
Place of birth for the foreign-born population - Other Western Africa (%)
Place of birth for the foreign-born population - Australia (%)
Place of birth for the foreign-born population - New Zealand (%)
Place of birth for the foreign-born population - Fiji (%)
Place of birth for the foreign-born population - Micronesia (%)
Place of birth for the foreign-born population - Bahamas (%)
Place of birth for the foreign-born population - Barbados (%)
Place of birth for the foreign-born population - Cuba (%)
Place of birth for the foreign-born population - Dominica (%)
Place of birth for the foreign-born population - Dominican Republic (%)
Place of birth for the foreign-born population - Grenada (%)
Place of birth for the foreign-born population - Haiti (%)
Place of birth for the foreign-born population - Jamaica (%)
Place of birth for the foreign-born population - St. Vincent and the Grenadines (%)
Place of birth for the foreign-born population - Trinidad and Tobago (%)
Place of birth for the foreign-born population - West Indies (%)
Place of birth for the foreign-born population - Other Caribbean (%)
Place of birth for the foreign-born population - Belize (%)
Place of birth for the foreign-born population - Costa Rica (%)
Place of birth for the foreign-born population - El Salvador (%)
Place of birth for the foreign-born population - Guatemala (%)
Place of birth for the foreign-born population - Honduras (%)
Place of birth for the foreign-born population - Mexico (%)
Place of birth for the foreign-born population - Nicaragua (%)
Place of birth for the foreign-born population - Panama (%)
Place of birth for the foreign-born population - Other Central America (%)
Place of birth for the foreign-born population - Argentina (%)
Place of birth for the foreign-born population - Bolivia (%)
Place of birth for the foreign-born population - Brazil (%)
Place of birth for the foreign-born population - Chile (%)
Place of birth for the foreign-born population - Colombia (%)
Place of birth for the foreign-born population - Ecuador (%)
Place of birth for the foreign-born population - Guyana (%)
Place of birth for the foreign-born population - Peru (%)
Place of birth for the foreign-born population - Uruguay (%)
Place of birth for the foreign-born population - Venezuela (%)
Place of birth for the foreign-born population - Other South America (%)
Place of birth for the foreign-born population - Canada (%)
Place of birth for the foreign-born population - Other Northern America (%)
Place of birth for the foreign-born population - Other (%)
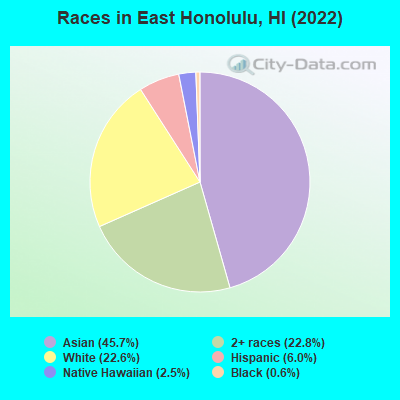
According to 2022 data, the most numerous races in East Honolulu, HI are Asian alone (22,285 residents), Two or more races (11,122 residents), and White alone (11,044 residents). 81.8% of East Honolulu residents speak English at home.
Race distribution in East Honolulu 22,285 45.7% Asian alone 11,122 22.8% Two or more races 11,044 22.6% White alone 2,932 6.0% Hispanic 1,200 2.5% Native Hawaiian and Other 277 0.6% Black alone 37 0.08% Other race alone 23 0.05% American Indian alone
2000 2022
494,149 40.8% Asian alone 277,091 22.9% White alone 218,700 18.1% Two or more races 108,441 9.0% Native Hawaiian and Other 87,699 7.2% Hispanic 20,829 1.7% Black alone 2,089 0.2% Other race alone 2,539 0.2% American Indian alone
498,125 34.6% Asian alone 318,574 22.1% Two or more races 297,937 20.7% White alone 160,103 11.1% Hispanic 134,567 9.3% Native Hawaiian and Other 23,682 1.6% Black alone 5,378 0.4% Other race alone 1,830 0.1% American Indian alone
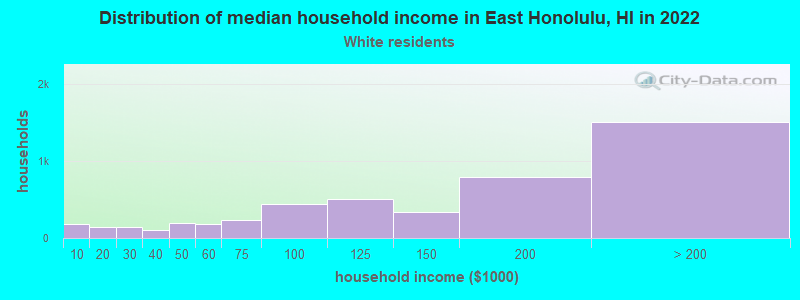
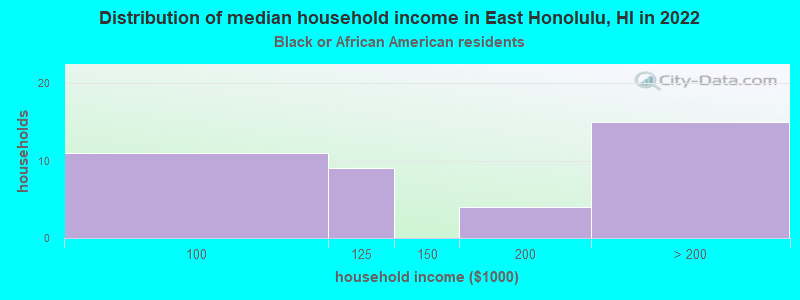
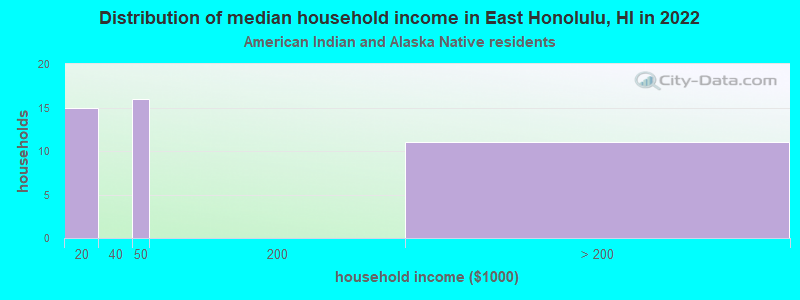
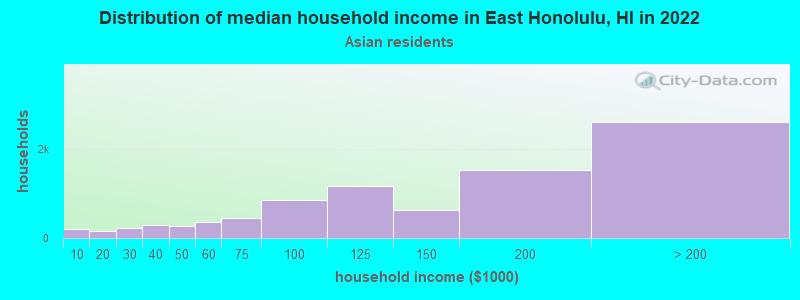
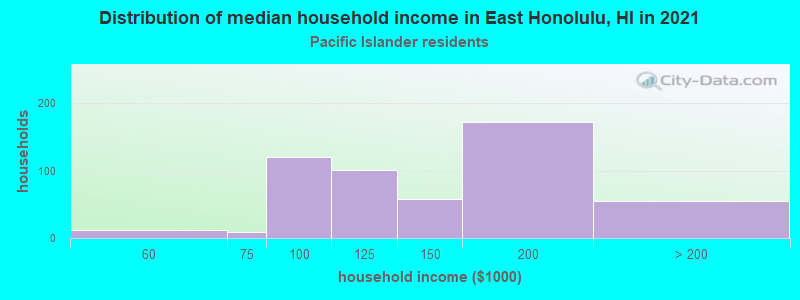
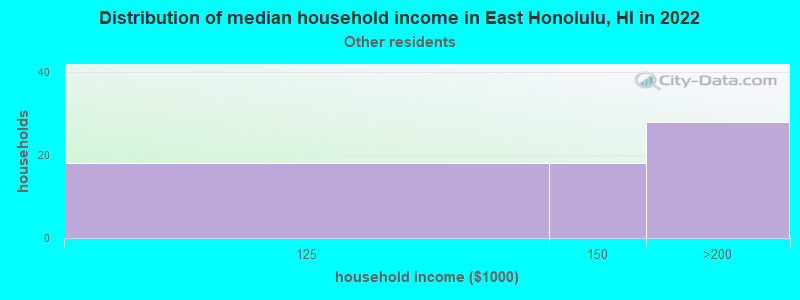
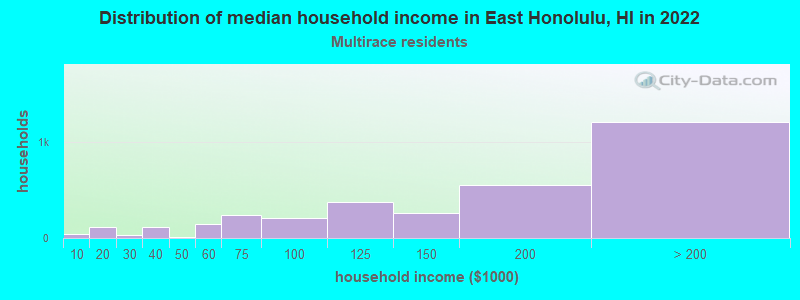
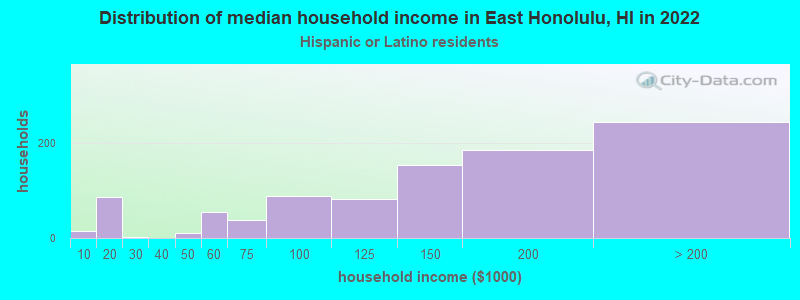
Income and house value in East Honolulu Median household income in 2022 $151,602 White non-Hispanic householders$171,792 Black householders$139,649 Asian householders$133,387 Native Hawaiian and other Pacific Islander householders$132,296 Some other race householders$166,182 Two or more races householders$140,897 Hispanic or Latino race householders
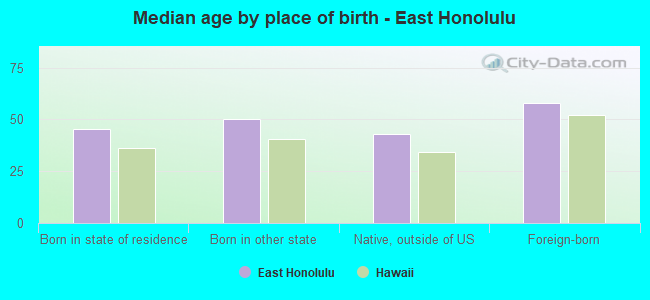
Median age by race in East Honolulu
53.8 Median age for White residents54.1 53.1 25.0 Median age for Black or African American residents25.3 25.4 57.9 Median age for American Indian / Alaska Native residents-715,953,306.7 52.7 55.2 Median age for Asian residents54.0 55.8 61.4 Median age for Native Hawaiian / Pacific Islander residents59.1 63.5 38.9 Median age for Other race residents56.7 38.6 28.3 Median age for Two or more races residents30.2 26.8 55.1 Median age for White alone residents55.5 54.9 33.3 Median age for Hispanic or Latino residents30.2 37.0
Owner/renter occupied households by race in East Honolulu
House owners and renters - White residents 3,612 74.2% Owner occupied1,257 25.8% Renter occupiedHouse owners and renters - Black or African American residents 1 1.7% Owner occupied59 98.3% Renter occupiedHouse owners and renters - American Indian / Alaska Native residents 36 100.0% Owner occupiedHouse owners and renters - Asian residents 8,118 90.9% Owner occupied816 9.1% Renter occupiedHouse owners and renters - Native Hawaiian / Pacific Islander residents 374 77.5% Owner occupied109 22.5% Renter occupiedHouse owners and renters - Other race residents 53 100.0% Renter occupiedHouse owners and renters - Two or more races residents 2,942 84.8% Owner occupied529 15.2% Renter occupiedHouse owners and renters - White alone residents 3,518 74.8% Owner occupied1,186 25.2% Renter occupiedHouse owners and renters - Hispanic or Latino residents 627 64.7% Owner occupied343 35.3% Renter occupied
Language usage in East Honolulu
English speakers - Total 81.8% of residents of East Honolulu speak English at home.
1.7% of residents speak Spanish at home 673 83.2% Speak English very well136 16.8% Speak English less than very well17.0% of residents speak other language at home 5,251 66.1% Speak English very well2,692 33.9% Speak English less than very well
English speakers - Born in the United States 92.3% of residents of East Honolulu speak English at home.
3.2% of residents speak Spanish at home 301 83.1% Speak English very well61 16.9% Speak English less than very well4.7% of residents speak other language at home 502 93.8% Speak English very well33 6.2% Speak English less than very well
English speakers - Native, born elsewhere 67.5% of residents of East Honolulu speak English at home.
10.9% of residents speak Spanish at home 118 95.9% Speak English very well5 4.1% Speak English less than very well22.2% of residents speak other language at home 226 90.0% Speak English very well25 10.0% Speak English less than very well
English speakers - Foreign-born 33.2% of residents of East Honolulu speak English at home.
3.5% of residents speak Spanish at home 199 76.8% Speak English very well60 23.2% Speak English less than very well63.2% of residents speak other language at home 2,383 50.9% Speak English very well2,300 49.1% Speak English less than very well
White (Caucasian) - Speak only English Native:
95.4% (9,328)Foreign-born:
81.5% (1,134)
White (Caucasian) - Speak another language Native:
4.7% (461)Foreign-born:
22.5% (313)
Black or African American - Speak another language Native:
38.6% (92)Foreign-born:
100.0% (30)
Asian - Speak only English Native:
89.1% (14,517)Foreign-born:
23.3% (1,294)
Asian - Speak another language Native:
11.1% (1,801)Foreign-born:
76.6% (4,248)
Native Hawaiian / Pacific Islander - Speak only English Native:
79.0% (946)Foreign-born:
57.9% (16)
Native Hawaiian / Pacific Islander - Speak another language Native:
20.7% (247)Foreign-born:
39.5% (11)
Other race - Speak only English Native:
73.8% (120)Foreign-born:
22.2% (27)
Other race - Speak another language Native:
27.0% (44)Foreign-born:
79.0% (95)
Two or more races - Speak only English Native:
90.6% (10,633)Foreign-born:
26.8% (79)
Two or more races - Speak another language Native:
9.4% (1,099)Foreign-born:
73.1% (216)
White alone - Speak only English Native:
95.7% (9,082)Foreign-born:
77.7% (1,118)
White alone - Speak another language Native:
4.3% (408)Foreign-born:
22.6% (325)
Hispanic or Latino - Speak only English Native:
79.6% (1,874)Foreign-born:
30.2% (115)
Hispanic or Latino - Speak another language Native:
20.2% (476)Foreign-born:
71.8% (273)
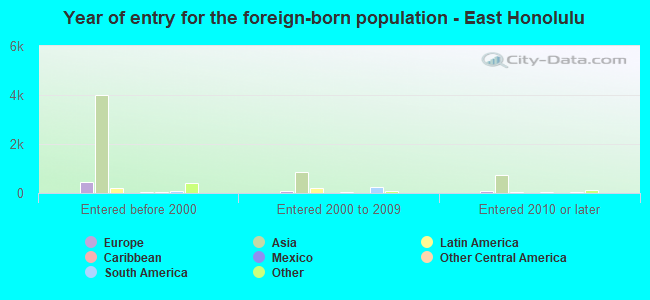
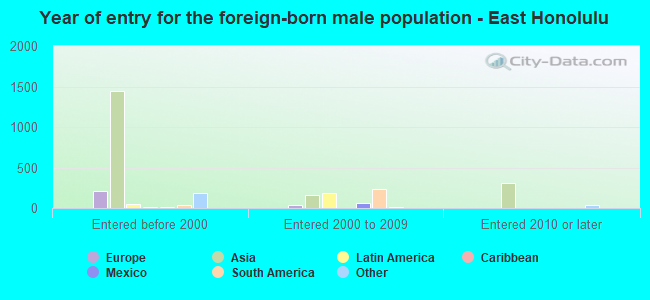
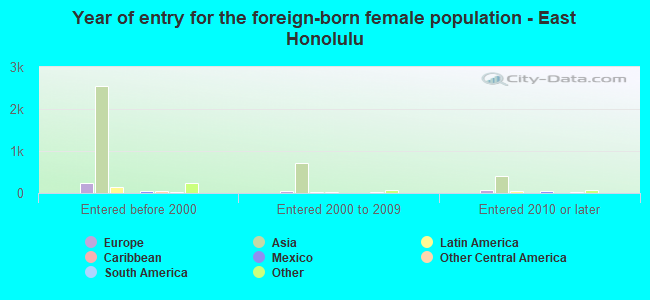
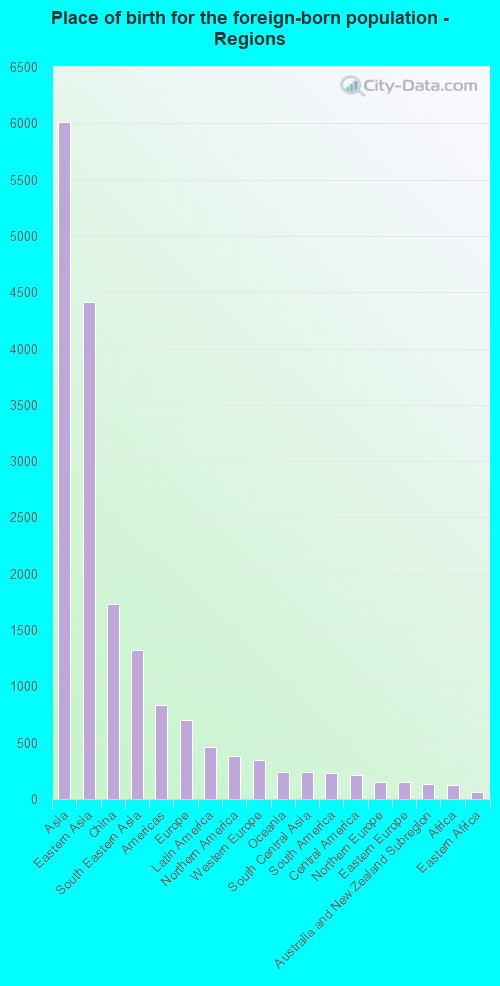
Foreign-born residents in East Honolulu
Marital status for residents in East Honolulu Marital status - White (Caucasian) population 15 years and over
Males 18.2% Never married69.7% Now married0.6% Separated3.3% Widowed8.2% DivorcedFemales 23.4% Never married60.0% Now married0.8% Separated6.9% Widowed8.9% DivorcedWomen who gave birth in the past 12 months Now married:
93.3% (78)Unmarried:
6.7% (6)
Women who did not give birth in the past 12 months Now married:
45.7% (823)Unmarried:
54.3% (976)
Marital status - Black or African American population 15 years and over
Males 56.9% Never married36.9% Now married0.0% Separated0.0% Widowed6.2% DivorcedFemales 47.8% Never married40.7% Now married0.0% Separated0.0% Widowed11.5% DivorcedWomen who did not give birth in the past 12 months Now married:
42.6% (38)Unmarried:
57.4% (52)
Marital status - American Indian / Alaska Native population 15 years and over
Males 0.0% Never married100.0% Now married0.0% Separated0.0% Widowed0.0% DivorcedFemales 27.7% Never married72.3% Now married0.0% Separated0.0% Widowed0.0% DivorcedWomen who did not give birth in the past 12 months Now married:
0.0% (0)Unmarried:
100.0% (15)
Marital status - Asian population 15 years and over
Males 25.3% Never married64.6% Now married0.5% Separated3.8% Widowed5.8% DivorcedFemales 14.6% Never married65.1% Now married0.8% Separated11.8% Widowed7.7% DivorcedWomen who gave birth in the past 12 months Now married:
100.0% (244)Unmarried:
0.0% (0)
Women who did not give birth in the past 12 months Now married:
62.2% (2,414)Unmarried:
37.8% (1,467)
Marital status - Native Hawaiian / Pacific Islander population 15 years and over
Males 32.0% Never married59.2% Now married1.9% Separated4.4% Widowed2.5% DivorcedFemales 13.5% Never married53.5% Now married0.0% Separated27.0% Widowed5.9% DivorcedWomen who gave birth in the past 12 months Now married:
100.0% (9)Unmarried:
0.0% (0)
Women who did not give birth in the past 12 months Now married:
42.2% (38)Unmarried:
57.8% (52)
Marital status - Other race population 15 years and over
Males 32.1% Never married67.9% Now married0.0% Separated0.0% Widowed0.0% DivorcedFemales 10.9% Never married51.8% Now married0.0% Separated0.5% Widowed36.8% DivorcedWomen who did not give birth in the past 12 months Now married:
43.2% (87)Unmarried:
56.8% (115)
Marital status - Two or more races population 15 years and over
Males 41.5% Never married51.1% Now married0.0% Separated0.7% Widowed6.8% DivorcedFemales 43.1% Never married42.1% Now married0.7% Separated8.0% Widowed6.2% DivorcedWomen who gave birth in the past 12 months Now married:
60.5% (95)Unmarried:
39.5% (62)
Women who did not give birth in the past 12 months Now married:
31.3% (845)Unmarried:
68.7% (1,854)
Marital status - White alone, not Hispanic / Latino population 15 years and over
Males 17.9% Never married71.0% Now married0.6% Separated3.4% Widowed7.1% DivorcedFemales 22.0% Never married61.2% Now married0.8% Separated7.2% Widowed8.8% DivorcedWomen who gave birth in the past 12 months Now married:
93.3% (80)Unmarried:
6.7% (6)
Women who did not give birth in the past 12 months Now married:
47.6% (805)Unmarried:
52.4% (887)
Marital status - Hispanic or Latino population 15 years and over
Males 40.6% Never married50.8% Now married0.0% Separated0.0% Widowed8.7% DivorcedFemales 36.8% Never married47.1% Now married0.0% Separated2.1% Widowed14.0% DivorcedWomen who gave birth in the past 12 months Now married:
100.0% (33)Unmarried:
0.0% (0)
Women who did not give birth in the past 12 months Now married:
38.7% (305)Unmarried:
61.3% (482)
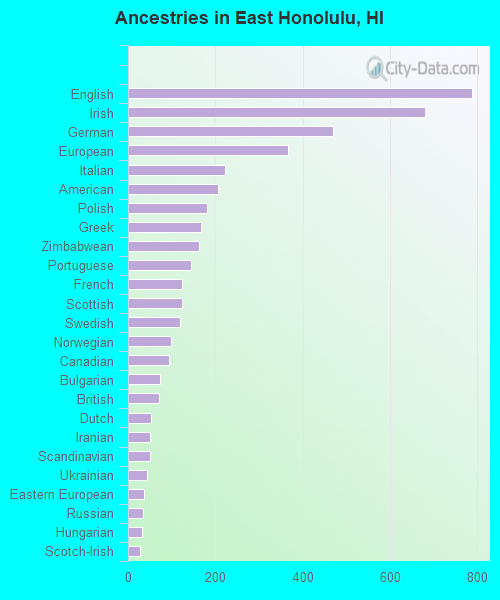
Ancestries in East Honolulu
787 3.1% English679 2.7% Irish470 1.9% German367 1.5% European221 0.9% Italian207 0.8% American180 0.7% Polish168 0.7% Greek162 0.6% Zimbabwean145 0.6% Portuguese123 0.5% French123 0.5% Scottish120 0.5% Swedish98 0.4% Norwegian93 0.4% Canadian73 0.3% Bulgarian71 0.3% British52 0.2% Dutch51 0.2% Iranian51 0.2% Scandinavian44 0.2% Ukrainian37 0.1% Eastern European34 0.1% Russian33 0.1% Hungarian28 0.1% Scotch-Irish27 0.1% French Canadian27 0.1% Swiss25 0.1% Australian24 0.10% Northern European21 0.08% Austrian17 0.07% Croatian13 0.05% Welsh12 0.05% Lebanese10 0.04% Romanian9 0.04% Lithuanian9 0.04% Luxembourger6 0.02% Belgian2 0.01% New Zealander
Geographical mobility in East Honolulu Same house 1 year ago 9,375 82.8% White (Caucasian)263 93.2% Black or African American51 90.5% American Indian / Alaska Native21,041 93.5% Asian1,145 92.9% Native Hawaiian / Pacific Islander262 94.3% Other race11,869 92.5% Two or more races9,160 83.2% White alone, not Hispanic / Latino2,454 85.2% Hispanic or LatinoMoved within same county 1,140 10.1% White / Caucasian11 19.3% American Indian / Alaska Native1,029 4.6% Asian62 5.0% Native Hawaiian / Pacific Islander673 5.3% Two or more races1,068 9.7% White alone, not Hispanic / Latino293 10.2% Hispanic or LatinoMoved within same state 136 1.2% White / Caucasian12 0.1% Asian8 0.1% Two or more races64 0.6% White alone, not Hispanic / Latino38 1.3% Hispanic or LatinoMoved from different state 622 5.5% White / Caucasian332 1.5% Asian28 2.3% Native Hawaiian / Pacific Islander29 10.4% Other race184 1.4% Two or more races637 5.8% White alone, not Hispanic / Latino59 2.1% Hispanic or LatinoMoved from abroad 11 0.1% White62 0.3% Asian118 0.9% Two or more races12 0.1% White alone, not Hispanic / Latino
Children Nativity (place of birth) in East Honolulu
Children under 6 years - Living with two parents Both parents native 1,367 100.0% NativeBoth parents foreign-born 255 100.0% NativeOne native, one foreign-born parent 321 98.0% Native7 2.0% Foreign-bornChildren under 6 years - Living with one parent Native parent 334 100.0% NativeForeign-born parent 62 100.0% NativeChildren 6 to 17 years - Living with two parents Both parents native 3,325 98.5% Native51 1.5% Foreign-bornBoth parents foreign-born 511 90.5% Native54 9.5% Foreign-bornOne native, one foreign-born parent 977 98.1% Native19 1.9% Foreign-bornChildren 6 to 17 years - Living with one parent Native parent 1,107 100.0% NativeForeign-born parent 227 49.4% Native233 50.6% Foreign-born
Grandparents responsible for own grandchildren in East Honolulu
Grandparents (30 to 59 years) White / Caucasian 47 100.0% Not responsible for grandchildrenAsian 195 100.0% Not responsible for grandchildrenTwo or more races 6 29.0% Responsible for grandchildren14 71.0% Not responsible for grandchildrenWhite alone, not Hispanic / Latino 53 100.0% Not responsible for grandchildrenGrandparents (60 years and over) White / Caucasian 2 1.8% Responsible for grandchildren107 98.2% Not responsible for grandchildrenAsian 46 6.9% Responsible for grandchildren609 93.1% Not responsible for grandchildrenTwo or more races 109 34.6% Responsible for grandchildren206 65.4% Not responsible for grandchildrenWhite alone, not Hispanic / Latino 2 2.2% Responsible for grandchildren104 97.8% Not responsible for grandchildren