Races in East Islip, New York (NY) Detailed Stats
Data:
Races - White alone (%)
Races - White alone (% change since 2000)
Races - Black alone (%)
Races - Black alone (% change since 2000)
Races - American Indian alone (%)
Races - American Indian alone (% change since 2000)
Races - Asian alone (%)
Races - Asian alone (% change since 2000)
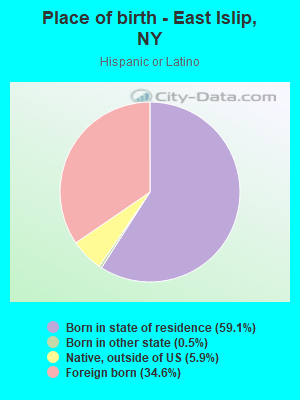
Races - Hispanic (%)
Races - Hispanic (% change since 2000)
Races - Native Hawaiian and Other Pacific Islander alone (%)
Races - Native Hawaiian and Other Pacific Islander alone (% change since 2000)
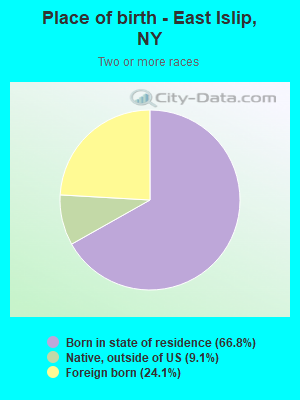
Races - Two or more races(%)
Races - Two or more races(% change since 2000)
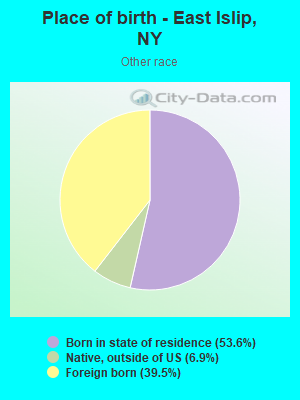
Races - Other race alone (%)
Races - Other race alone (% change since 2000)
Racial diversity
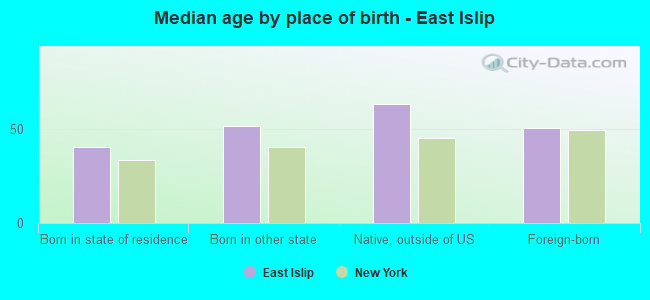
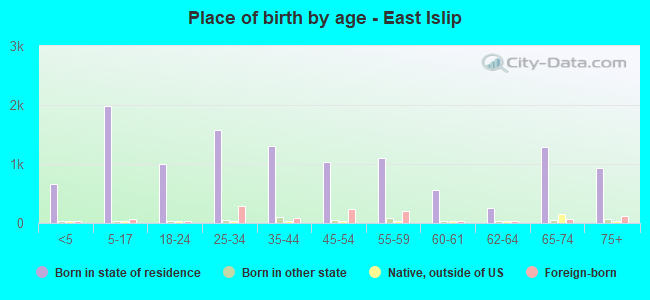
Place of birth - Born in state of residence (%)
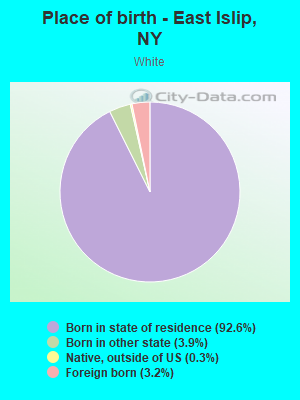
Place of birth - Born in state of residence (%) - White
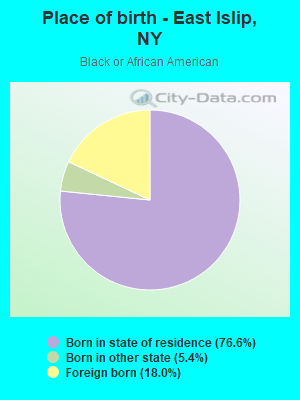
Place of birth - Born in state of residence (%) - Black or African American
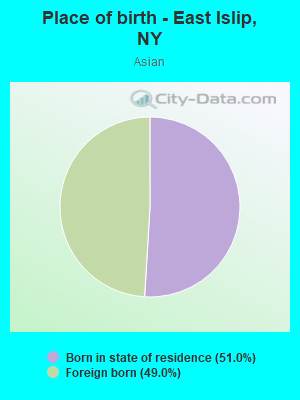
Place of birth - Born in state of residence (%) - Asian
Place of birth - Born in state of residence (%) - Hispanic or Latino
Place of birth - Born in state of residence (%) - American Indian and Alaska Native
Place of birth - Born in state of residence (%) - Multirace
Place of birth - Born in state of residence (%) - Other Race
Place of birth - Born in other state (%)
Place of birth - Born in other state (%) - White
Place of birth - Born in other state (%) - Black or African American
Place of birth - Born in other state (%) - Asian
Place of birth - Born in other state (%) - Hispanic or Latino
Place of birth - Born in other state (%) - American Indian and Alaska Native
Place of birth - Born in other state (%) - Multirace
Place of birth - Born in other state (%) - Other Race
Place of birth - Native, outside of US (%)
Place of birth - Native, outside of US (%) - White
Place of birth - Native, outside of US (%) - Black or African American
Place of birth - Native, outside of US (%) - Asian
Place of birth - Native, outside of US (%) - Hispanic or Latino
Place of birth - Native, outside of US (%) - American Indian and Alaska Native
Place of birth - Native, outside of US (%) - Multirace
Place of birth - Native, outside of US (%) - Other Race
Place of birth - Foreign born (%)
Place of birth - Foreign born (%) - White
Place of birth - Foreign born (%) - Black or African American
Place of birth - Foreign born (%) - Asian
Place of birth - Foreign born (%) - Hispanic or Latino
Place of birth - Foreign born (%) - American Indian and Alaska Native
Place of birth - Foreign born (%) - Multirace
Place of birth - Foreign born (%) - Other Race
Residents speaking English at home (%)
Residents speaking English at home - Born in the United States (%)
Residents speaking English at home - Native, born elsewhere (%)
Residents speaking English at home - Foreign born (%)
Residents speaking Spanish at home (%)
Residents speaking Spanish at home - Born in the United States (%)
Residents speaking Spanish at home - Native, born elsewhere (%)
Residents speaking Spanish at home - Foreign born (%)
Residents speaking other language at home (%)
Residents speaking other language at home - Born in the United States (%)
Residents speaking other language at home - Native, born elsewhere (%)
Residents speaking other language at home - Foreign born (%)
Marital status - Never married (%)
Marital status - Now married (%)
Marital status - Separated (%)
Marital status - Widowed (%)
Marital status - Divorced (%)
Ancestries Reported - Arab (%)
Ancestries Reported - Czech (%)
Ancestries Reported - Danish (%)
Ancestries Reported - Dutch (%)
Ancestries Reported - English (%)
Ancestries Reported - French (%)
Ancestries Reported - French Canadian (%)
Ancestries Reported - German (%)
Ancestries Reported - Greek (%)
Ancestries Reported - Hungarian (%)
Ancestries Reported - Irish (%)
Ancestries Reported - Italian (%)
Ancestries Reported - Lithuanian (%)
Ancestries Reported - Norwegian (%)
Ancestries Reported - Polish (%)
Ancestries Reported - Portuguese (%)
Ancestries Reported - Russian (%)
Ancestries Reported - Scotch-Irish (%)
Ancestries Reported - Scottish (%)
Ancestries Reported - Slovak (%)
Ancestries Reported - Subsaharan African (%)
Ancestries Reported - Swedish (%)
Ancestries Reported - Swiss (%)
Ancestries Reported - Ukrainian (%)
Ancestries Reported - United States (%)
Ancestries Reported - Welsh (%)
Ancestries Reported - West Indian (%)
Ancestries Reported - Other (%)
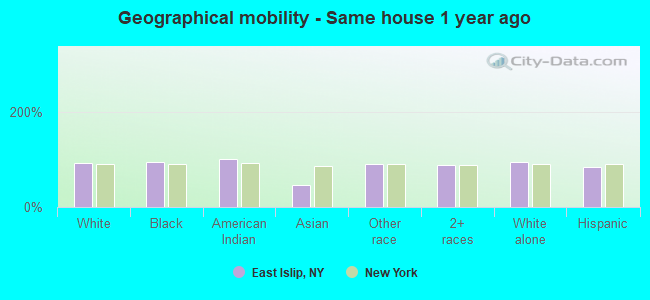
Geographical mobility - Same house 1 year ago (%)
Geographical mobility - Same house 1 year ago (%) - White
Geographical mobility - Same house 1 year ago (%) - Black or African American
Geographical mobility - Same house 1 year ago (%) - Asian
Geographical mobility - Same house 1 year ago (%) - Hispanic or Latino
Geographical mobility - Same house 1 year ago (%) - American Indian and Alaska Native
Geographical mobility - Same house 1 year ago (%) - Multirace
Geographical mobility - Same house 1 year ago (%) - Other Race
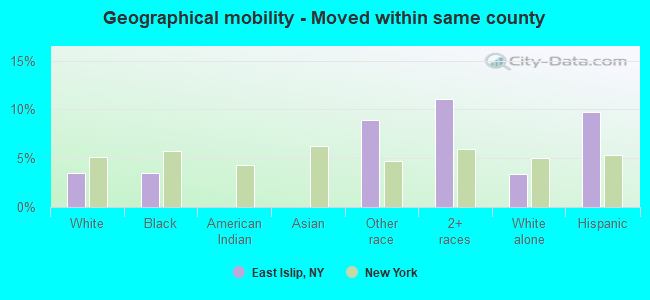
Geographical mobility - Moved within same county (%)
Geographical mobility - Moved within same county (%) - White
Geographical mobility - Moved within same county (%) - Black or African American
Geographical mobility - Moved within same county (%) - Asian
Geographical mobility - Moved within same county (%) - Hispanic or Latino
Geographical mobility - Moved within same county (%) - American Indian and Alaska Native
Geographical mobility - Moved within same county (%) - Multirace
Geographical mobility - Moved within same county (%) - Other Race
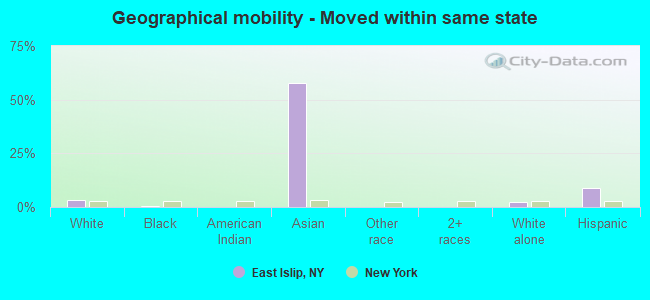
Geographical mobility - Moved from different county within same state (%)
Geographical mobility - Moved from different county within same state (%) - White
Geographical mobility - Moved from different county within same state (%) - Black or African American
Geographical mobility - Moved from different county within same state (%) - Asian
Geographical mobility - Moved from different county within same state (%) - Hispanic or Latino
Geographical mobility - Moved from different county within same state (%) - American Indian and Alaska Native
Geographical mobility - Moved from different county within same state (%) - Multirace
Geographical mobility - Moved from different county within same state (%) - Other Race
Geographical mobility - Moved from different state (%)
Geographical mobility - Moved from different state (%) - White
Geographical mobility - Moved from different state (%) - Black or African American
Geographical mobility - Moved from different state (%) - Asian
Geographical mobility - Moved from different state (%) - Hispanic or Latino
Geographical mobility - Moved from different state (%) - American Indian and Alaska Native
Geographical mobility - Moved from different state (%) - Multirace
Geographical mobility - Moved from different state (%) - Other Race
Geographical mobility - Moved from abroad (%)
Geographical mobility - Moved from abroad (%) - White
Geographical mobility - Moved from abroad (%) - Black or African American
Geographical mobility - Moved from abroad (%) - Asian
Geographical mobility - Moved from abroad (%) - Hispanic or Latino
Geographical mobility - Moved from abroad (%) - American Indian and Alaska Native
Geographical mobility - Moved from abroad (%) - Multirace
Geographical mobility - Moved from abroad (%) - Other Race
Place of birth for the foreign-born population - Ireland (%)
Place of birth for the foreign-born population - Denmark (%)
Place of birth for the foreign-born population - Norway (%)
Place of birth for the foreign-born population - Sweden (%)
Place of birth for the foreign-born population - United Kingdom (%)
Place of birth for the foreign-born population - England (%)
Place of birth for the foreign-born population - Scotland (%)
Place of birth for the foreign-born population - Other Northern Europe (%)
Place of birth for the foreign-born population - Austria (%)
Place of birth for the foreign-born population - Belgium (%)
Place of birth for the foreign-born population - France (%)
Place of birth for the foreign-born population - Germany (%)
Place of birth for the foreign-born population - Netherlands (%)
Place of birth for the foreign-born population - Switzerland (%)
Place of birth for the foreign-born population - Other Western Europe (%)
Place of birth for the foreign-born population - Greece (%)
Place of birth for the foreign-born population - Italy (%)
Place of birth for the foreign-born population - Portugal (%)
Place of birth for the foreign-born population - Spain (%)
Place of birth for the foreign-born population - Other Southern Europe (%)
Place of birth for the foreign-born population - Albania (%)
Place of birth for the foreign-born population - Belarus (%)
Place of birth for the foreign-born population - Bosnia and Herzegovina (%)
Place of birth for the foreign-born population - Bulgaria (%)
Place of birth for the foreign-born population - Croatia (%)
Place of birth for the foreign-born population - Czechoslovakia (%)
Place of birth for the foreign-born population - Hungary (%)
Place of birth for the foreign-born population - Latvia (%)
Place of birth for the foreign-born population - Lithuania (%)
Place of birth for the foreign-born population - North Macedonia (Macedonia) (%)
Place of birth for the foreign-born population - Moldova (%)
Place of birth for the foreign-born population - Poland (%)
Place of birth for the foreign-born population - Romania (%)
Place of birth for the foreign-born population - Russia (%)
Place of birth for the foreign-born population - Serbia (%)
Place of birth for the foreign-born population - Ukraine (%)
Place of birth for the foreign-born population - Other Eastern Europe (%)
Place of birth for the foreign-born population - China (%)
Place of birth for the foreign-born population - Hong Kong (%)
Place of birth for the foreign-born population - Taiwan (%)
Place of birth for the foreign-born population - Japan (%)
Place of birth for the foreign-born population - Korea (%)
Place of birth for the foreign-born population - Other Eastern Asia (%)
Place of birth for the foreign-born population - Afghanistan (%)
Place of birth for the foreign-born population - Bangladesh (%)
Place of birth for the foreign-born population - India (%)
Place of birth for the foreign-born population - Iran (%)
Place of birth for the foreign-born population - Kazakhstan (%)
Place of birth for the foreign-born population - Nepal (%)
Place of birth for the foreign-born population - Pakistan (%)
Place of birth for the foreign-born population - Sri Lanka (%)
Place of birth for the foreign-born population - Uzbekistan (%)
Place of birth for the foreign-born population - Other South Central Asia (%)
Place of birth for the foreign-born population - Burma (%)
Place of birth for the foreign-born population - Cambodia (%)
Place of birth for the foreign-born population - Indonesia (%)
Place of birth for the foreign-born population - Laos (%)
Place of birth for the foreign-born population - Malaysia (%)
Place of birth for the foreign-born population - Philippines (%)
Place of birth for the foreign-born population - Singapore (%)
Place of birth for the foreign-born population - Thailand (%)
Place of birth for the foreign-born population - Vietnam (%)
Place of birth for the foreign-born population - Other South Eastern Asia (%)
Place of birth for the foreign-born population - Armenia (%)
Place of birth for the foreign-born population - Iraq (%)
Place of birth for the foreign-born population - Israel (%)
Place of birth for the foreign-born population - Jordan (%)
Place of birth for the foreign-born population - Kuwait (%)
Place of birth for the foreign-born population - Lebanon (%)
Place of birth for the foreign-born population - Saudi Arabia (%)
Place of birth for the foreign-born population - Syria (%)
Place of birth for the foreign-born population - Turkey (%)
Place of birth for the foreign-born population - Yemen (%)
Place of birth for the foreign-born population - Other Western Asia (%)
Place of birth for the foreign-born population - Eritrea (%)
Place of birth for the foreign-born population - Ethiopia (%)
Place of birth for the foreign-born population - Kenya (%)
Place of birth for the foreign-born population - Somalia (%)
Place of birth for the foreign-born population - Uganda (%)
Place of birth for the foreign-born population - Zimbabwe (%)
Place of birth for the foreign-born population - Other Eastern Africa (%)
Place of birth for the foreign-born population - Cameroon (%)
Place of birth for the foreign-born population - Congo (%)
Place of birth for the foreign-born population - Democratic Republic of Congo (Zaire) (%)
Place of birth for the foreign-born population - Other Middle Africa (%)
Place of birth for the foreign-born population - Egypt (%)
Place of birth for the foreign-born population - Morocco (%)
Place of birth for the foreign-born population - Sudan (%)
Place of birth for the foreign-born population - Other Northern Africa (%)
Place of birth for the foreign-born population - South Africa (%)
Place of birth for the foreign-born population - Other Southern Africa (%)
Place of birth for the foreign-born population - Cabo Verde (%)
Place of birth for the foreign-born population - Ghana (%)
Place of birth for the foreign-born population - Liberia (%)
Place of birth for the foreign-born population - Nigeria (%)
Place of birth for the foreign-born population - Senegal (%)
Place of birth for the foreign-born population - Sierra Leone (%)
Place of birth for the foreign-born population - Other Western Africa (%)
Place of birth for the foreign-born population - Australia (%)
Place of birth for the foreign-born population - New Zealand (%)
Place of birth for the foreign-born population - Fiji (%)
Place of birth for the foreign-born population - Micronesia (%)
Place of birth for the foreign-born population - Bahamas (%)
Place of birth for the foreign-born population - Barbados (%)
Place of birth for the foreign-born population - Cuba (%)
Place of birth for the foreign-born population - Dominica (%)
Place of birth for the foreign-born population - Dominican Republic (%)
Place of birth for the foreign-born population - Grenada (%)
Place of birth for the foreign-born population - Haiti (%)
Place of birth for the foreign-born population - Jamaica (%)
Place of birth for the foreign-born population - St. Vincent and the Grenadines (%)
Place of birth for the foreign-born population - Trinidad and Tobago (%)
Place of birth for the foreign-born population - West Indies (%)
Place of birth for the foreign-born population - Other Caribbean (%)
Place of birth for the foreign-born population - Belize (%)
Place of birth for the foreign-born population - Costa Rica (%)
Place of birth for the foreign-born population - El Salvador (%)
Place of birth for the foreign-born population - Guatemala (%)
Place of birth for the foreign-born population - Honduras (%)
Place of birth for the foreign-born population - Mexico (%)
Place of birth for the foreign-born population - Nicaragua (%)
Place of birth for the foreign-born population - Panama (%)
Place of birth for the foreign-born population - Other Central America (%)
Place of birth for the foreign-born population - Argentina (%)
Place of birth for the foreign-born population - Bolivia (%)
Place of birth for the foreign-born population - Brazil (%)
Place of birth for the foreign-born population - Chile (%)
Place of birth for the foreign-born population - Colombia (%)
Place of birth for the foreign-born population - Ecuador (%)
Place of birth for the foreign-born population - Guyana (%)
Place of birth for the foreign-born population - Peru (%)
Place of birth for the foreign-born population - Uruguay (%)
Place of birth for the foreign-born population - Venezuela (%)
Place of birth for the foreign-born population - Other South America (%)
Place of birth for the foreign-born population - Canada (%)
Place of birth for the foreign-born population - Other Northern America (%)
Place of birth for the foreign-born population - Other (%)
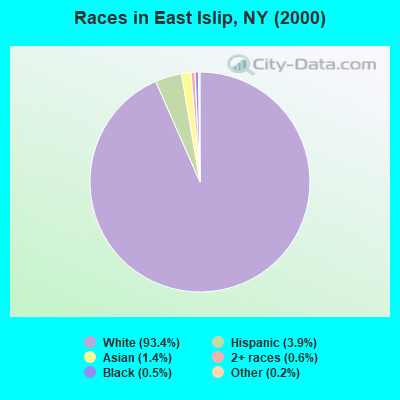
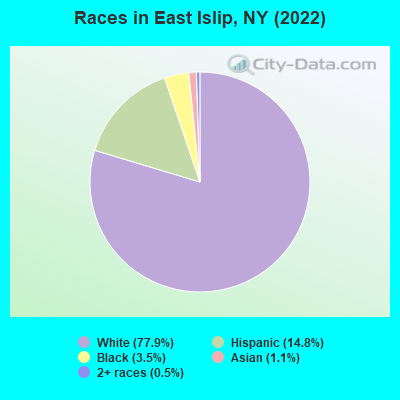
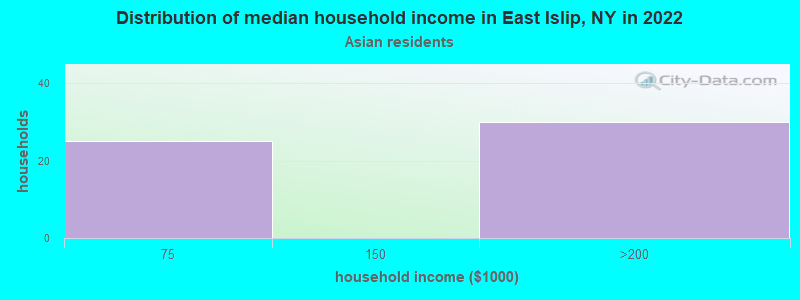
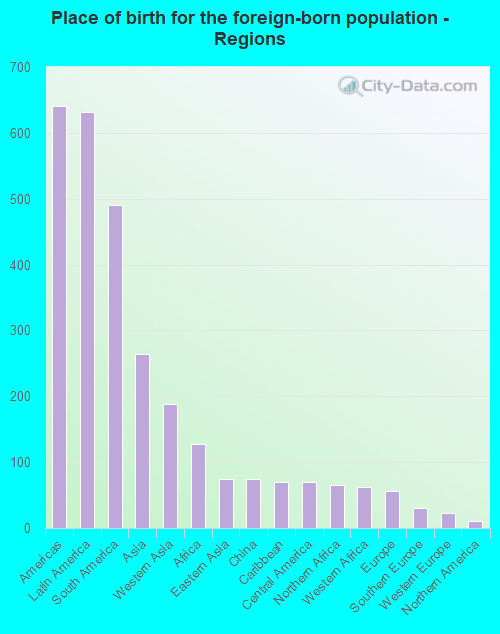
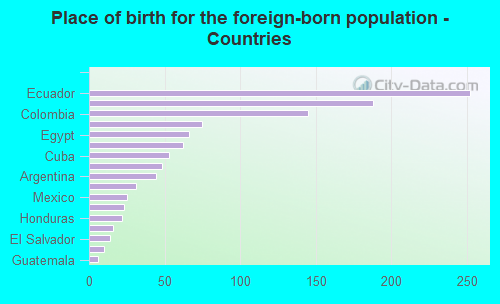
According to 2022 data, the most numerous races in East Islip, NY are White alone (10,576 residents), Hispanic (2,010 residents), and Black alone (481 residents). 82.5% of East Islip residents speak English at home. 8.0% of East Islip, NY residents are foreign-born (4.7% born in Latin America, 2.0% born in Asia, 1.0% born in Africa), which is 174.2% less than the foreign-born rate of 22.0% across the entire state of New York.
Race distribution in East Islip
2000 2022
11,760,981 62.0% White alone 2,867,583 15.1% Hispanic 2,812,623 14.8% Black alone 1,035,926 5.5% Asian alone 366,116 1.9% Two or more races 75,499 0.4% Other race alone 52,499 0.3% American Indian alone 5,230 0.03% Native Hawaiian and Other
10,408,933 52.9% White alone 3,867,299 19.7% Hispanic 2,633,840 13.4% Black alone 1,776,286 9.0% Asian alone 732,670 3.7% Two or more races 216,110 1.1% Other race alone 35,082 0.2% American Indian alone 6,931 0.04% Native Hawaiian and Other
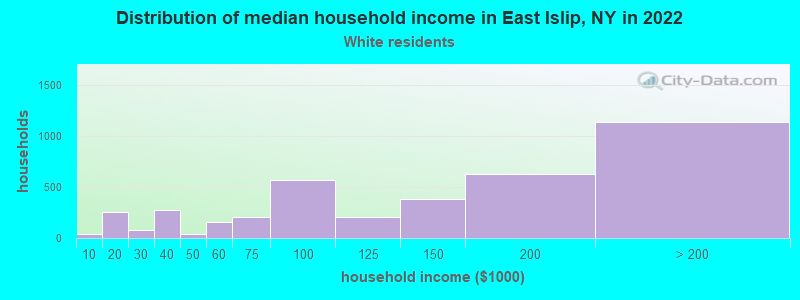
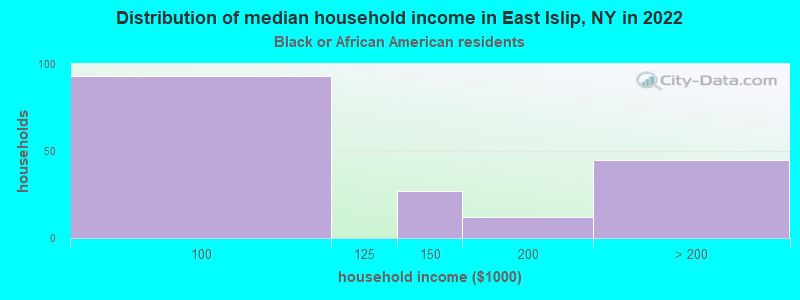
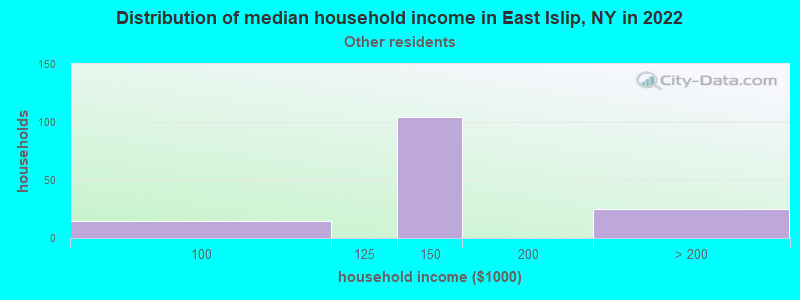
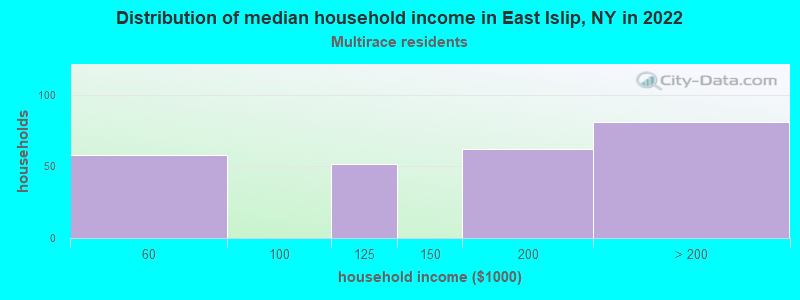
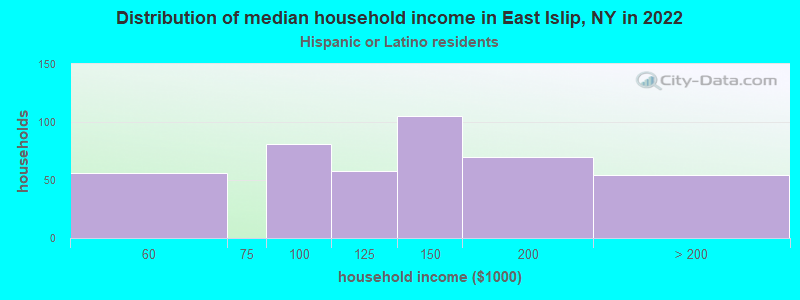
Income and house value in East Islip Median household income in 2022 $135,834 White non-Hispanic householders$126,954 Some other race householders$162,808 Two or more races householders$121,843 Hispanic or Latino race householdersMedian 2022 house value $602,118 White Non-Hispanic householdersover $1,000,000 Black or African American householders $744,391 Asian householders$788,216 Some other race householdersover $1,000,000 Two or more races householders$691,991 Hispanic or Latino householders
Median age by race in East Islip
45.2 Median age for White residents41.4 49.9 41.5 Median age for Black or African American residents29.5 51.4 47.2 Median age for American Indian / Alaska Native residents-807,017,543.1 32.5 43.3 Median age for Asian residents38.4 -693,840,579.0 -742,816,091.2 Median age for Native Hawaiian / Pacific Islander residents-831,187,409.8 -771,300,447.7 27.1 Median age for Other race residents19.3 28.1 40.6 Median age for Two or more races residents41.1 39.5 44.6 Median age for White alone residents41.7 50.7 30.4 Median age for Hispanic or Latino residents31.6 30.2
Owner/renter occupied households by race in East Islip
House owners and renters - White residents 3,569 89.1% Owner occupied438 10.9% Renter occupiedHouse owners and renters - Black or African American residents 86 50.3% Owner occupied85 49.7% Renter occupiedHouse owners and renters - American Indian / Alaska Native residents 16 100.0% Renter occupiedHouse owners and renters - Asian residents 54 100.0% Owner occupiedHouse owners and renters - Other race residents 169 100.0% Owner occupiedHouse owners and renters - Two or more races residents 255 100.0% Owner occupiedHouse owners and renters - White alone residents 3,541 88.1% Owner occupied477 11.9% Renter occupiedHouse owners and renters - Hispanic or Latino residents 400 98.1% Owner occupied8 1.9% Renter occupied
Language usage in East Islip
English speakers - Total 82.5% of residents of East Islip speak English at home.
11.1% of residents speak Spanish at home 1,188 82.8% Speak English very well247 17.2% Speak English less than very well5.1% of residents speak other language at home 502 76.3% Speak English very well156 23.7% Speak English less than very well
English speakers - Born in the United States 90.2% of residents of East Islip speak English at home.
5.2% of residents speak Spanish at home 24 100.0% Speak English very well5.9% of residents speak other language at home 27 100.0% Speak English less than very well
English speakers - Native, born elsewhere 12.6% of residents of East Islip speak English at home.
69.5% of residents speak Spanish at home 116 100.0% Speak English very well6.0% of residents speak other language at home 10 100.0% Speak English less than very well
English speakers - Foreign-born 1.4% of residents of East Islip speak English at home.
53.4% of residents speak Spanish at home 458 72.5% Speak English very well174 27.5% Speak English less than very well41.5% of residents speak other language at home 390 79.4% Speak English very well101 20.6% Speak English less than very well
White (Caucasian) - Speak only English Native:
98.4% (9,570)Foreign-born:
2.9% (10)
White (Caucasian) - Speak another language Native:
2.5% (248)Foreign-born:
89.0% (301)
Black or African American - Speak only English Native:
89.9% (337)Foreign-born:
6.9% (6)
Black or African American - Speak another language Native:
9.6% (36)Foreign-born:
83.7% (73)
Other race - Speak only English Native:
5.4% (32)Foreign-born:
0.3% (1)
Other race - Speak another language Native:
90.6% (531)Foreign-born:
100.0% (389)
Two or more races - Speak another language Native:
33.7% (230)Foreign-born:
100.0% (213)
White alone - Speak only English Native:
97.5% (9,497)Foreign-born:
3.4% (11)
White alone - Speak another language Native:
2.4% (233)Foreign-born:
96.5% (307)
Hispanic or Latino - Speak only English Native:
44.6% (545)Foreign-born:
0.1% (1)
Hispanic or Latino - Speak another language Native:
55.1% (674)Foreign-born:
100.0% (691)
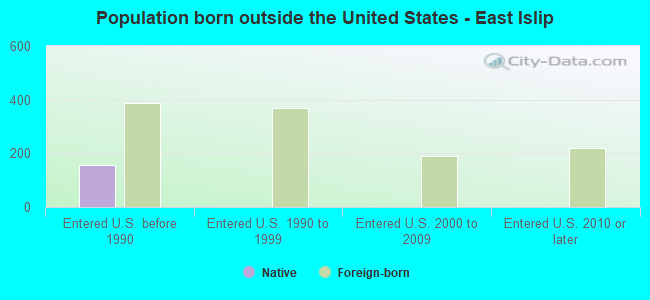
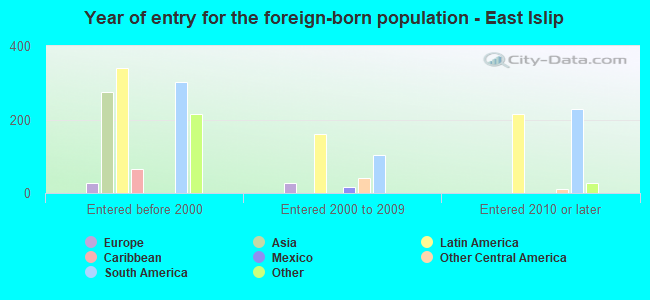
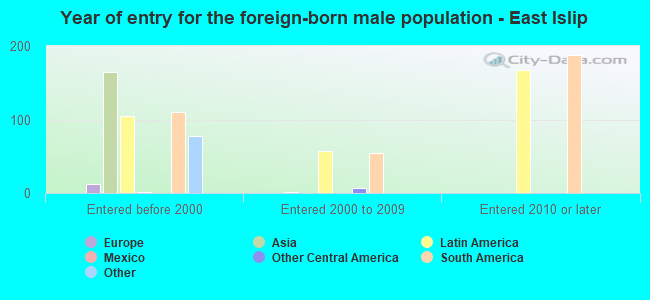
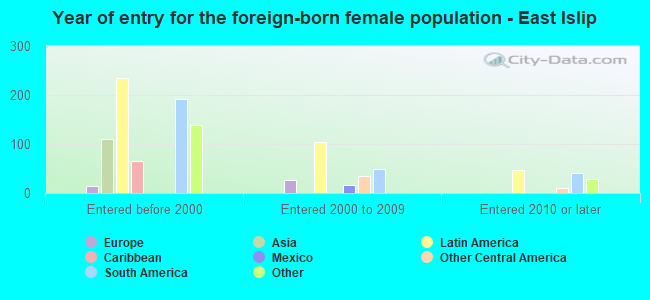
Foreign-born residents in East Islip 1,090 residents are foreign born (4.7% Latin America , 2.0% Asia , 1.0% Africa ).
This city:
8.0%New York:
22.6%
Marital status for residents in East Islip Marital status - White (Caucasian) population 15 years and over
Males 32.4% Never married55.5% Now married0.0% Separated2.7% Widowed9.4% DivorcedFemales 29.5% Never married49.8% Now married1.5% Separated10.3% Widowed8.9% DivorcedWomen who gave birth in the past 12 months Now married:
100.0% (50)Unmarried:
0.0% (0)
Women who did not give birth in the past 12 months Now married:
43.7% (830)Unmarried:
56.3% (1,067)
Marital status - Black or African American population 15 years and over
Males 93.4% Never married6.6% Now married0.0% Separated0.0% Widowed0.0% DivorcedFemales 39.9% Never married13.3% Now married0.0% Separated15.6% Widowed31.2% DivorcedWomen who did not give birth in the past 12 months Now married:
0.0% (0)Unmarried:
100.0% (58)
Marital status - American Indian / Alaska Native population 15 years and over
Males 100.0% Never married0.0% Now married0.0% Separated0.0% Widowed0.0% DivorcedFemales 39.5% Never married60.5% Now married0.0% Separated0.0% Widowed0.0% DivorcedWomen who did not give birth in the past 12 months Now married:
60.5% (33)Unmarried:
39.5% (21)
Marital status - Asian population 15 years and over
Males 75.0% Never married25.0% Now married0.0% Separated0.0% Widowed0.0% DivorcedFemales 43.8% Never married56.2% Now married0.0% Separated0.0% Widowed0.0% DivorcedWomen who did not give birth in the past 12 months Now married:
0.0% (0)Unmarried:
100.0% (22)
Marital status - Other race population 15 years and over
Males 56.5% Never married12.3% Now married0.0% Separated0.0% Widowed31.2% DivorcedFemales 84.0% Never married12.2% Now married0.0% Separated3.7% Widowed0.0% DivorcedWomen who did not give birth in the past 12 months Now married:
10.2% (35)Unmarried:
89.8% (308)
Marital status - Two or more races population 15 years and over
Males 35.5% Never married64.5% Now married0.0% Separated0.0% Widowed0.0% DivorcedFemales 0.0% Never married79.8% Now married0.0% Separated0.0% Widowed20.2% DivorcedWomen who did not give birth in the past 12 months Now married:
67.0% (113)Unmarried:
33.0% (56)
Marital status - White alone, not Hispanic / Latino population 15 years and over
Males 32.0% Never married55.9% Now married0.0% Separated2.9% Widowed9.3% DivorcedFemales 28.6% Never married50.2% Now married1.6% Separated10.7% Widowed8.9% DivorcedWomen who gave birth in the past 12 months Now married:
100.0% (54)Unmarried:
0.0% (0)
Women who did not give birth in the past 12 months Now married:
44.3% (861)Unmarried:
55.7% (1,084)
Marital status - Hispanic or Latino population 15 years and over
Males 50.0% Never married33.1% Now married0.0% Separated0.0% Widowed16.9% DivorcedFemales 52.2% Never married38.1% Now married0.0% Separated2.8% Widowed6.9% DivorcedWomen who did not give birth in the past 12 months Now married:
32.5% (169)Unmarried:
67.5% (352)
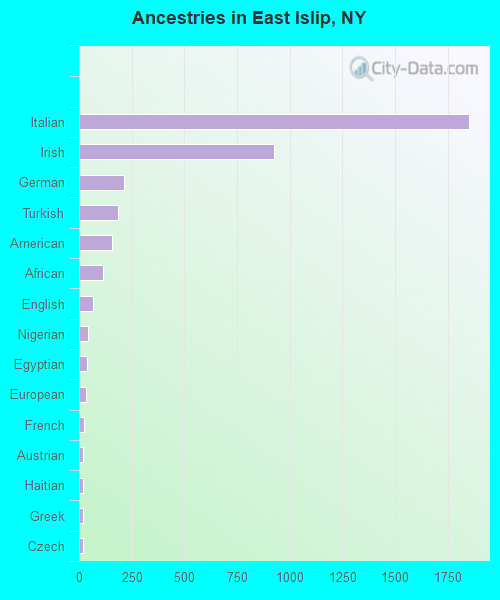
Ancestries in East Islip
1,854 35.7% Italian924 17.8% Irish216 4.2% German185 3.6% Turkish159 3.1% American113 2.2% African66 1.3% English42 0.8% Nigerian40 0.8% Egyptian33 0.6% European22 0.4% French19 0.4% Austrian19 0.4% Haitian18 0.3% Greek17 0.3% Czech14 0.3% Russian13 0.3% Hungarian13 0.3% Polish11 0.2% French Canadian9 0.2% Ukrainian8 0.2% Scandinavian2 0.04% Croatian1 0.02% Slovak
Children Nativity (place of birth) in East Islip
Children under 6 years - Living with two parents Both parents native 543 100.0% NativeBoth parents foreign-born 250 100.0% NativeChildren under 6 years - Living with one parent Native parent 35 100.0% NativeChildren 6 to 17 years - Living with two parents Both parents native 1,139 100.0% Native0 0.0% Foreign-bornBoth parents foreign-born 20 100.0% Foreign-bornOne native, one foreign-born parent 139 100.0% NativeChildren 6 to 17 years - Living with one parent Native parent 304 100.0% NativeForeign-born parent 153 51.5% Native144 48.5% Foreign-born