Races in East Jefferson, Texas (TX) Detailed Stats
Ancestries, Foreign-born residents, place of birth
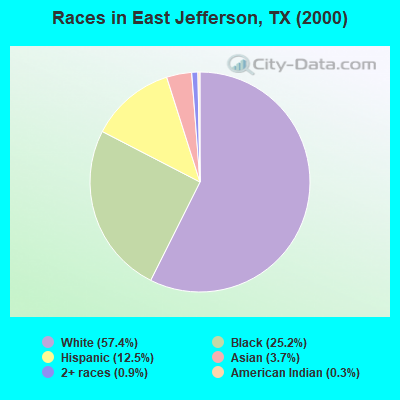
Race distribution in East Jefferson

- 66,59357.4%White alone
- 29,22325.2%Black alone
- 14,51612.5%Hispanic
- 4,3173.7%Asian alone
- 1,0030.9%Two or more races
- 3330.3%American Indian alone
- 510.04%Other race alone
- 240.02%Native Hawaiian and Other
Pacific Islander alone
2000
2022
-
- 10,933,31352.4%White alone
- 6,669,66632.0%Hispanic
- 2,364,25511.3%Black alone
- 554,4452.7%Asian alone
- 230,5671.1%Two or more races
- 68,8590.3%American Indian alone
- 19,9580.10%Other race alone
- 10,7570.05%Native Hawaiian and Other
Pacific Islander alone

-
- 12,070,64240.2%Hispanic
- 11,683,43038.9%White alone
- 3,508,70611.7%Black alone
- 1,608,1735.4%Asian alone
- 956,5603.2%Two or more races
- 125,7630.4%Other race alone
- 47,0230.2%American Indian alone
- 29,2750.10%Native Hawaiian and Other
Pacific Islander alone

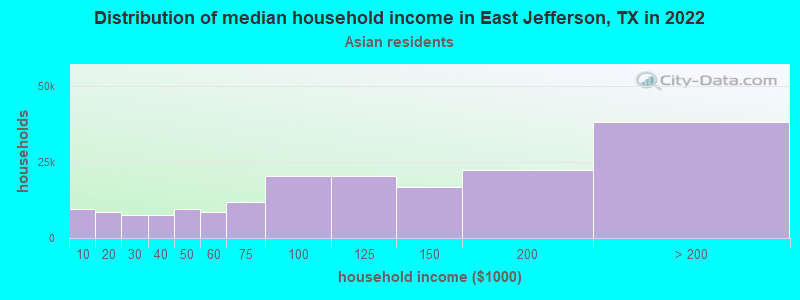
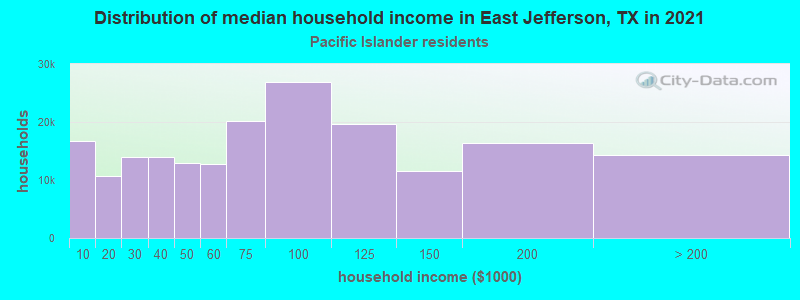
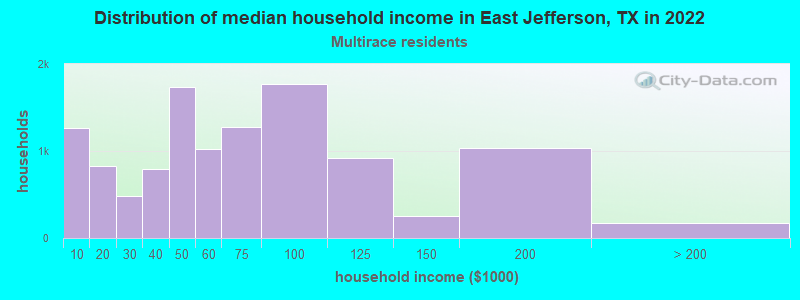
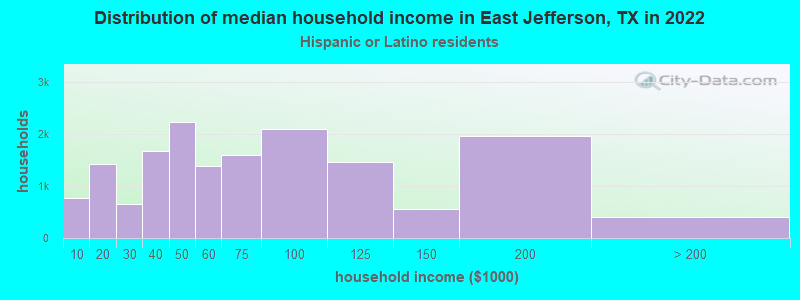
Income and house value in East Jefferson
- Median household income in 2022
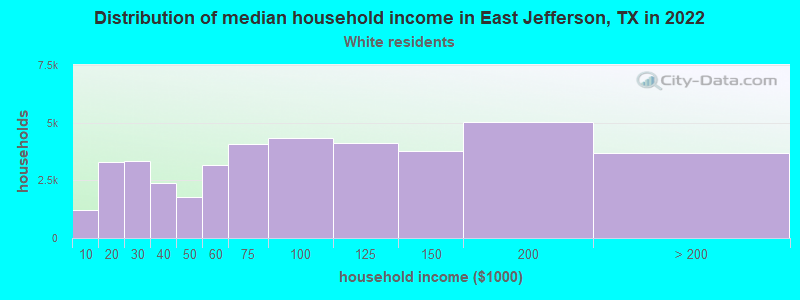
- $78,421White non-Hispanic householders
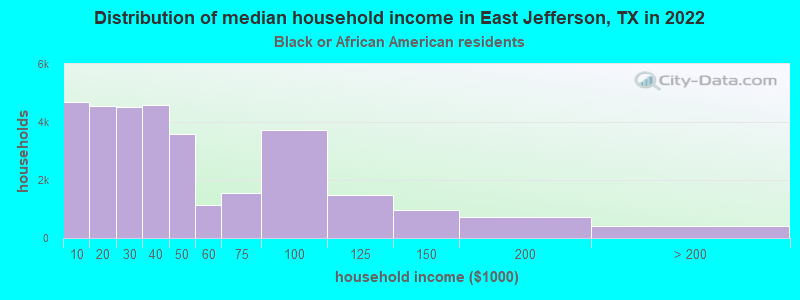
- $32,300Black householders
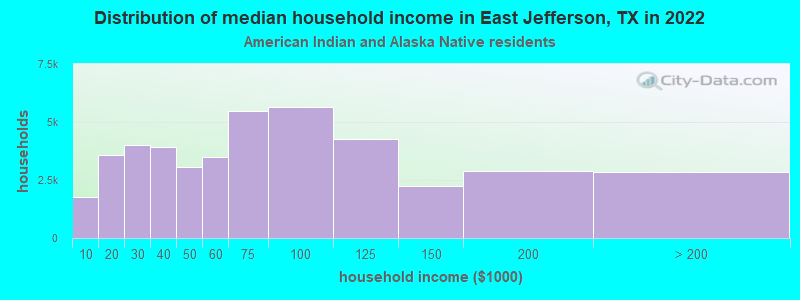
- $66,607American Indian and Alaska Native householders
- $68,582Asian householders
- $56,567Some other race householders
- $54,617Two or more races householders
- $60,286Hispanic or Latino race householders
- Median 2022 house value
- $173,763White Non-Hispanic householders
- $83,020Black or African American householders
- $115,014American Indian or Alaska Native householders
- $145,630Asian householders
- $228,098Native Hawaiian and other Pacific Islander householders
- $88,812Some other race householders
- $129,081Two or more races householders
- $96,535Hispanic or Latino householders
Household income for White non-Hispanic householders
Household income for Black householders
Household income for American Indian and Alaska Native householders
Household income for Asian householders
Household income for Native Hawaiian and other Pacific Islander householders
Household income for Two or more races householders
Household income for Hispanic or Latino race householders
Zip code: 77642