Races in East Milton, Florida (FL) Detailed Stats
Data:
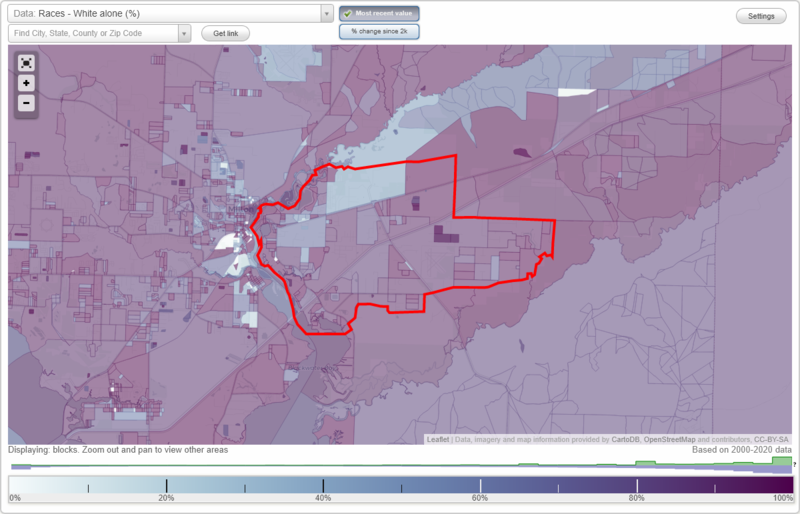
Races - White alone (%)
Races - White alone (% change since 2000)
Races - Black alone (%)
Races - Black alone (% change since 2000)
Races - American Indian alone (%)
Races - American Indian alone (% change since 2000)
Races - Asian alone (%)
Races - Asian alone (% change since 2000)
Races - Hispanic (%)
Races - Hispanic (% change since 2000)
Races - Native Hawaiian and Other Pacific Islander alone (%)
Races - Native Hawaiian and Other Pacific Islander alone (% change since 2000)
Races - Two or more races(%)
Races - Two or more races(% change since 2000)
Races - Other race alone (%)
Races - Other race alone (% change since 2000)
Racial diversity
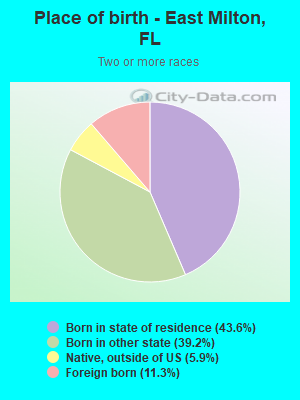
Place of birth - Born in state of residence (%)
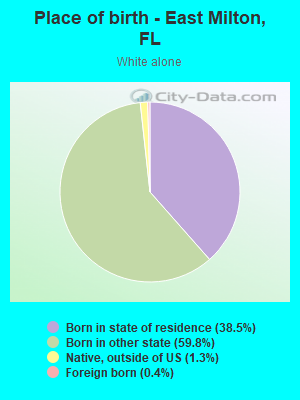
Place of birth - Born in state of residence (%) - White
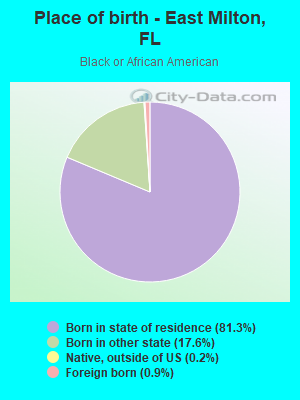
Place of birth - Born in state of residence (%) - Black or African American
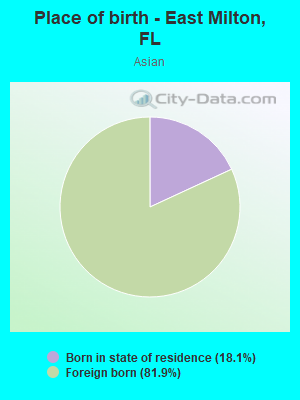
Place of birth - Born in state of residence (%) - Asian
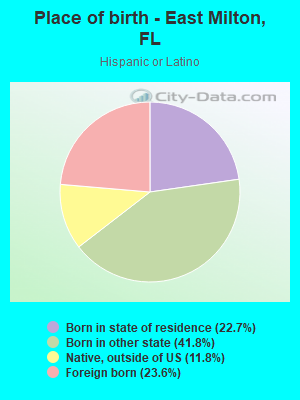
Place of birth - Born in state of residence (%) - Hispanic or Latino
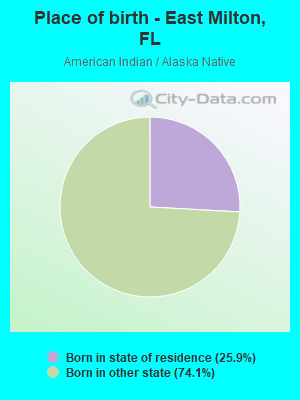
Place of birth - Born in state of residence (%) - American Indian and Alaska Native
Place of birth - Born in state of residence (%) - Multirace
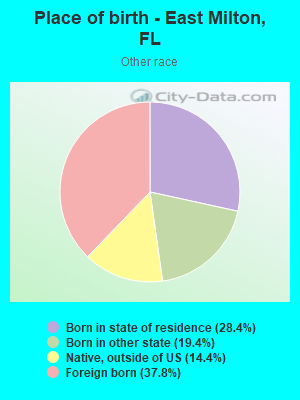
Place of birth - Born in state of residence (%) - Other Race
Place of birth - Born in other state (%)
Place of birth - Born in other state (%) - White
Place of birth - Born in other state (%) - Black or African American
Place of birth - Born in other state (%) - Asian
Place of birth - Born in other state (%) - Hispanic or Latino
Place of birth - Born in other state (%) - American Indian and Alaska Native
Place of birth - Born in other state (%) - Multirace
Place of birth - Born in other state (%) - Other Race
Place of birth - Native, outside of US (%)
Place of birth - Native, outside of US (%) - White
Place of birth - Native, outside of US (%) - Black or African American
Place of birth - Native, outside of US (%) - Asian
Place of birth - Native, outside of US (%) - Hispanic or Latino
Place of birth - Native, outside of US (%) - American Indian and Alaska Native
Place of birth - Native, outside of US (%) - Multirace
Place of birth - Native, outside of US (%) - Other Race
Place of birth - Foreign born (%)
Place of birth - Foreign born (%) - White
Place of birth - Foreign born (%) - Black or African American
Place of birth - Foreign born (%) - Asian
Place of birth - Foreign born (%) - Hispanic or Latino
Place of birth - Foreign born (%) - American Indian and Alaska Native
Place of birth - Foreign born (%) - Multirace
Place of birth - Foreign born (%) - Other Race
Residents speaking English at home (%)
Residents speaking English at home - Born in the United States (%)
Residents speaking English at home - Native, born elsewhere (%)
Residents speaking English at home - Foreign born (%)
Residents speaking Spanish at home (%)
Residents speaking Spanish at home - Born in the United States (%)
Residents speaking Spanish at home - Native, born elsewhere (%)
Residents speaking Spanish at home - Foreign born (%)
Residents speaking other language at home (%)
Residents speaking other language at home - Born in the United States (%)
Residents speaking other language at home - Native, born elsewhere (%)
Residents speaking other language at home - Foreign born (%)
Marital status - Never married (%)
Marital status - Now married (%)
Marital status - Separated (%)
Marital status - Widowed (%)
Marital status - Divorced (%)
Ancestries Reported - Arab (%)
Ancestries Reported - Czech (%)
Ancestries Reported - Danish (%)
Ancestries Reported - Dutch (%)
Ancestries Reported - English (%)
Ancestries Reported - French (%)
Ancestries Reported - French Canadian (%)
Ancestries Reported - German (%)
Ancestries Reported - Greek (%)
Ancestries Reported - Hungarian (%)
Ancestries Reported - Irish (%)
Ancestries Reported - Italian (%)
Ancestries Reported - Lithuanian (%)
Ancestries Reported - Norwegian (%)
Ancestries Reported - Polish (%)
Ancestries Reported - Portuguese (%)
Ancestries Reported - Russian (%)
Ancestries Reported - Scotch-Irish (%)
Ancestries Reported - Scottish (%)
Ancestries Reported - Slovak (%)
Ancestries Reported - Subsaharan African (%)
Ancestries Reported - Swedish (%)
Ancestries Reported - Swiss (%)
Ancestries Reported - Ukrainian (%)
Ancestries Reported - United States (%)
Ancestries Reported - Welsh (%)
Ancestries Reported - West Indian (%)
Ancestries Reported - Other (%)
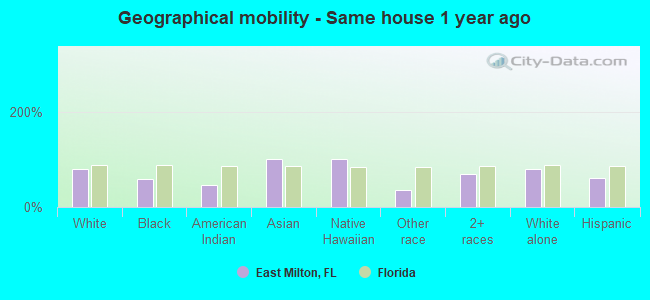
Geographical mobility - Same house 1 year ago (%)
Geographical mobility - Same house 1 year ago (%) - White
Geographical mobility - Same house 1 year ago (%) - Black or African American
Geographical mobility - Same house 1 year ago (%) - Asian
Geographical mobility - Same house 1 year ago (%) - Hispanic or Latino
Geographical mobility - Same house 1 year ago (%) - American Indian and Alaska Native
Geographical mobility - Same house 1 year ago (%) - Multirace
Geographical mobility - Same house 1 year ago (%) - Other Race
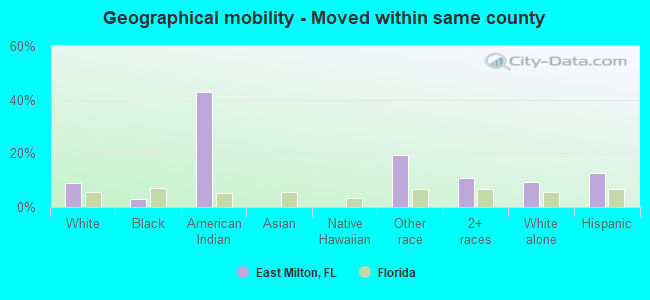
Geographical mobility - Moved within same county (%)
Geographical mobility - Moved within same county (%) - White
Geographical mobility - Moved within same county (%) - Black or African American
Geographical mobility - Moved within same county (%) - Asian
Geographical mobility - Moved within same county (%) - Hispanic or Latino
Geographical mobility - Moved within same county (%) - American Indian and Alaska Native
Geographical mobility - Moved within same county (%) - Multirace
Geographical mobility - Moved within same county (%) - Other Race
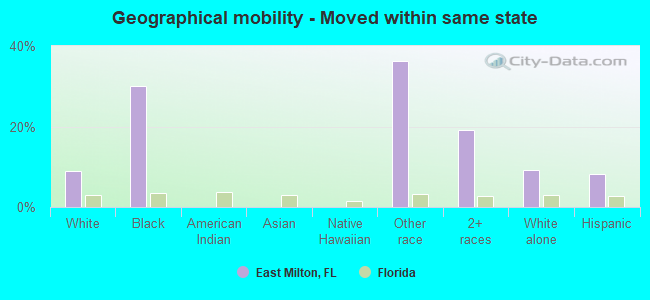
Geographical mobility - Moved from different county within same state (%)
Geographical mobility - Moved from different county within same state (%) - White
Geographical mobility - Moved from different county within same state (%) - Black or African American
Geographical mobility - Moved from different county within same state (%) - Asian
Geographical mobility - Moved from different county within same state (%) - Hispanic or Latino
Geographical mobility - Moved from different county within same state (%) - American Indian and Alaska Native
Geographical mobility - Moved from different county within same state (%) - Multirace
Geographical mobility - Moved from different county within same state (%) - Other Race
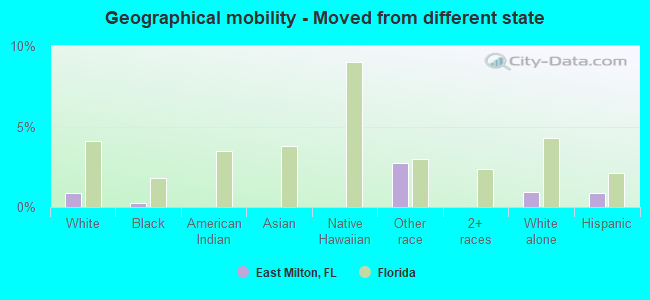
Geographical mobility - Moved from different state (%)
Geographical mobility - Moved from different state (%) - White
Geographical mobility - Moved from different state (%) - Black or African American
Geographical mobility - Moved from different state (%) - Asian
Geographical mobility - Moved from different state (%) - Hispanic or Latino
Geographical mobility - Moved from different state (%) - American Indian and Alaska Native
Geographical mobility - Moved from different state (%) - Multirace
Geographical mobility - Moved from different state (%) - Other Race
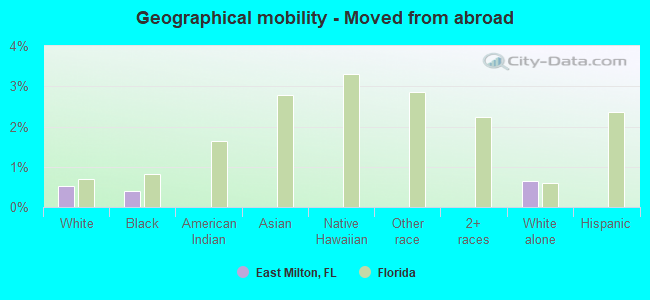
Geographical mobility - Moved from abroad (%)
Geographical mobility - Moved from abroad (%) - White
Geographical mobility - Moved from abroad (%) - Black or African American
Geographical mobility - Moved from abroad (%) - Asian
Geographical mobility - Moved from abroad (%) - Hispanic or Latino
Geographical mobility - Moved from abroad (%) - American Indian and Alaska Native
Geographical mobility - Moved from abroad (%) - Multirace
Geographical mobility - Moved from abroad (%) - Other Race
Place of birth for the foreign-born population - Ireland (%)
Place of birth for the foreign-born population - Denmark (%)
Place of birth for the foreign-born population - Norway (%)
Place of birth for the foreign-born population - Sweden (%)
Place of birth for the foreign-born population - United Kingdom (%)
Place of birth for the foreign-born population - England (%)
Place of birth for the foreign-born population - Scotland (%)
Place of birth for the foreign-born population - Other Northern Europe (%)
Place of birth for the foreign-born population - Austria (%)
Place of birth for the foreign-born population - Belgium (%)
Place of birth for the foreign-born population - France (%)
Place of birth for the foreign-born population - Germany (%)
Place of birth for the foreign-born population - Netherlands (%)
Place of birth for the foreign-born population - Switzerland (%)
Place of birth for the foreign-born population - Other Western Europe (%)
Place of birth for the foreign-born population - Greece (%)
Place of birth for the foreign-born population - Italy (%)
Place of birth for the foreign-born population - Portugal (%)
Place of birth for the foreign-born population - Spain (%)
Place of birth for the foreign-born population - Other Southern Europe (%)
Place of birth for the foreign-born population - Albania (%)
Place of birth for the foreign-born population - Belarus (%)
Place of birth for the foreign-born population - Bosnia and Herzegovina (%)
Place of birth for the foreign-born population - Bulgaria (%)
Place of birth for the foreign-born population - Croatia (%)
Place of birth for the foreign-born population - Czechoslovakia (%)
Place of birth for the foreign-born population - Hungary (%)
Place of birth for the foreign-born population - Latvia (%)
Place of birth for the foreign-born population - Lithuania (%)
Place of birth for the foreign-born population - North Macedonia (Macedonia) (%)
Place of birth for the foreign-born population - Moldova (%)
Place of birth for the foreign-born population - Poland (%)
Place of birth for the foreign-born population - Romania (%)
Place of birth for the foreign-born population - Russia (%)
Place of birth for the foreign-born population - Serbia (%)
Place of birth for the foreign-born population - Ukraine (%)
Place of birth for the foreign-born population - Other Eastern Europe (%)
Place of birth for the foreign-born population - China (%)
Place of birth for the foreign-born population - Hong Kong (%)
Place of birth for the foreign-born population - Taiwan (%)
Place of birth for the foreign-born population - Japan (%)
Place of birth for the foreign-born population - Korea (%)
Place of birth for the foreign-born population - Other Eastern Asia (%)
Place of birth for the foreign-born population - Afghanistan (%)
Place of birth for the foreign-born population - Bangladesh (%)
Place of birth for the foreign-born population - India (%)
Place of birth for the foreign-born population - Iran (%)
Place of birth for the foreign-born population - Kazakhstan (%)
Place of birth for the foreign-born population - Nepal (%)
Place of birth for the foreign-born population - Pakistan (%)
Place of birth for the foreign-born population - Sri Lanka (%)
Place of birth for the foreign-born population - Uzbekistan (%)
Place of birth for the foreign-born population - Other South Central Asia (%)
Place of birth for the foreign-born population - Burma (%)
Place of birth for the foreign-born population - Cambodia (%)
Place of birth for the foreign-born population - Indonesia (%)
Place of birth for the foreign-born population - Laos (%)
Place of birth for the foreign-born population - Malaysia (%)
Place of birth for the foreign-born population - Philippines (%)
Place of birth for the foreign-born population - Singapore (%)
Place of birth for the foreign-born population - Thailand (%)
Place of birth for the foreign-born population - Vietnam (%)
Place of birth for the foreign-born population - Other South Eastern Asia (%)
Place of birth for the foreign-born population - Armenia (%)
Place of birth for the foreign-born population - Iraq (%)
Place of birth for the foreign-born population - Israel (%)
Place of birth for the foreign-born population - Jordan (%)
Place of birth for the foreign-born population - Kuwait (%)
Place of birth for the foreign-born population - Lebanon (%)
Place of birth for the foreign-born population - Saudi Arabia (%)
Place of birth for the foreign-born population - Syria (%)
Place of birth for the foreign-born population - Turkey (%)
Place of birth for the foreign-born population - Yemen (%)
Place of birth for the foreign-born population - Other Western Asia (%)
Place of birth for the foreign-born population - Eritrea (%)
Place of birth for the foreign-born population - Ethiopia (%)
Place of birth for the foreign-born population - Kenya (%)
Place of birth for the foreign-born population - Somalia (%)
Place of birth for the foreign-born population - Uganda (%)
Place of birth for the foreign-born population - Zimbabwe (%)
Place of birth for the foreign-born population - Other Eastern Africa (%)
Place of birth for the foreign-born population - Cameroon (%)
Place of birth for the foreign-born population - Congo (%)
Place of birth for the foreign-born population - Democratic Republic of Congo (Zaire) (%)
Place of birth for the foreign-born population - Other Middle Africa (%)
Place of birth for the foreign-born population - Egypt (%)
Place of birth for the foreign-born population - Morocco (%)
Place of birth for the foreign-born population - Sudan (%)
Place of birth for the foreign-born population - Other Northern Africa (%)
Place of birth for the foreign-born population - South Africa (%)
Place of birth for the foreign-born population - Other Southern Africa (%)
Place of birth for the foreign-born population - Cabo Verde (%)
Place of birth for the foreign-born population - Ghana (%)
Place of birth for the foreign-born population - Liberia (%)
Place of birth for the foreign-born population - Nigeria (%)
Place of birth for the foreign-born population - Senegal (%)
Place of birth for the foreign-born population - Sierra Leone (%)
Place of birth for the foreign-born population - Other Western Africa (%)
Place of birth for the foreign-born population - Australia (%)
Place of birth for the foreign-born population - New Zealand (%)
Place of birth for the foreign-born population - Fiji (%)
Place of birth for the foreign-born population - Micronesia (%)
Place of birth for the foreign-born population - Bahamas (%)
Place of birth for the foreign-born population - Barbados (%)
Place of birth for the foreign-born population - Cuba (%)
Place of birth for the foreign-born population - Dominica (%)
Place of birth for the foreign-born population - Dominican Republic (%)
Place of birth for the foreign-born population - Grenada (%)
Place of birth for the foreign-born population - Haiti (%)
Place of birth for the foreign-born population - Jamaica (%)
Place of birth for the foreign-born population - St. Vincent and the Grenadines (%)
Place of birth for the foreign-born population - Trinidad and Tobago (%)
Place of birth for the foreign-born population - West Indies (%)
Place of birth for the foreign-born population - Other Caribbean (%)
Place of birth for the foreign-born population - Belize (%)
Place of birth for the foreign-born population - Costa Rica (%)
Place of birth for the foreign-born population - El Salvador (%)
Place of birth for the foreign-born population - Guatemala (%)
Place of birth for the foreign-born population - Honduras (%)
Place of birth for the foreign-born population - Mexico (%)
Place of birth for the foreign-born population - Nicaragua (%)
Place of birth for the foreign-born population - Panama (%)
Place of birth for the foreign-born population - Other Central America (%)
Place of birth for the foreign-born population - Argentina (%)
Place of birth for the foreign-born population - Bolivia (%)
Place of birth for the foreign-born population - Brazil (%)
Place of birth for the foreign-born population - Chile (%)
Place of birth for the foreign-born population - Colombia (%)
Place of birth for the foreign-born population - Ecuador (%)
Place of birth for the foreign-born population - Guyana (%)
Place of birth for the foreign-born population - Peru (%)
Place of birth for the foreign-born population - Uruguay (%)
Place of birth for the foreign-born population - Venezuela (%)
Place of birth for the foreign-born population - Other South America (%)
Place of birth for the foreign-born population - Canada (%)
Place of birth for the foreign-born population - Other Northern America (%)
Place of birth for the foreign-born population - Other (%)
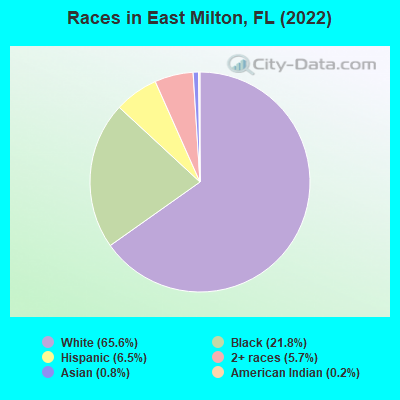
According to 2022 data, the most numerous races in East Milton, FL are White alone (9,609 residents), Hispanic (953 residents), and Black alone (3,197 residents). 93.1% of East Milton residents speak English at home.
Race distribution in East Milton 9,609 65.6% White alone 3,197 21.8% Black alone 953 6.5% Hispanic 836 5.7% Two or more races 120 0.8% Asian alone 26 0.2% American Indian alone 6 0.04% Native Hawaiian and Other
2000 2022
10,458,509 65.4% White alone 2,682,715 16.8% Hispanic 2,264,268 14.2% Black alone 261,693 1.6% Asian alone 236,954 1.5% Two or more races 42,358 0.3% American Indian alone 28,994 0.2% Other race alone 6,887 0.04% Native Hawaiian and Other
11,309,403 50.8% White alone 6,025,039 27.1% Hispanic 3,241,015 14.6% Black alone 861,630 3.9% Two or more races 623,692 2.8% Asian alone 152,054 0.7% Other race alone 22,504 0.1% American Indian alone 9,486 0.04% Native Hawaiian and Other
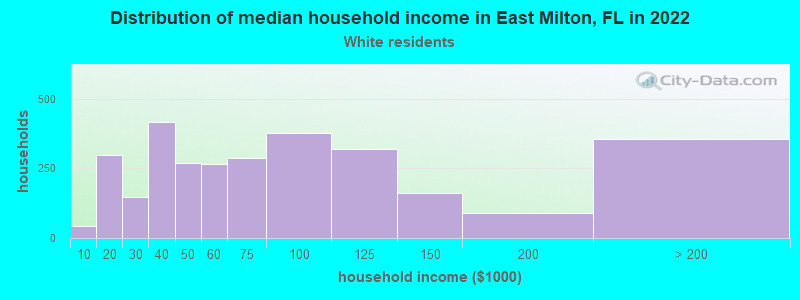
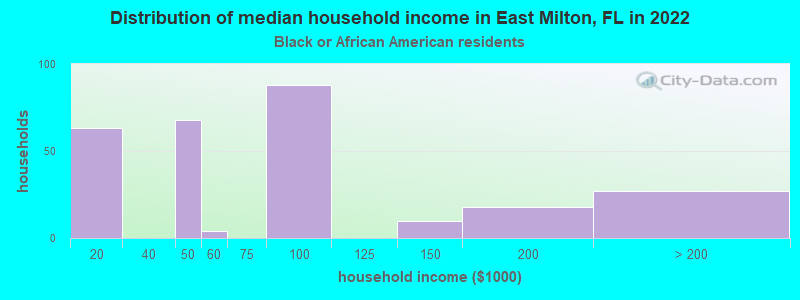
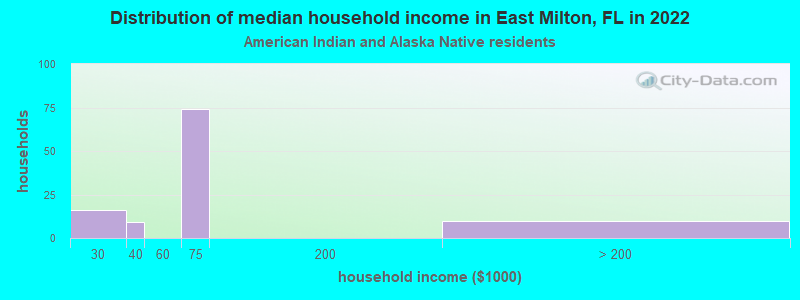
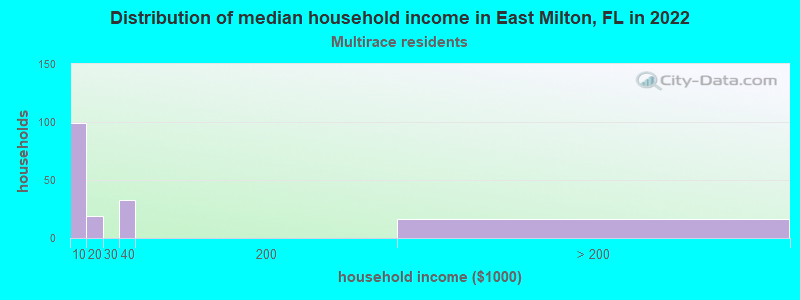
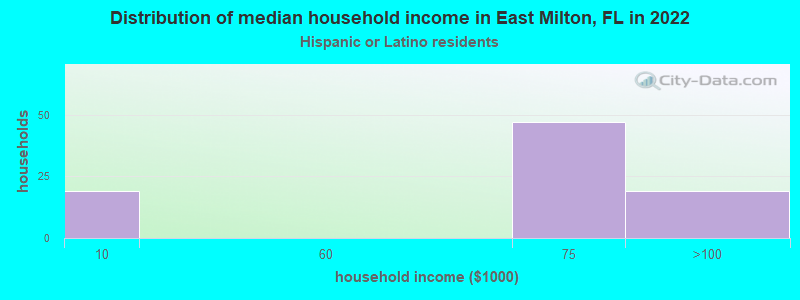
Income and house value in East Milton Median household income in 2022 $64,029 White non-Hispanic householders$68,568 American Indian and Alaska Native householders$53,606 Hispanic or Latino race householders
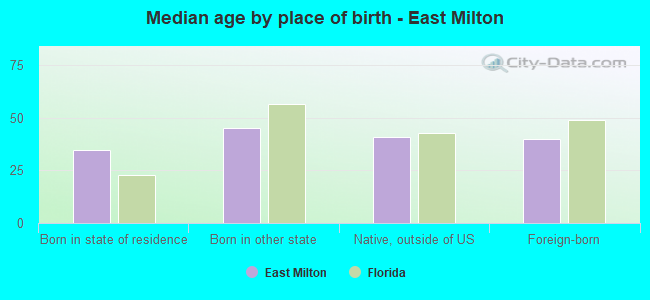
Median age by race in East Milton
42.9 Median age for White residents40.4 44.8 33.7 Median age for Black or African American residents31.4 51.5 51.5 Median age for American Indian / Alaska Native residents58.2 -859,386,151.9 36.1 Median age for Asian residents-569,668,975.6 37.5 -679,849,340.2 Median age for Native Hawaiian / Pacific Islander residents-858,307,848.3 -443,298,968.6 36.3 Median age for Other race residents40.8 -618,749,999.4 47.2 Median age for Two or more races residents45.1 49.0 43.6 Median age for White alone residents41.6 45.3 36.7 Median age for Hispanic or Latino residents35.4 39.2
Owner/renter occupied households by race in East Milton
House owners and renters - White residents 2,345 78.6% Owner occupied637 21.4% Renter occupiedHouse owners and renters - Black or African American residents 174 61.9% Owner occupied107 38.1% Renter occupiedHouse owners and renters - American Indian / Alaska Native residents 30 31.9% Owner occupied65 68.1% Renter occupiedHouse owners and renters - Two or more races residents 158 100.0% Owner occupiedHouse owners and renters - White alone residents 2,357 79.5% Owner occupied607 20.5% Renter occupiedHouse owners and renters - Hispanic or Latino residents 17 15.4% Owner occupied91 84.6% Renter occupied
Language usage in East Milton
English speakers - Total 93.1% of residents of East Milton speak English at home.
3.1% of residents speak Spanish at home 337 76.2% Speak English very well105 23.8% Speak English less than very well2.6% of residents speak other language at home 292 80.0% Speak English very well73 20.0% Speak English less than very well
English speakers - Born in the United States 95.4% of residents of East Milton speak English at home.
2.9% of residents speak Spanish at home 140 70.7% Speak English very well58 29.3% Speak English less than very well2.1% of residents speak other language at home 142 100.0% Speak English very well
English speakers - Native, born elsewhere 59.7% of residents of East Milton speak English at home.
21.2% of residents speak Spanish at home 31 53.4% Speak English very well27 46.6% Speak English less than very well4.4% of residents speak other language at home 10 83.3% Speak English very well2 16.7% Speak English less than very well
English speakers - Foreign-born 11.2% of residents of East Milton speak English at home.
41.0% of residents speak Spanish at home 57 35.4% Speak English very well104 64.6% Speak English less than very well36.4% of residents speak other language at home 87 60.8% Speak English very well56 39.2% Speak English less than very well
White (Caucasian) - Speak only English Native:
98.6% (9,263)Foreign-born:
28.9% (14)
White (Caucasian) - Speak another language Native:
1.5% (138)Foreign-born:
66.9% (33)
Black or African American - Speak only English Native:
93.9% (2,656)Foreign-born:
49.5% (26)
Black or African American - Speak another language Native:
6.1% (172)Foreign-born:
50.1% (26)
Other race - Speak another language Native:
73.9% (150)Foreign-born:
100.0% (171)
Two or more races - Speak only English Native:
85.2% (922)Foreign-born:
6.8% (9)
Two or more races - Speak another language Native:
16.6% (180)Foreign-born:
100.0% (139)
White alone - Speak only English Native:
98.6% (9,106)Foreign-born:
41.3% (15)
White alone - Speak another language Native:
1.2% (113)Foreign-born:
59.1% (22)
Hispanic or Latino - Speak another language Native:
22.2% (156)Foreign-born:
74.3% (168)
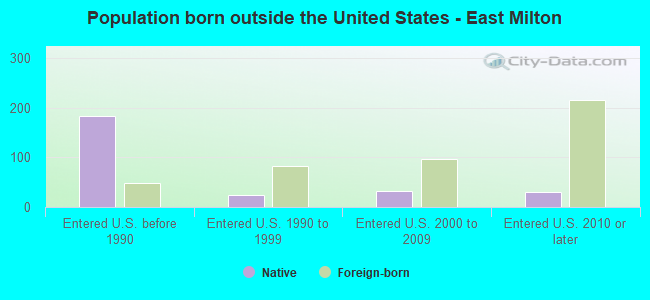
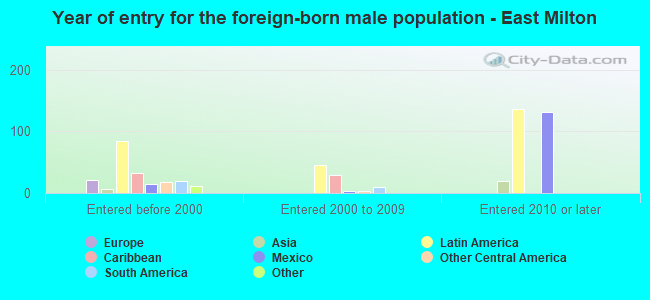
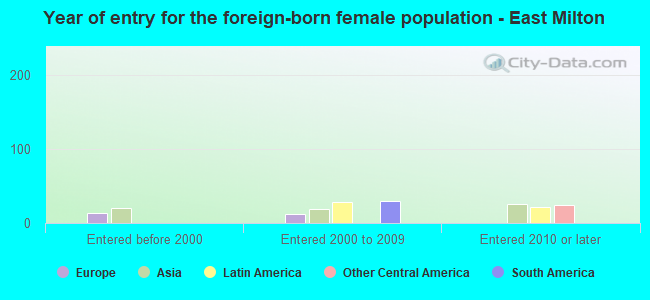
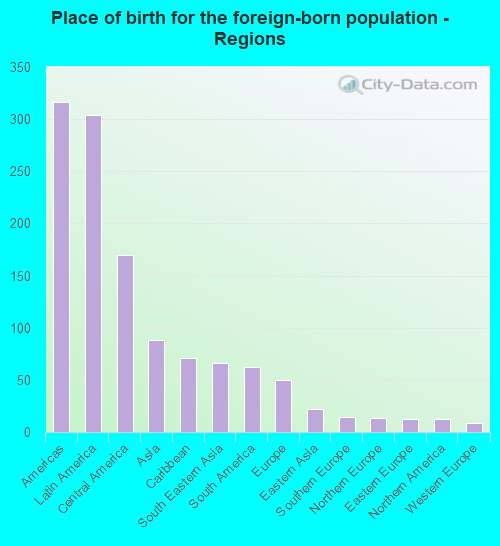
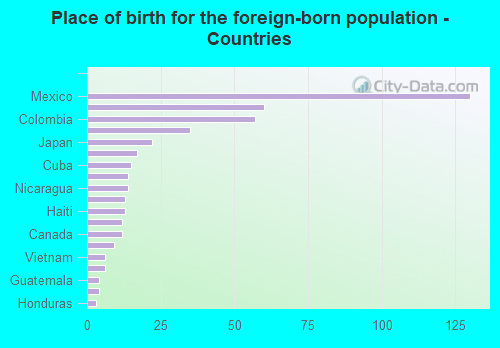
Foreign-born residents in East Milton
Marital status for residents in East Milton Marital status - White (Caucasian) population 15 years and over
Males 39.1% Never married36.2% Now married1.8% Separated2.9% Widowed19.9% DivorcedFemales 25.4% Never married46.0% Now married1.3% Separated7.7% Widowed19.6% DivorcedWomen who did not give birth in the past 12 months Now married:
46.6% (926)Unmarried:
53.4% (1,062)
Marital status - Black or African American population 15 years and over
Males 76.9% Never married14.0% Now married2.1% Separated1.2% Widowed5.9% DivorcedFemales 16.8% Never married42.5% Now married0.0% Separated0.0% Widowed40.7% DivorcedWomen who did not give birth in the past 12 months Now married:
8.4% (14)Unmarried:
91.6% (150)
Marital status - American Indian / Alaska Native population 15 years and over
Males 24.4% Never married10.3% Now married0.0% Separated10.3% Widowed55.1% DivorcedFemales 0.0% Never married100.0% Now married0.0% Separated0.0% Widowed0.0% DivorcedWomen who did not give birth in the past 12 months Now married:
100.0% (13)Unmarried:
0.0% (0)
Marital status - Asian population 15 years and over
Males 100.0% Never married0.0% Now married0.0% Separated0.0% Widowed0.0% DivorcedFemales 0.0% Never married100.0% Now married0.0% Separated0.0% Widowed0.0% DivorcedWomen who did not give birth in the past 12 months Now married:
100.0% (37)Unmarried:
0.0% (0)
Marital status - Two or more races population 15 years and over
Males 62.3% Never married16.5% Now married5.3% Separated0.4% Widowed15.6% DivorcedFemales 0.0% Never married59.5% Now married2.8% Separated23.7% Widowed14.0% DivorcedWomen who did not give birth in the past 12 months Now married:
100.0% (116)Unmarried:
0.0% (0)
Marital status - White alone, not Hispanic / Latino population 15 years and over
Males 37.8% Never married37.1% Now married1.8% Separated3.0% Widowed20.3% DivorcedFemales 24.6% Never married46.5% Now married1.3% Separated7.8% Widowed19.9% DivorcedWomen who did not give birth in the past 12 months Now married:
47.3% (914)Unmarried:
52.7% (1,017)
Marital status - Hispanic or Latino population 15 years and over
Males 74.7% Never married12.0% Now married1.0% Separated0.0% Widowed12.3% DivorcedFemales 24.4% Never married65.4% Now married0.0% Separated0.0% Widowed10.3% DivorcedWomen who did not give birth in the past 12 months Now married:
72.9% (115)Unmarried:
27.1% (43)
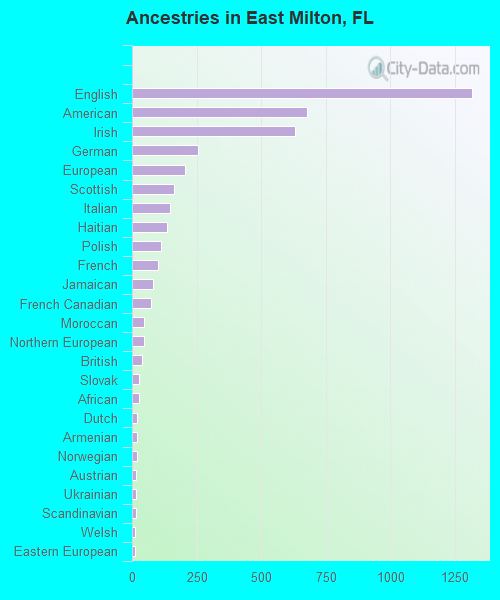
Ancestries in East Milton
1,316 18.2% English676 9.4% American629 8.7% Irish254 3.5% German205 2.8% European164 2.3% Scottish149 2.1% Italian134 1.9% Haitian112 1.6% Polish100 1.4% French80 1.1% Jamaican72 1.0% French Canadian48 0.7% Moroccan48 0.7% Northern European37 0.5% British28 0.4% Slovak28 0.4% African21 0.3% Dutch19 0.3% Armenian19 0.3% Norwegian15 0.2% Austrian15 0.2% Ukrainian14 0.2% Scandinavian13 0.2% Welsh12 0.2% Eastern European11 0.2% Canadian11 0.2% Russian10 0.1% Greek7 0.10% Arab7 0.10% Barbadian6 0.08% Czech2 0.03% Swedish1 0.01% Bahamian
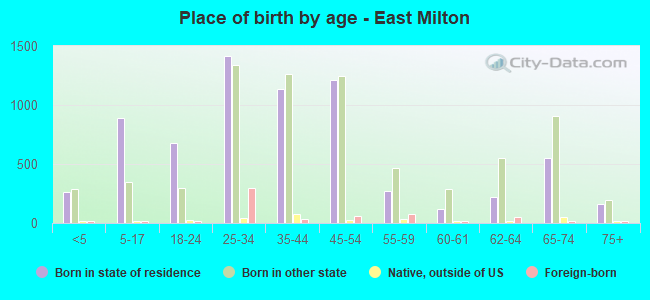
Children Nativity (place of birth) in East Milton
Children under 6 years - Living with two parents Both parents native 337 100.0% NativeOne native, one foreign-born parent 40 100.0% NativeChildren under 6 years - Living with one parent Native parent 20 100.0% Native
Children 6 to 17 years - Living with two parents Both parents native 732 100.0% NativeOne native, one foreign-born parent 23 100.0% NativeChildren 6 to 17 years - Living with one parent Native parent 214 100.0% Native
Grandparents responsible for own grandchildren in East Milton
Grandparents (30 to 59 years) White / Caucasian 8 7.7% Responsible for grandchildren102 92.3% Not responsible for grandchildrenWhite alone, not Hispanic / Latino 8 7.4% Responsible for grandchildren105 92.6% Not responsible for grandchildrenGrandparents (60 years and over) White / Caucasian 10 35.9% Responsible for grandchildren18 64.1% Not responsible for grandchildrenWhite alone, not Hispanic / Latino 10 34.8% Responsible for grandchildren19 65.2% Not responsible for grandchildren