Races in East Orange, New Jersey (NJ) Detailed Stats
Data:
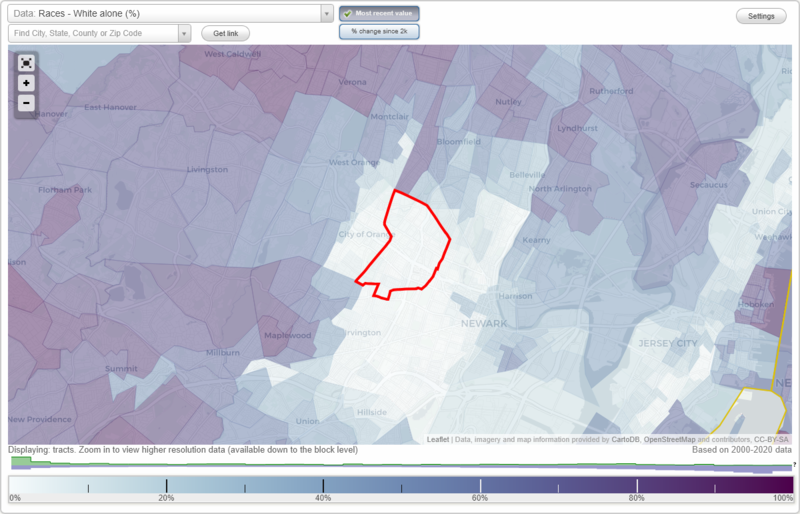
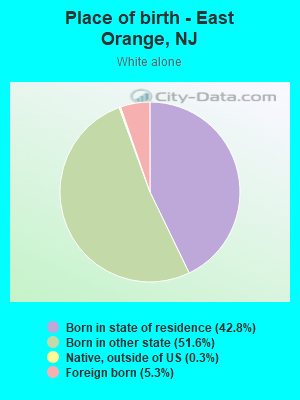
Races - White alone (%)
Races - White alone (% change since 2000)
Races - Black alone (%)
Races - Black alone (% change since 2000)
Races - American Indian alone (%)
Races - American Indian alone (% change since 2000)
Races - Asian alone (%)
Races - Asian alone (% change since 2000)
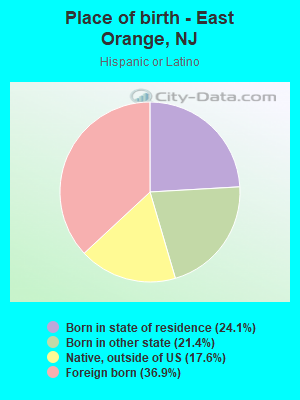
Races - Hispanic (%)
Races - Hispanic (% change since 2000)
Races - Native Hawaiian and Other Pacific Islander alone (%)
Races - Native Hawaiian and Other Pacific Islander alone (% change since 2000)
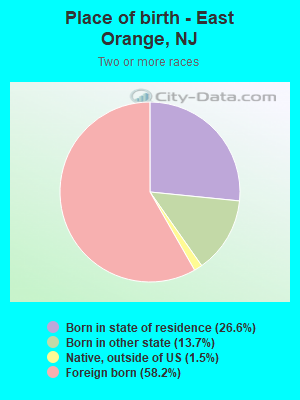
Races - Two or more races(%)
Races - Two or more races(% change since 2000)
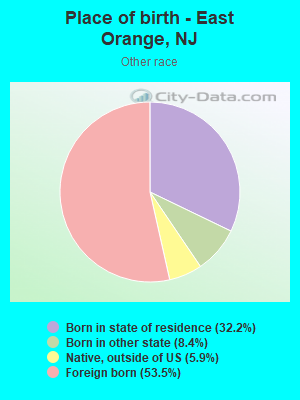
Races - Other race alone (%)
Races - Other race alone (% change since 2000)
Racial diversity
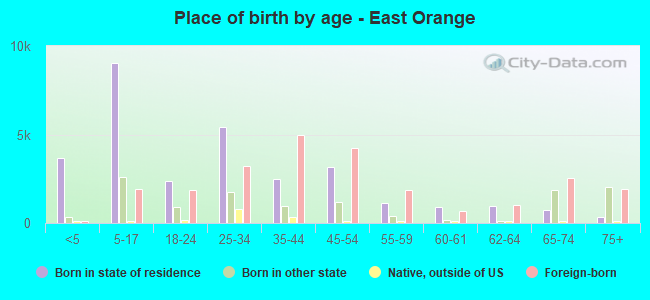
Place of birth - Born in state of residence (%)
Place of birth - Born in state of residence (%) - White
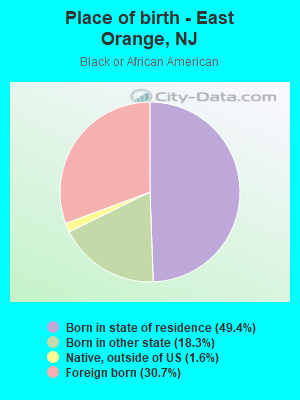
Place of birth - Born in state of residence (%) - Black or African American
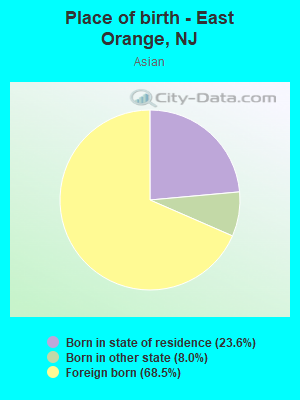
Place of birth - Born in state of residence (%) - Asian
Place of birth - Born in state of residence (%) - Hispanic or Latino
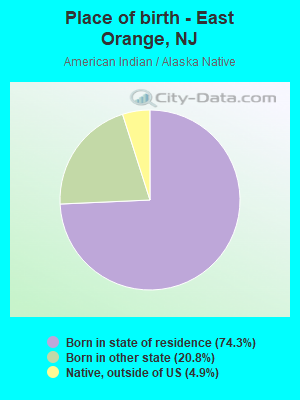
Place of birth - Born in state of residence (%) - American Indian and Alaska Native
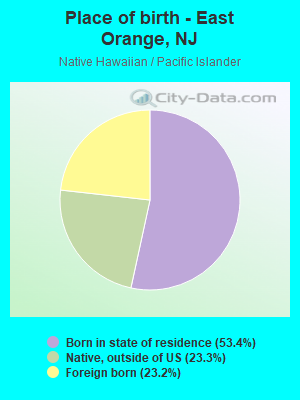
Place of birth - Born in state of residence (%) - Multirace
Place of birth - Born in state of residence (%) - Other Race
Place of birth - Born in other state (%)
Place of birth - Born in other state (%) - White
Place of birth - Born in other state (%) - Black or African American
Place of birth - Born in other state (%) - Asian
Place of birth - Born in other state (%) - Hispanic or Latino
Place of birth - Born in other state (%) - American Indian and Alaska Native
Place of birth - Born in other state (%) - Multirace
Place of birth - Born in other state (%) - Other Race
Place of birth - Native, outside of US (%)
Place of birth - Native, outside of US (%) - White
Place of birth - Native, outside of US (%) - Black or African American
Place of birth - Native, outside of US (%) - Asian
Place of birth - Native, outside of US (%) - Hispanic or Latino
Place of birth - Native, outside of US (%) - American Indian and Alaska Native
Place of birth - Native, outside of US (%) - Multirace
Place of birth - Native, outside of US (%) - Other Race
Place of birth - Foreign born (%)
Place of birth - Foreign born (%) - White
Place of birth - Foreign born (%) - Black or African American
Place of birth - Foreign born (%) - Asian
Place of birth - Foreign born (%) - Hispanic or Latino
Place of birth - Foreign born (%) - American Indian and Alaska Native
Place of birth - Foreign born (%) - Multirace
Place of birth - Foreign born (%) - Other Race
Residents speaking English at home (%)
Residents speaking English at home - Born in the United States (%)
Residents speaking English at home - Native, born elsewhere (%)
Residents speaking English at home - Foreign born (%)
Residents speaking Spanish at home (%)
Residents speaking Spanish at home - Born in the United States (%)
Residents speaking Spanish at home - Native, born elsewhere (%)
Residents speaking Spanish at home - Foreign born (%)
Residents speaking other language at home (%)
Residents speaking other language at home - Born in the United States (%)
Residents speaking other language at home - Native, born elsewhere (%)
Residents speaking other language at home - Foreign born (%)
Marital status - Never married (%)
Marital status - Now married (%)
Marital status - Separated (%)
Marital status - Widowed (%)
Marital status - Divorced (%)
Ancestries Reported - Arab (%)
Ancestries Reported - Czech (%)
Ancestries Reported - Danish (%)
Ancestries Reported - Dutch (%)
Ancestries Reported - English (%)
Ancestries Reported - French (%)
Ancestries Reported - French Canadian (%)
Ancestries Reported - German (%)
Ancestries Reported - Greek (%)
Ancestries Reported - Hungarian (%)
Ancestries Reported - Irish (%)
Ancestries Reported - Italian (%)
Ancestries Reported - Lithuanian (%)
Ancestries Reported - Norwegian (%)
Ancestries Reported - Polish (%)
Ancestries Reported - Portuguese (%)
Ancestries Reported - Russian (%)
Ancestries Reported - Scotch-Irish (%)
Ancestries Reported - Scottish (%)
Ancestries Reported - Slovak (%)
Ancestries Reported - Subsaharan African (%)
Ancestries Reported - Swedish (%)
Ancestries Reported - Swiss (%)
Ancestries Reported - Ukrainian (%)
Ancestries Reported - United States (%)
Ancestries Reported - Welsh (%)
Ancestries Reported - West Indian (%)
Ancestries Reported - Other (%)
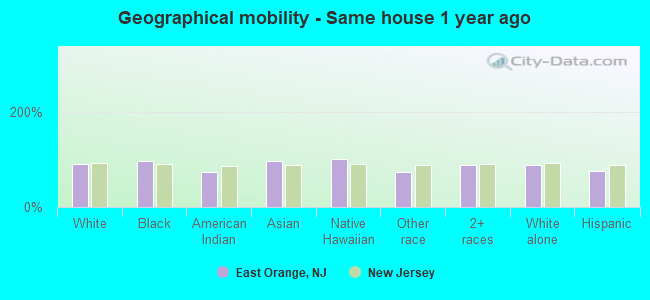
Geographical mobility - Same house 1 year ago (%)
Geographical mobility - Same house 1 year ago (%) - White
Geographical mobility - Same house 1 year ago (%) - Black or African American
Geographical mobility - Same house 1 year ago (%) - Asian
Geographical mobility - Same house 1 year ago (%) - Hispanic or Latino
Geographical mobility - Same house 1 year ago (%) - American Indian and Alaska Native
Geographical mobility - Same house 1 year ago (%) - Multirace
Geographical mobility - Same house 1 year ago (%) - Other Race
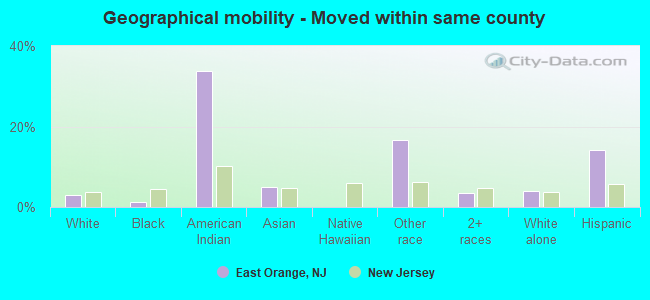
Geographical mobility - Moved within same county (%)
Geographical mobility - Moved within same county (%) - White
Geographical mobility - Moved within same county (%) - Black or African American
Geographical mobility - Moved within same county (%) - Asian
Geographical mobility - Moved within same county (%) - Hispanic or Latino
Geographical mobility - Moved within same county (%) - American Indian and Alaska Native
Geographical mobility - Moved within same county (%) - Multirace
Geographical mobility - Moved within same county (%) - Other Race
Geographical mobility - Moved from different county within same state (%)
Geographical mobility - Moved from different county within same state (%) - White
Geographical mobility - Moved from different county within same state (%) - Black or African American
Geographical mobility - Moved from different county within same state (%) - Asian
Geographical mobility - Moved from different county within same state (%) - Hispanic or Latino
Geographical mobility - Moved from different county within same state (%) - American Indian and Alaska Native
Geographical mobility - Moved from different county within same state (%) - Multirace
Geographical mobility - Moved from different county within same state (%) - Other Race
Geographical mobility - Moved from different state (%)
Geographical mobility - Moved from different state (%) - White
Geographical mobility - Moved from different state (%) - Black or African American
Geographical mobility - Moved from different state (%) - Asian
Geographical mobility - Moved from different state (%) - Hispanic or Latino
Geographical mobility - Moved from different state (%) - American Indian and Alaska Native
Geographical mobility - Moved from different state (%) - Multirace
Geographical mobility - Moved from different state (%) - Other Race
Geographical mobility - Moved from abroad (%)
Geographical mobility - Moved from abroad (%) - White
Geographical mobility - Moved from abroad (%) - Black or African American
Geographical mobility - Moved from abroad (%) - Asian
Geographical mobility - Moved from abroad (%) - Hispanic or Latino
Geographical mobility - Moved from abroad (%) - American Indian and Alaska Native
Geographical mobility - Moved from abroad (%) - Multirace
Geographical mobility - Moved from abroad (%) - Other Race
Place of birth for the foreign-born population - Ireland (%)
Place of birth for the foreign-born population - Denmark (%)
Place of birth for the foreign-born population - Norway (%)
Place of birth for the foreign-born population - Sweden (%)
Place of birth for the foreign-born population - United Kingdom (%)
Place of birth for the foreign-born population - England (%)
Place of birth for the foreign-born population - Scotland (%)
Place of birth for the foreign-born population - Other Northern Europe (%)
Place of birth for the foreign-born population - Austria (%)
Place of birth for the foreign-born population - Belgium (%)
Place of birth for the foreign-born population - France (%)
Place of birth for the foreign-born population - Germany (%)
Place of birth for the foreign-born population - Netherlands (%)
Place of birth for the foreign-born population - Switzerland (%)
Place of birth for the foreign-born population - Other Western Europe (%)
Place of birth for the foreign-born population - Greece (%)
Place of birth for the foreign-born population - Italy (%)
Place of birth for the foreign-born population - Portugal (%)
Place of birth for the foreign-born population - Spain (%)
Place of birth for the foreign-born population - Other Southern Europe (%)
Place of birth for the foreign-born population - Albania (%)
Place of birth for the foreign-born population - Belarus (%)
Place of birth for the foreign-born population - Bosnia and Herzegovina (%)
Place of birth for the foreign-born population - Bulgaria (%)
Place of birth for the foreign-born population - Croatia (%)
Place of birth for the foreign-born population - Czechoslovakia (%)
Place of birth for the foreign-born population - Hungary (%)
Place of birth for the foreign-born population - Latvia (%)
Place of birth for the foreign-born population - Lithuania (%)
Place of birth for the foreign-born population - North Macedonia (Macedonia) (%)
Place of birth for the foreign-born population - Moldova (%)
Place of birth for the foreign-born population - Poland (%)
Place of birth for the foreign-born population - Romania (%)
Place of birth for the foreign-born population - Russia (%)
Place of birth for the foreign-born population - Serbia (%)
Place of birth for the foreign-born population - Ukraine (%)
Place of birth for the foreign-born population - Other Eastern Europe (%)
Place of birth for the foreign-born population - China (%)
Place of birth for the foreign-born population - Hong Kong (%)
Place of birth for the foreign-born population - Taiwan (%)
Place of birth for the foreign-born population - Japan (%)
Place of birth for the foreign-born population - Korea (%)
Place of birth for the foreign-born population - Other Eastern Asia (%)
Place of birth for the foreign-born population - Afghanistan (%)
Place of birth for the foreign-born population - Bangladesh (%)
Place of birth for the foreign-born population - India (%)
Place of birth for the foreign-born population - Iran (%)
Place of birth for the foreign-born population - Kazakhstan (%)
Place of birth for the foreign-born population - Nepal (%)
Place of birth for the foreign-born population - Pakistan (%)
Place of birth for the foreign-born population - Sri Lanka (%)
Place of birth for the foreign-born population - Uzbekistan (%)
Place of birth for the foreign-born population - Other South Central Asia (%)
Place of birth for the foreign-born population - Burma (%)
Place of birth for the foreign-born population - Cambodia (%)
Place of birth for the foreign-born population - Indonesia (%)
Place of birth for the foreign-born population - Laos (%)
Place of birth for the foreign-born population - Malaysia (%)
Place of birth for the foreign-born population - Philippines (%)
Place of birth for the foreign-born population - Singapore (%)
Place of birth for the foreign-born population - Thailand (%)
Place of birth for the foreign-born population - Vietnam (%)
Place of birth for the foreign-born population - Other South Eastern Asia (%)
Place of birth for the foreign-born population - Armenia (%)
Place of birth for the foreign-born population - Iraq (%)
Place of birth for the foreign-born population - Israel (%)
Place of birth for the foreign-born population - Jordan (%)
Place of birth for the foreign-born population - Kuwait (%)
Place of birth for the foreign-born population - Lebanon (%)
Place of birth for the foreign-born population - Saudi Arabia (%)
Place of birth for the foreign-born population - Syria (%)
Place of birth for the foreign-born population - Turkey (%)
Place of birth for the foreign-born population - Yemen (%)
Place of birth for the foreign-born population - Other Western Asia (%)
Place of birth for the foreign-born population - Eritrea (%)
Place of birth for the foreign-born population - Ethiopia (%)
Place of birth for the foreign-born population - Kenya (%)
Place of birth for the foreign-born population - Somalia (%)
Place of birth for the foreign-born population - Uganda (%)
Place of birth for the foreign-born population - Zimbabwe (%)
Place of birth for the foreign-born population - Other Eastern Africa (%)
Place of birth for the foreign-born population - Cameroon (%)
Place of birth for the foreign-born population - Congo (%)
Place of birth for the foreign-born population - Democratic Republic of Congo (Zaire) (%)
Place of birth for the foreign-born population - Other Middle Africa (%)
Place of birth for the foreign-born population - Egypt (%)
Place of birth for the foreign-born population - Morocco (%)
Place of birth for the foreign-born population - Sudan (%)
Place of birth for the foreign-born population - Other Northern Africa (%)
Place of birth for the foreign-born population - South Africa (%)
Place of birth for the foreign-born population - Other Southern Africa (%)
Place of birth for the foreign-born population - Cabo Verde (%)
Place of birth for the foreign-born population - Ghana (%)
Place of birth for the foreign-born population - Liberia (%)
Place of birth for the foreign-born population - Nigeria (%)
Place of birth for the foreign-born population - Senegal (%)
Place of birth for the foreign-born population - Sierra Leone (%)
Place of birth for the foreign-born population - Other Western Africa (%)
Place of birth for the foreign-born population - Australia (%)
Place of birth for the foreign-born population - New Zealand (%)
Place of birth for the foreign-born population - Fiji (%)
Place of birth for the foreign-born population - Micronesia (%)
Place of birth for the foreign-born population - Bahamas (%)
Place of birth for the foreign-born population - Barbados (%)
Place of birth for the foreign-born population - Cuba (%)
Place of birth for the foreign-born population - Dominica (%)
Place of birth for the foreign-born population - Dominican Republic (%)
Place of birth for the foreign-born population - Grenada (%)
Place of birth for the foreign-born population - Haiti (%)
Place of birth for the foreign-born population - Jamaica (%)
Place of birth for the foreign-born population - St. Vincent and the Grenadines (%)
Place of birth for the foreign-born population - Trinidad and Tobago (%)
Place of birth for the foreign-born population - West Indies (%)
Place of birth for the foreign-born population - Other Caribbean (%)
Place of birth for the foreign-born population - Belize (%)
Place of birth for the foreign-born population - Costa Rica (%)
Place of birth for the foreign-born population - El Salvador (%)
Place of birth for the foreign-born population - Guatemala (%)
Place of birth for the foreign-born population - Honduras (%)
Place of birth for the foreign-born population - Mexico (%)
Place of birth for the foreign-born population - Nicaragua (%)
Place of birth for the foreign-born population - Panama (%)
Place of birth for the foreign-born population - Other Central America (%)
Place of birth for the foreign-born population - Argentina (%)
Place of birth for the foreign-born population - Bolivia (%)
Place of birth for the foreign-born population - Brazil (%)
Place of birth for the foreign-born population - Chile (%)
Place of birth for the foreign-born population - Colombia (%)
Place of birth for the foreign-born population - Ecuador (%)
Place of birth for the foreign-born population - Guyana (%)
Place of birth for the foreign-born population - Peru (%)
Place of birth for the foreign-born population - Uruguay (%)
Place of birth for the foreign-born population - Venezuela (%)
Place of birth for the foreign-born population - Other South America (%)
Place of birth for the foreign-born population - Canada (%)
Place of birth for the foreign-born population - Other Northern America (%)
Place of birth for the foreign-born population - Other (%)
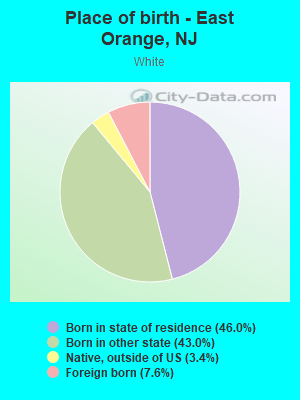
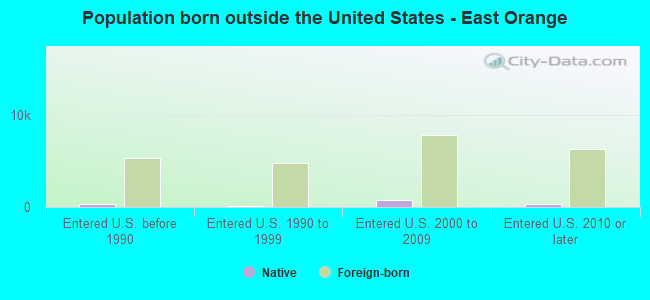
According to 2022 data, the most numerous races in East Orange, NJ are White alone (1,160 residents), Hispanic (8,036 residents), and Black alone (51,535 residents). 75.9% of East Orange residents speak English at home. 30.7% of East Orange, NJ residents are foreign-born (23.7% born in Latin America, 5.1% born in Africa), which is 25.0% greater than the foreign-born rate of 23.0% across the entire state of New Jersey.
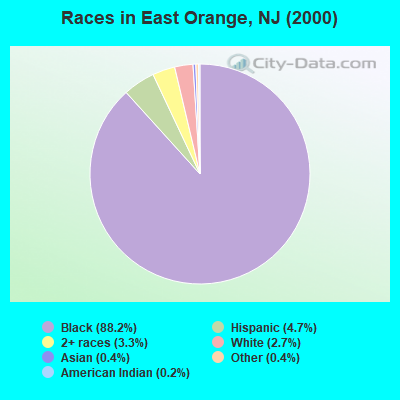
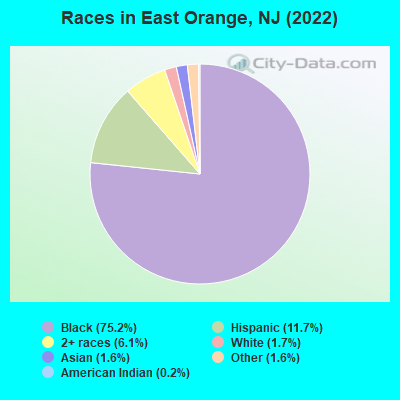
Race distribution in East Orange
2000 2022
61,604 88.2% Black alone 3,284 4.7% Hispanic 2,313 3.3% Two or more races 1,874 2.7% White alone 294 0.4% Asian alone 288 0.4% Other race alone 130 0.2% American Indian alone 37 0.05% Native Hawaiian and Other
51,535 75.2% Black alone 8,036 11.7% Hispanic 4,178 6.1% Two or more races 1,160 1.7% White alone 1,108 1.6% Asian alone 1,104 1.6% Other race alone 145 0.2% American Indian alone 40 0.06% Native Hawaiian and Other
2000 2022
5,557,209 66.0% White alone 1,117,191 13.3% Hispanic 1,096,171 13.0% Black alone 477,012 5.7% Asian alone 133,689 1.6% Two or more races 19,565 0.2% Other race alone 11,338 0.1% American Indian alone 2,175 0.03% Native Hawaiian and Other
4,766,476 51.5% White alone 2,028,470 21.9% Hispanic 1,111,632 12.0% Black alone 923,546 10.0% Asian alone 332,237 3.6% Two or more races 89,847 1.0% Other race alone 8,557 0.09% American Indian alone 934 0.01% Native Hawaiian and Other
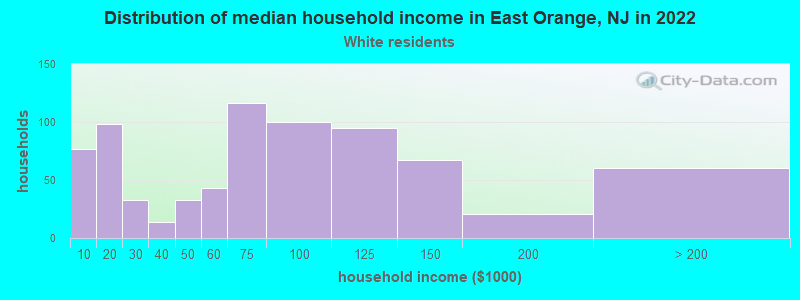
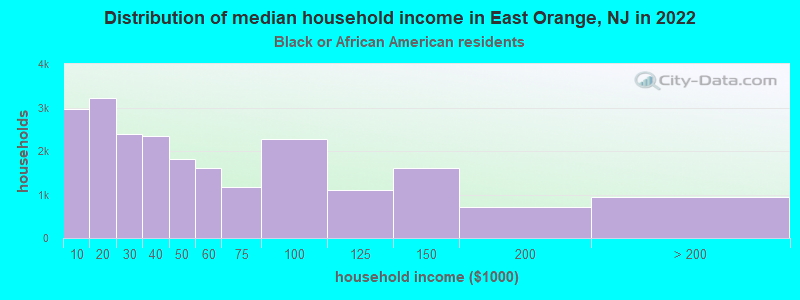
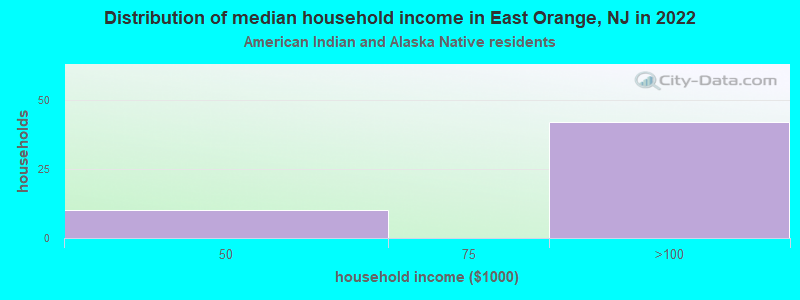
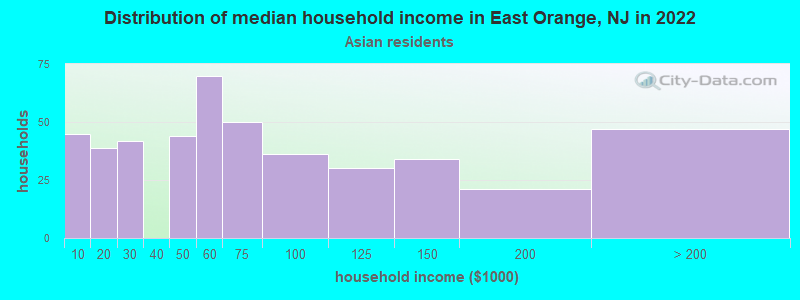
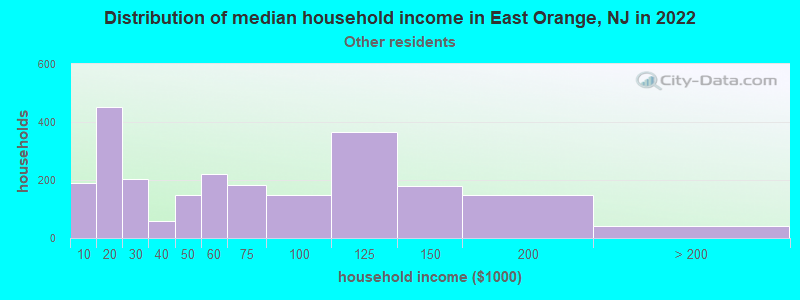
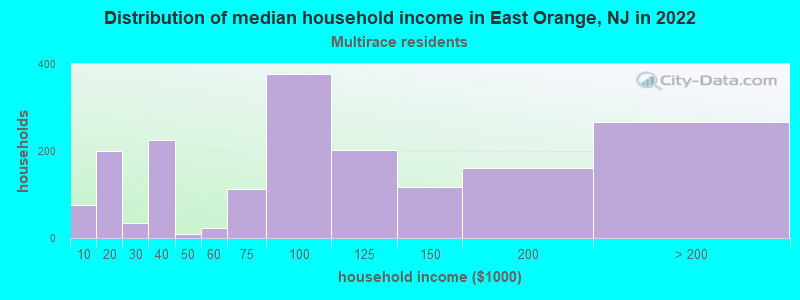
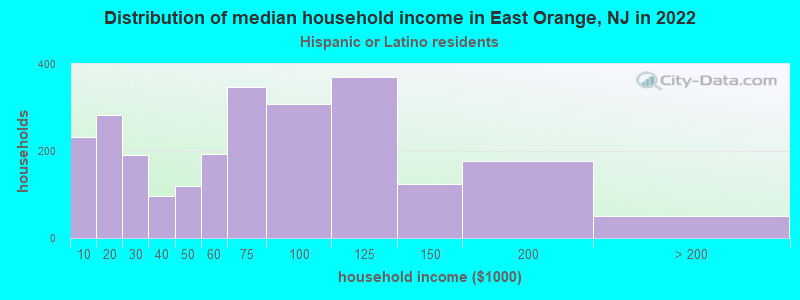
Income and house value in East Orange Median household income in 2022 $64,650 White non-Hispanic householders$42,571 Black householders$59,195 Asian householders$53,179 Some other race householders$85,584 Two or more races householders$72,352 Hispanic or Latino race householdersMedian 2022 house value $330,179 White Non-Hispanic householders$339,381 Black or African American householders$331,294 American Indian or Alaska Native householders $562,754 Asian householders$351,094 Some other race householders$329,063 Two or more races householders$423,599 Hispanic or Latino householders
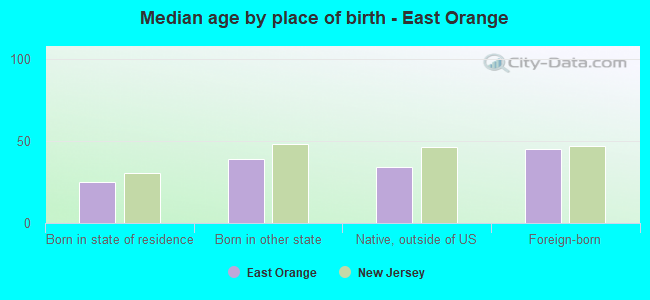
Median age by race in East Orange
56.5 Median age for White residents63.4 28.9 34.6 Median age for Black or African American residents33.5 39.3 -666,666,666.0 Median age for American Indian / Alaska Native residents-666,666,666.0 -666,666,666.0 53.3 Median age for Asian residents52.4 66.1 -666,666,666.0 Median age for Native Hawaiian / Pacific Islander residents-666,666,666.0 -666,666,666.0 39.8 Median age for Other race residents29.8 43.6 29.5 Median age for Two or more races residents34.4 29.0 59.7 Median age for White alone residents63.1 44.6 41.1 Median age for Hispanic or Latino residents32.5 43.6
Owner/renter occupied households by race in East Orange
House owners and renters - White residents 290 37.1% Owner occupied491 62.9% Renter occupiedHouse owners and renters - Black or African American residents 6,036 27.2% Owner occupied16,118 72.8% Renter occupiedHouse owners and renters - American Indian / Alaska Native residents 6 9.7% Owner occupied59 90.3% Renter occupiedHouse owners and renters - Asian residents 182 40.2% Owner occupied272 59.8% Renter occupiedHouse owners and renters - Native Hawaiian / Pacific Islander residents 10 100.0% Owner occupiedHouse owners and renters - Other race residents 209 11.6% Owner occupied1,593 88.4% Renter occupiedHouse owners and renters - Two or more races residents 1,027 49.3% Owner occupied1,056 50.7% Renter occupiedHouse owners and renters - White alone residents 184 29.0% Owner occupied451 71.0% Renter occupiedHouse owners and renters - Hispanic or Latino residents 365 21.6% Owner occupied1,326 78.4% Renter occupied
Language usage in East Orange
English speakers - Total 75.9% of residents of East Orange speak English at home.
6.0% of residents speak Spanish at home 2,301 59.3% Speak English very well1,579 40.7% Speak English less than very well18.1% of residents speak other language at home 7,781 66.6% Speak English very well3,896 33.4% Speak English less than very well
English speakers - Born in the United States 85.3% of residents of East Orange speak English at home.
5.8% of residents speak Spanish at home 691 100.0% Speak English very well9.0% of residents speak other language at home 1,071 100.0% Speak English very well
English speakers - Native, born elsewhere 55.8% of residents of East Orange speak English at home.
44.2% of residents speak Spanish at home 547 74.6% Speak English very well186 25.4% Speak English less than very well
English speakers - Foreign-born 56.8% of residents of East Orange speak English at home.
6.0% of residents speak Spanish at home 54 3.7% Speak English very well1,393 96.3% Speak English less than very well37.2% of residents speak other language at home 5,365 59.4% Speak English very well3,664 40.6% Speak English less than very well
White (Caucasian) - Speak only English Native:
88.2% (1,351)Foreign-born:
25.6% (35)
White (Caucasian) - Speak another language Native:
11.2% (172)Foreign-born:
75.7% (104)
Black or African American - Speak only English Native:
91.1% (30,626)Foreign-born:
53.2% (8,818)
Black or African American - Speak another language Native:
8.9% (2,976)Foreign-born:
46.8% (7,762)
Asian - Speak only English Native:
23.1% (77)Foreign-born:
62.5% (484)
Asian - Speak another language Native:
69.9% (233)Foreign-born:
42.0% (325)
Native Hawaiian / Pacific Islander - Speak only English Native:
85.0% (51)Foreign-born:
96.3% (15)
Other race - Speak only English Native:
33.8% (850)Foreign-born:
8.5% (330)
Other race - Speak another language Native:
66.5% (1,674)Foreign-born:
90.5% (3,531)
Two or more races - Speak only English Native:
82.0% (2,581)Foreign-born:
95.6% (4,346)
Two or more races - Speak another language Native:
18.0% (568)Foreign-born:
4.4% (202)
White alone - Speak only English Native:
97.5% (1,079)Foreign-born:
56.5% (36)
White alone - Speak another language Native:
2.9% (32)Foreign-born:
46.7% (29)
Hispanic or Latino - Speak only English Native:
35.7% (984)Foreign-born:
10.3% (166)
Hispanic or Latino - Speak another language Native:
64.3% (1,773)Foreign-born:
89.7% (1,447)
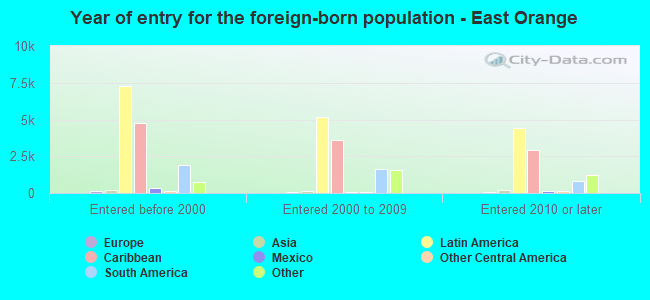
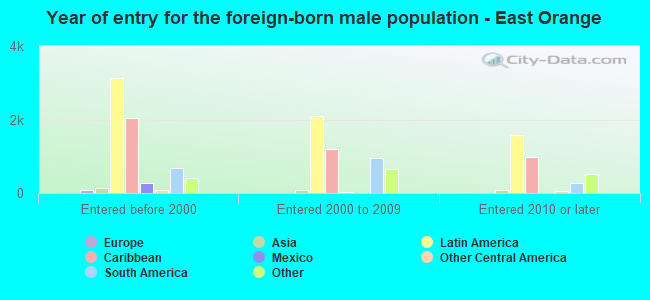
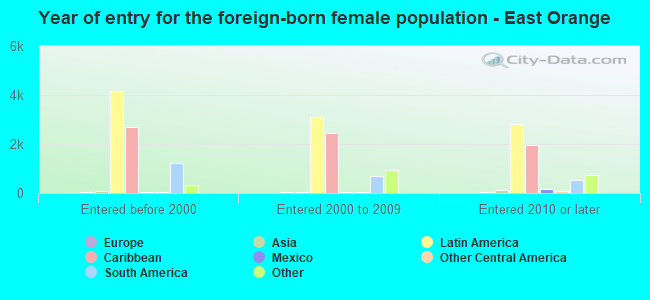
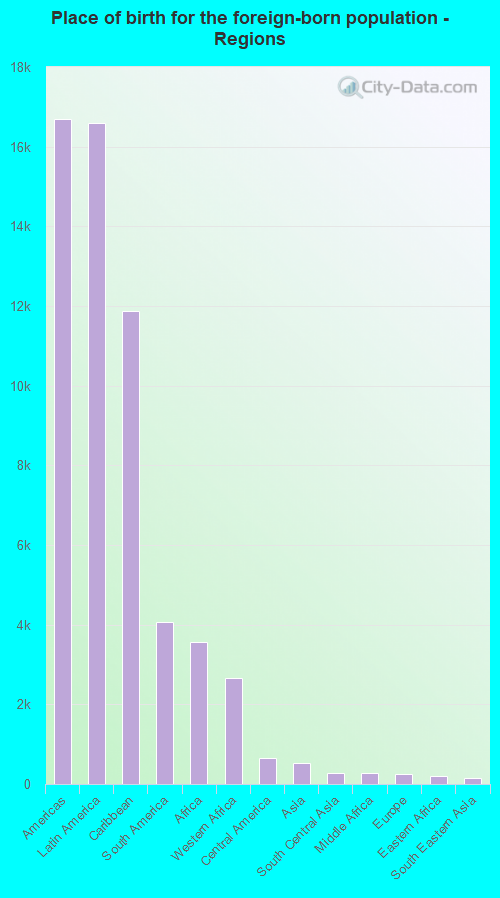
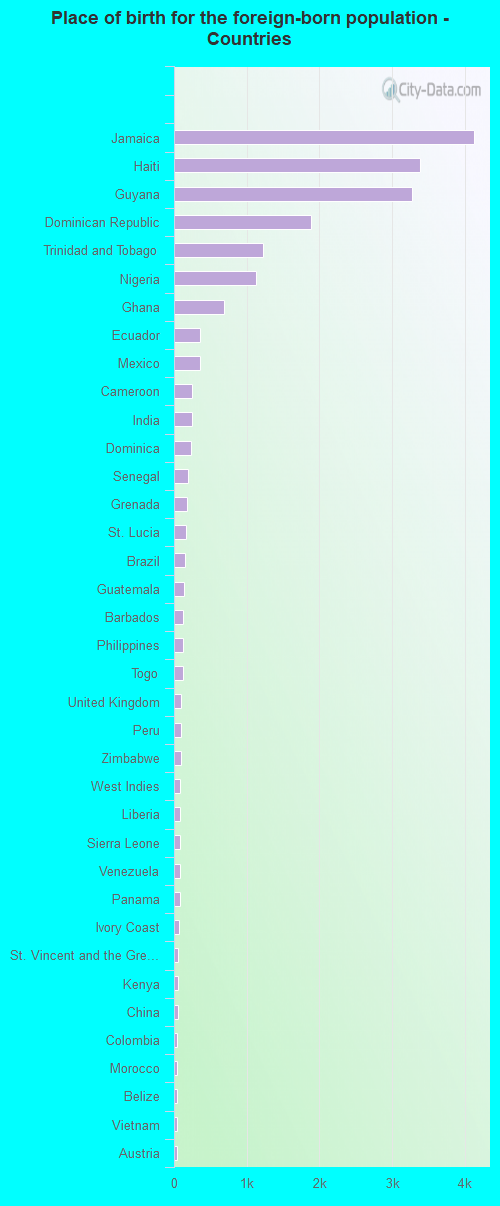
Foreign-born residents in East Orange 21,034 residents are foreign born (23.7% Latin America , 5.1% Africa ).
This city:
30.7%New Jersey:
23.2%
Marital status for residents in East Orange Marital status - White (Caucasian) population 15 years and over
Males 65.6% Never married16.4% Now married3.3% Separated8.1% Widowed6.6% DivorcedFemales 53.3% Never married27.0% Now married0.0% Separated10.1% Widowed9.6% DivorcedWomen who gave birth in the past 12 months Now married:
0.0% (0)Unmarried:
100.0% (8)
Women who did not give birth in the past 12 months Now married:
31.7% (153)Unmarried:
68.3% (331)
Marital status - Black or African American population 15 years and over
Males 56.0% Never married26.0% Now married5.3% Separated5.2% Widowed7.6% DivorcedFemales 47.5% Never married25.0% Now married4.9% Separated10.2% Widowed12.5% DivorcedWomen who gave birth in the past 12 months Now married:
100.0% (237)Unmarried:
0.0% (0)
Women who did not give birth in the past 12 months Now married:
28.2% (3,310)Unmarried:
71.8% (8,422)
Marital status - American Indian / Alaska Native population 15 years and over
Males 100.0% Never married0.0% Now married0.0% Separated0.0% Widowed0.0% DivorcedFemales 54.8% Never married30.6% Now married14.5% Separated0.0% Widowed0.0% DivorcedWomen who did not give birth in the past 12 months Now married:
100.0% (29)Unmarried:
0.0% (0)
Marital status - Asian population 15 years and over
Males 46.4% Never married39.4% Now married5.6% Separated0.0% Widowed8.6% DivorcedFemales 50.3% Never married36.0% Now married0.0% Separated7.4% Widowed6.3% DivorcedWomen who did not give birth in the past 12 months Now married:
14.8% (50)Unmarried:
85.2% (288)
Marital status - Native Hawaiian / Pacific Islander population 15 years and over
Males 83.3% Never married16.7% Now married0.0% Separated0.0% Widowed0.0% DivorcedFemales 53.3% Never married46.7% Now married0.0% Separated0.0% Widowed0.0% DivorcedWomen who did not give birth in the past 12 months Now married:
0.0% (0)Unmarried:
100.0% (8)
Marital status - Other race population 15 years and over
Males 36.2% Never married43.7% Now married4.8% Separated0.0% Widowed15.4% DivorcedFemales 36.7% Never married33.4% Now married7.6% Separated8.0% Widowed14.3% DivorcedWomen who gave birth in the past 12 months Now married:
45.6% (134)Unmarried:
54.4% (160)
Women who did not give birth in the past 12 months Now married:
45.6% (742)Unmarried:
54.4% (884)
Marital status - Two or more races population 15 years and over
Males 72.4% Never married24.4% Now married1.8% Separated1.4% Widowed0.0% DivorcedFemales 77.8% Never married15.5% Now married6.7% Separated0.0% Widowed0.0% DivorcedWomen who gave birth in the past 12 months Now married:
0.0% (0)Unmarried:
100.0% (7)
Women who did not give birth in the past 12 months Now married:
24.2% (412)Unmarried:
75.8% (1,291)
Marital status - White alone, not Hispanic / Latino population 15 years and over
Males 63.2% Never married13.0% Now married5.3% Separated9.8% Widowed8.7% DivorcedFemales 45.5% Never married27.1% Now married0.0% Separated14.1% Widowed13.3% DivorcedWomen who did not give birth in the past 12 months Now married:
37.5% (119)Unmarried:
62.5% (199)
Marital status - Hispanic or Latino population 15 years and over
Males 48.2% Never married36.7% Now married3.6% Separated1.0% Widowed10.6% DivorcedFemales 50.7% Never married27.0% Now married6.9% Separated1.9% Widowed13.5% DivorcedWomen who gave birth in the past 12 months Now married:
50.2% (105)Unmarried:
49.8% (104)
Women who did not give birth in the past 12 months Now married:
32.6% (665)Unmarried:
67.4% (1,378)
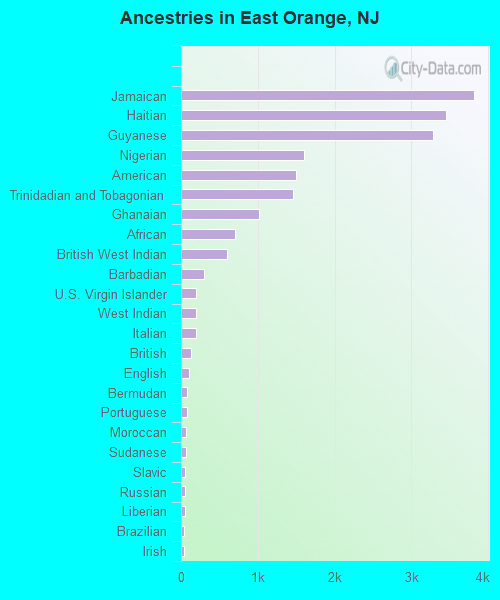
Ancestries in East Orange
3,820 7.7% Jamaican3,446 7.0% Haitian3,281 6.6% Guyanese1,603 3.2% Nigerian1,499 3.0% American1,465 3.0% Trinidadian and Tobagonian1,015 2.1% Ghanaian706 1.4% African597 1.2% British West Indian304 0.6% Barbadian201 0.4% U.S. Virgin Islander195 0.4% West Indian191 0.4% Italian124 0.3% British105 0.2% English75 0.2% Bermudan72 0.1% Portuguese71 0.1% Moroccan64 0.1% Sudanese53 0.1% Slavic52 0.1% Russian50 0.1% Liberian43 0.09% Brazilian35 0.07% Irish32 0.06% Belizean30 0.06% French30 0.06% Sierra Leonean28 0.06% Bahamian22 0.04% Ethiopian21 0.04% Arab19 0.04% South African13 0.03% Kenyan12 0.02% Eastern European12 0.02% Polish12 0.02% Cape Verdean7 0.01% Ugandan5 0.01% German
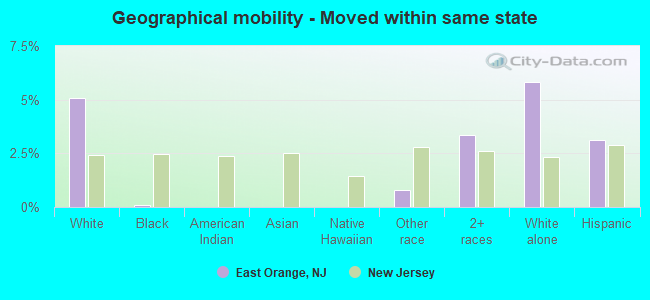
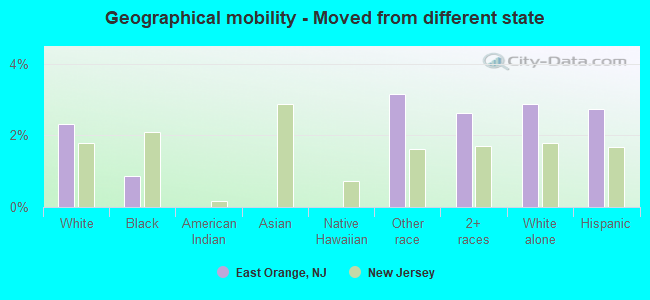
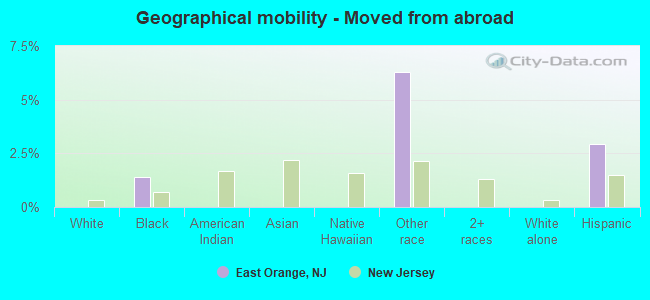
Geographical mobility in East Orange Same house 1 year ago 1,820 89.5% White (Caucasian)51,594 96.3% Black or African American158 74.0% American Indian / Alaska Native1,087 96.2% Asian75 100.0% Native Hawaiian / Pacific Islander5,205 73.7% Other race5,204 88.9% Two or more races1,426 87.4% White alone, not Hispanic / Latino5,829 75.6% Hispanic or LatinoMoved within same county 63 3.1% White / Caucasian725 1.4% Black or African American72 33.9% American Indian / Alaska Native55 4.9% Asian1,181 16.7% Other race199 3.4% Two or more races63 3.9% White alone, not Hispanic / Latino1,097 14.2% Hispanic or LatinoMoved within same state 103 5.1% White / Caucasian38 0.1% Black or African American56 0.8% Other race197 3.4% Two or more races95 5.8% White alone, not Hispanic / Latino241 3.1% Hispanic or LatinoMoved from different state 47 2.3% White / Caucasian469 0.9% Black or African American223 3.2% Other race153 2.6% Two or more races47 2.9% White alone, not Hispanic / Latino211 2.7% Hispanic or LatinoMoved from abroad 744 1.4% Black or African American444 6.3% Other race225 2.9% Hispanic or Latino
Children Nativity (place of birth) in East Orange
Children under 6 years - Living with two parents Both parents native 483 100.0% NativeBoth parents foreign-born 921 96.8% Native31 3.2% Foreign-bornOne native, one foreign-born parent 538 100.0% NativeChildren under 6 years - Living with one parent Native parent 1,672 100.0% NativeForeign-born parent 1,187 86.2% Native190 13.8% Foreign-bornChildren 6 to 17 years - Living with two parents Both parents native 790 100.0% NativeBoth parents foreign-born 1,811 81.7% Native405 18.3% Foreign-bornOne native, one foreign-born parent 942 100.0% NativeChildren 6 to 17 years - Living with one parent Native parent 2,569 100.0% NativeForeign-born parent 2,425 54.7% Native2,012 45.3% Foreign-born
Place of birth for residents in East Orange 16,697 Americas16,591 Latin America11,870 Caribbean4,065 South America3,564 Africa2,665 Western Africa654 Central America532 Asia276 South Central Asia276 Middle Africa239 Europe199 Eastern Africa160 South Eastern Asia137 Northern Europe105 Northern America88 Northern Africa75 Eastern Asia55 Western Europe52 China46 Southern Europe20 Western Asia17 Southern Africa4,124 Jamaica3,382 Haiti3,278 Guyana1,877 Dominican Republic1,230 Trinidad and Tobago1,131 Nigeria689 Ghana360 Ecuador356 Mexico245 Cameroon242 India239 Dominica190 Senegal172 Grenada161 St. Lucia148 Brazil141 Guatemala123 Barbados119 Philippines117 Togo100 United Kingdom92 Peru91 Zimbabwe85 West Indies84 Liberia84 Sierra Leone83 Venezuela80 Panama64 Ivory Coast58 St. Vincent and the Grenadines55 Kenya52 China45 Colombia45 Morocco45 Belize40 Vietnam39 Austria34 Uruguay33 Sri Lanka33 Spain32 Sudan31 Democratic Republic of Congo (Zaire)22 Korea21 England20 Israel17 South Africa17 Ethiopia16 Germany15 El Salvador15 Honduras15 Scotland12 Portugal10 Algeria8 Canada7 Uganda6 Tanzania2 Cuba1 Italy
Grandparents responsible for own grandchildren in East Orange
Grandparents (30 to 59 years) White / Caucasian 20 100.0% Not responsible for grandchildrenBlack or African American 285 37.4% Responsible for grandchildren478 62.6% Not responsible for grandchildrenAsian 7 100.0% Not responsible for grandchildrenNative Hawaiian / Pacific Islander 14 100.0% Not responsible for grandchildrenOther race 20 34.0% Responsible for grandchildren39 66.0% Not responsible for grandchildrenTwo or more races 404 100.0% Not responsible for grandchildrenWhite alone, not Hispanic / Latino 1 100.0% Not responsible for grandchildrenHispanic or Latino 108 100.0% Not responsible for grandchildrenGrandparents (60 years and over) White / Caucasian 12 100.0% Not responsible for grandchildrenBlack or African American 293 29.9% Responsible for grandchildren688 70.1% Not responsible for grandchildrenAsian 12 100.0% Not responsible for grandchildrenOther race 67 100.0% Not responsible for grandchildrenTwo or more races 71 30.4% Responsible for grandchildren162 69.6% Not responsible for grandchildrenWhite alone, not Hispanic / Latino 13 100.0% Not responsible for grandchildrenHispanic or Latino 89 100.0% Not responsible for grandchildren