Races in East Richmond Heights, California (CA) Detailed Stats
Data:
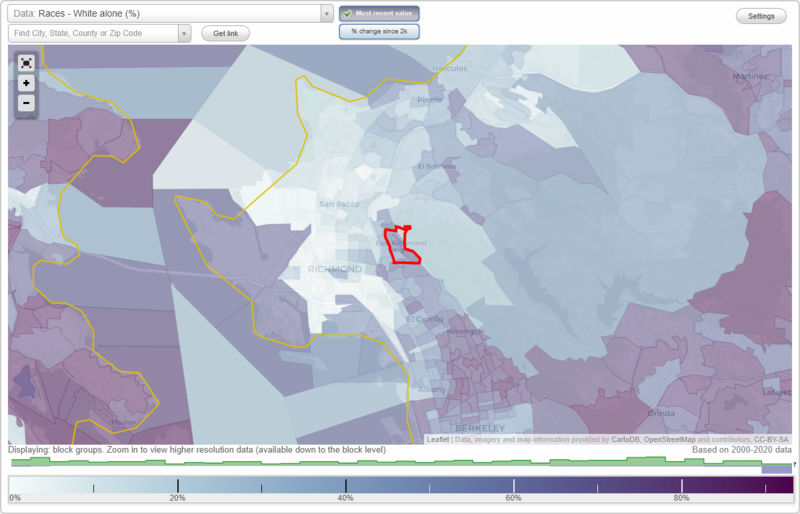
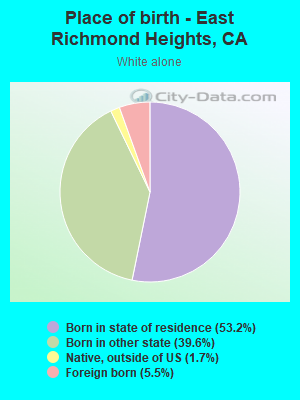
Races - White alone (%)
Races - White alone (% change since 2000)
Races - Black alone (%)
Races - Black alone (% change since 2000)
Races - American Indian alone (%)
Races - American Indian alone (% change since 2000)
Races - Asian alone (%)
Races - Asian alone (% change since 2000)
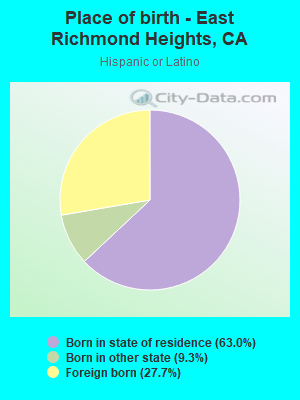
Races - Hispanic (%)
Races - Hispanic (% change since 2000)
Races - Native Hawaiian and Other Pacific Islander alone (%)
Races - Native Hawaiian and Other Pacific Islander alone (% change since 2000)
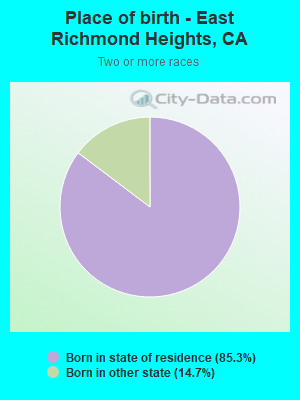
Races - Two or more races(%)
Races - Two or more races(% change since 2000)
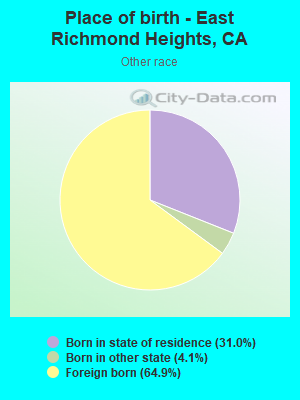
Races - Other race alone (%)
Races - Other race alone (% change since 2000)
Racial diversity
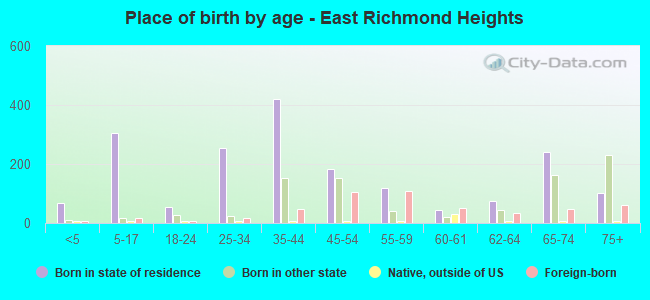
Place of birth - Born in state of residence (%)
Place of birth - Born in state of residence (%) - White
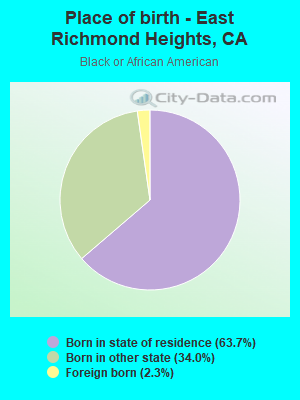
Place of birth - Born in state of residence (%) - Black or African American
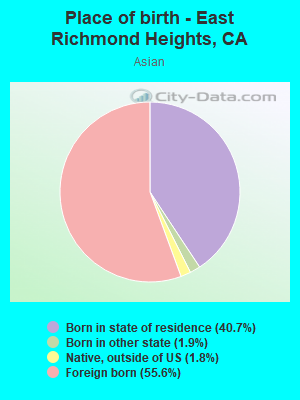
Place of birth - Born in state of residence (%) - Asian
Place of birth - Born in state of residence (%) - Hispanic or Latino
Place of birth - Born in state of residence (%) - American Indian and Alaska Native
Place of birth - Born in state of residence (%) - Multirace
Place of birth - Born in state of residence (%) - Other Race
Place of birth - Born in other state (%)
Place of birth - Born in other state (%) - White
Place of birth - Born in other state (%) - Black or African American
Place of birth - Born in other state (%) - Asian
Place of birth - Born in other state (%) - Hispanic or Latino
Place of birth - Born in other state (%) - American Indian and Alaska Native
Place of birth - Born in other state (%) - Multirace
Place of birth - Born in other state (%) - Other Race
Place of birth - Native, outside of US (%)
Place of birth - Native, outside of US (%) - White
Place of birth - Native, outside of US (%) - Black or African American
Place of birth - Native, outside of US (%) - Asian
Place of birth - Native, outside of US (%) - Hispanic or Latino
Place of birth - Native, outside of US (%) - American Indian and Alaska Native
Place of birth - Native, outside of US (%) - Multirace
Place of birth - Native, outside of US (%) - Other Race
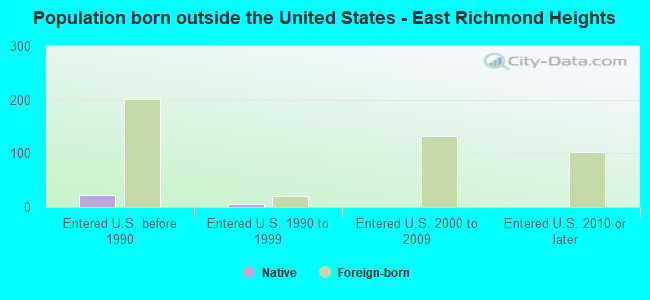
Place of birth - Foreign born (%)
Place of birth - Foreign born (%) - White
Place of birth - Foreign born (%) - Black or African American
Place of birth - Foreign born (%) - Asian
Place of birth - Foreign born (%) - Hispanic or Latino
Place of birth - Foreign born (%) - American Indian and Alaska Native
Place of birth - Foreign born (%) - Multirace
Place of birth - Foreign born (%) - Other Race
Residents speaking English at home (%)
Residents speaking English at home - Born in the United States (%)
Residents speaking English at home - Native, born elsewhere (%)
Residents speaking English at home - Foreign born (%)
Residents speaking Spanish at home (%)
Residents speaking Spanish at home - Born in the United States (%)
Residents speaking Spanish at home - Native, born elsewhere (%)
Residents speaking Spanish at home - Foreign born (%)
Residents speaking other language at home (%)
Residents speaking other language at home - Born in the United States (%)
Residents speaking other language at home - Native, born elsewhere (%)
Residents speaking other language at home - Foreign born (%)
Marital status - Never married (%)
Marital status - Now married (%)
Marital status - Separated (%)
Marital status - Widowed (%)
Marital status - Divorced (%)
Ancestries Reported - Arab (%)
Ancestries Reported - Czech (%)
Ancestries Reported - Danish (%)
Ancestries Reported - Dutch (%)
Ancestries Reported - English (%)
Ancestries Reported - French (%)
Ancestries Reported - French Canadian (%)
Ancestries Reported - German (%)
Ancestries Reported - Greek (%)
Ancestries Reported - Hungarian (%)
Ancestries Reported - Irish (%)
Ancestries Reported - Italian (%)
Ancestries Reported - Lithuanian (%)
Ancestries Reported - Norwegian (%)
Ancestries Reported - Polish (%)
Ancestries Reported - Portuguese (%)
Ancestries Reported - Russian (%)
Ancestries Reported - Scotch-Irish (%)
Ancestries Reported - Scottish (%)
Ancestries Reported - Slovak (%)
Ancestries Reported - Subsaharan African (%)
Ancestries Reported - Swedish (%)
Ancestries Reported - Swiss (%)
Ancestries Reported - Ukrainian (%)
Ancestries Reported - United States (%)
Ancestries Reported - Welsh (%)
Ancestries Reported - West Indian (%)
Ancestries Reported - Other (%)
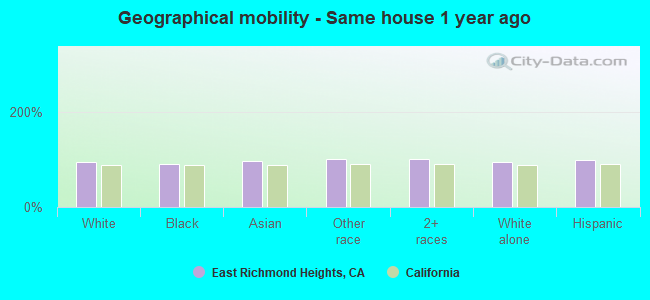
Geographical mobility - Same house 1 year ago (%)
Geographical mobility - Same house 1 year ago (%) - White
Geographical mobility - Same house 1 year ago (%) - Black or African American
Geographical mobility - Same house 1 year ago (%) - Asian
Geographical mobility - Same house 1 year ago (%) - Hispanic or Latino
Geographical mobility - Same house 1 year ago (%) - American Indian and Alaska Native
Geographical mobility - Same house 1 year ago (%) - Multirace
Geographical mobility - Same house 1 year ago (%) - Other Race
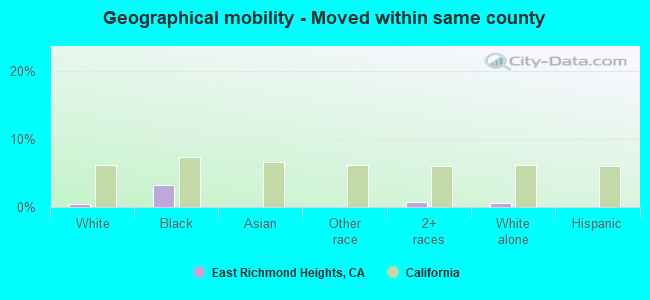
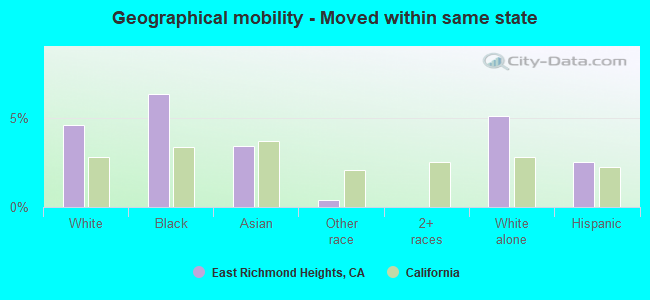
Geographical mobility - Moved within same county (%)
Geographical mobility - Moved within same county (%) - White
Geographical mobility - Moved within same county (%) - Black or African American
Geographical mobility - Moved within same county (%) - Asian
Geographical mobility - Moved within same county (%) - Hispanic or Latino
Geographical mobility - Moved within same county (%) - American Indian and Alaska Native
Geographical mobility - Moved within same county (%) - Multirace
Geographical mobility - Moved within same county (%) - Other Race
Geographical mobility - Moved from different county within same state (%)
Geographical mobility - Moved from different county within same state (%) - White
Geographical mobility - Moved from different county within same state (%) - Black or African American
Geographical mobility - Moved from different county within same state (%) - Asian
Geographical mobility - Moved from different county within same state (%) - Hispanic or Latino
Geographical mobility - Moved from different county within same state (%) - American Indian and Alaska Native
Geographical mobility - Moved from different county within same state (%) - Multirace
Geographical mobility - Moved from different county within same state (%) - Other Race
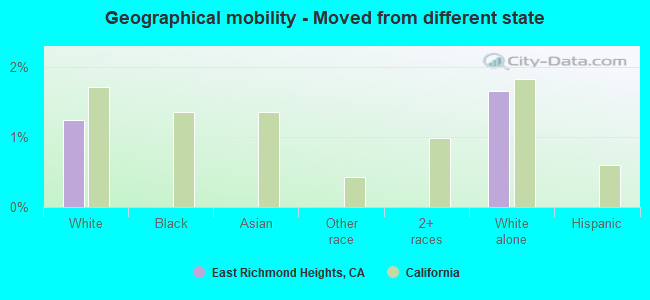
Geographical mobility - Moved from different state (%)
Geographical mobility - Moved from different state (%) - White
Geographical mobility - Moved from different state (%) - Black or African American
Geographical mobility - Moved from different state (%) - Asian
Geographical mobility - Moved from different state (%) - Hispanic or Latino
Geographical mobility - Moved from different state (%) - American Indian and Alaska Native
Geographical mobility - Moved from different state (%) - Multirace
Geographical mobility - Moved from different state (%) - Other Race
Geographical mobility - Moved from abroad (%)
Geographical mobility - Moved from abroad (%) - White
Geographical mobility - Moved from abroad (%) - Black or African American
Geographical mobility - Moved from abroad (%) - Asian
Geographical mobility - Moved from abroad (%) - Hispanic or Latino
Geographical mobility - Moved from abroad (%) - American Indian and Alaska Native
Geographical mobility - Moved from abroad (%) - Multirace
Geographical mobility - Moved from abroad (%) - Other Race
Place of birth for the foreign-born population - Ireland (%)
Place of birth for the foreign-born population - Denmark (%)
Place of birth for the foreign-born population - Norway (%)
Place of birth for the foreign-born population - Sweden (%)
Place of birth for the foreign-born population - United Kingdom (%)
Place of birth for the foreign-born population - England (%)
Place of birth for the foreign-born population - Scotland (%)
Place of birth for the foreign-born population - Other Northern Europe (%)
Place of birth for the foreign-born population - Austria (%)
Place of birth for the foreign-born population - Belgium (%)
Place of birth for the foreign-born population - France (%)
Place of birth for the foreign-born population - Germany (%)
Place of birth for the foreign-born population - Netherlands (%)
Place of birth for the foreign-born population - Switzerland (%)
Place of birth for the foreign-born population - Other Western Europe (%)
Place of birth for the foreign-born population - Greece (%)
Place of birth for the foreign-born population - Italy (%)
Place of birth for the foreign-born population - Portugal (%)
Place of birth for the foreign-born population - Spain (%)
Place of birth for the foreign-born population - Other Southern Europe (%)
Place of birth for the foreign-born population - Albania (%)
Place of birth for the foreign-born population - Belarus (%)
Place of birth for the foreign-born population - Bosnia and Herzegovina (%)
Place of birth for the foreign-born population - Bulgaria (%)
Place of birth for the foreign-born population - Croatia (%)
Place of birth for the foreign-born population - Czechoslovakia (%)
Place of birth for the foreign-born population - Hungary (%)
Place of birth for the foreign-born population - Latvia (%)
Place of birth for the foreign-born population - Lithuania (%)
Place of birth for the foreign-born population - North Macedonia (Macedonia) (%)
Place of birth for the foreign-born population - Moldova (%)
Place of birth for the foreign-born population - Poland (%)
Place of birth for the foreign-born population - Romania (%)
Place of birth for the foreign-born population - Russia (%)
Place of birth for the foreign-born population - Serbia (%)
Place of birth for the foreign-born population - Ukraine (%)
Place of birth for the foreign-born population - Other Eastern Europe (%)
Place of birth for the foreign-born population - China (%)
Place of birth for the foreign-born population - Hong Kong (%)
Place of birth for the foreign-born population - Taiwan (%)
Place of birth for the foreign-born population - Japan (%)
Place of birth for the foreign-born population - Korea (%)
Place of birth for the foreign-born population - Other Eastern Asia (%)
Place of birth for the foreign-born population - Afghanistan (%)
Place of birth for the foreign-born population - Bangladesh (%)
Place of birth for the foreign-born population - India (%)
Place of birth for the foreign-born population - Iran (%)
Place of birth for the foreign-born population - Kazakhstan (%)
Place of birth for the foreign-born population - Nepal (%)
Place of birth for the foreign-born population - Pakistan (%)
Place of birth for the foreign-born population - Sri Lanka (%)
Place of birth for the foreign-born population - Uzbekistan (%)
Place of birth for the foreign-born population - Other South Central Asia (%)
Place of birth for the foreign-born population - Burma (%)
Place of birth for the foreign-born population - Cambodia (%)
Place of birth for the foreign-born population - Indonesia (%)
Place of birth for the foreign-born population - Laos (%)
Place of birth for the foreign-born population - Malaysia (%)
Place of birth for the foreign-born population - Philippines (%)
Place of birth for the foreign-born population - Singapore (%)
Place of birth for the foreign-born population - Thailand (%)
Place of birth for the foreign-born population - Vietnam (%)
Place of birth for the foreign-born population - Other South Eastern Asia (%)
Place of birth for the foreign-born population - Armenia (%)
Place of birth for the foreign-born population - Iraq (%)
Place of birth for the foreign-born population - Israel (%)
Place of birth for the foreign-born population - Jordan (%)
Place of birth for the foreign-born population - Kuwait (%)
Place of birth for the foreign-born population - Lebanon (%)
Place of birth for the foreign-born population - Saudi Arabia (%)
Place of birth for the foreign-born population - Syria (%)
Place of birth for the foreign-born population - Turkey (%)
Place of birth for the foreign-born population - Yemen (%)
Place of birth for the foreign-born population - Other Western Asia (%)
Place of birth for the foreign-born population - Eritrea (%)
Place of birth for the foreign-born population - Ethiopia (%)
Place of birth for the foreign-born population - Kenya (%)
Place of birth for the foreign-born population - Somalia (%)
Place of birth for the foreign-born population - Uganda (%)
Place of birth for the foreign-born population - Zimbabwe (%)
Place of birth for the foreign-born population - Other Eastern Africa (%)
Place of birth for the foreign-born population - Cameroon (%)
Place of birth for the foreign-born population - Congo (%)
Place of birth for the foreign-born population - Democratic Republic of Congo (Zaire) (%)
Place of birth for the foreign-born population - Other Middle Africa (%)
Place of birth for the foreign-born population - Egypt (%)
Place of birth for the foreign-born population - Morocco (%)
Place of birth for the foreign-born population - Sudan (%)
Place of birth for the foreign-born population - Other Northern Africa (%)
Place of birth for the foreign-born population - South Africa (%)
Place of birth for the foreign-born population - Other Southern Africa (%)
Place of birth for the foreign-born population - Cabo Verde (%)
Place of birth for the foreign-born population - Ghana (%)
Place of birth for the foreign-born population - Liberia (%)
Place of birth for the foreign-born population - Nigeria (%)
Place of birth for the foreign-born population - Senegal (%)
Place of birth for the foreign-born population - Sierra Leone (%)
Place of birth for the foreign-born population - Other Western Africa (%)
Place of birth for the foreign-born population - Australia (%)
Place of birth for the foreign-born population - New Zealand (%)
Place of birth for the foreign-born population - Fiji (%)
Place of birth for the foreign-born population - Micronesia (%)
Place of birth for the foreign-born population - Bahamas (%)
Place of birth for the foreign-born population - Barbados (%)
Place of birth for the foreign-born population - Cuba (%)
Place of birth for the foreign-born population - Dominica (%)
Place of birth for the foreign-born population - Dominican Republic (%)
Place of birth for the foreign-born population - Grenada (%)
Place of birth for the foreign-born population - Haiti (%)
Place of birth for the foreign-born population - Jamaica (%)
Place of birth for the foreign-born population - St. Vincent and the Grenadines (%)
Place of birth for the foreign-born population - Trinidad and Tobago (%)
Place of birth for the foreign-born population - West Indies (%)
Place of birth for the foreign-born population - Other Caribbean (%)
Place of birth for the foreign-born population - Belize (%)
Place of birth for the foreign-born population - Costa Rica (%)
Place of birth for the foreign-born population - El Salvador (%)
Place of birth for the foreign-born population - Guatemala (%)
Place of birth for the foreign-born population - Honduras (%)
Place of birth for the foreign-born population - Mexico (%)
Place of birth for the foreign-born population - Nicaragua (%)
Place of birth for the foreign-born population - Panama (%)
Place of birth for the foreign-born population - Other Central America (%)
Place of birth for the foreign-born population - Argentina (%)
Place of birth for the foreign-born population - Bolivia (%)
Place of birth for the foreign-born population - Brazil (%)
Place of birth for the foreign-born population - Chile (%)
Place of birth for the foreign-born population - Colombia (%)
Place of birth for the foreign-born population - Ecuador (%)
Place of birth for the foreign-born population - Guyana (%)
Place of birth for the foreign-born population - Peru (%)
Place of birth for the foreign-born population - Uruguay (%)
Place of birth for the foreign-born population - Venezuela (%)
Place of birth for the foreign-born population - Other South America (%)
Place of birth for the foreign-born population - Canada (%)
Place of birth for the foreign-born population - Other Northern America (%)
Place of birth for the foreign-born population - Other (%)
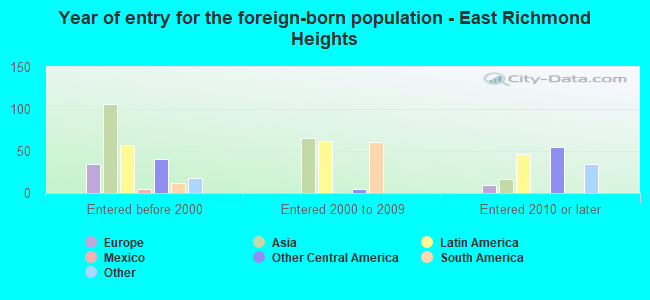
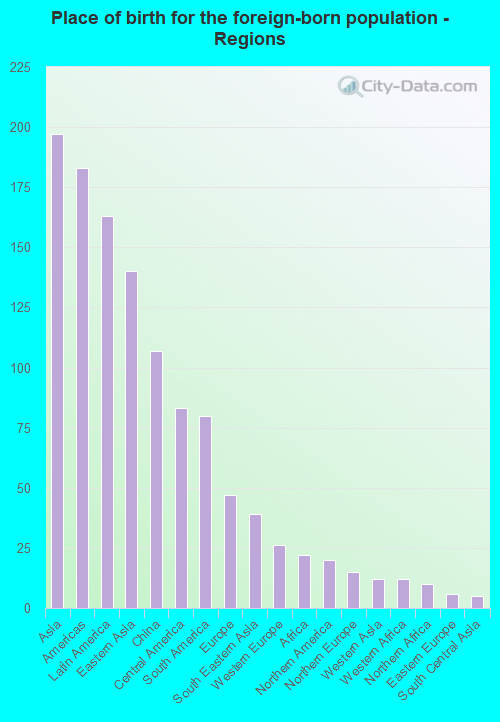
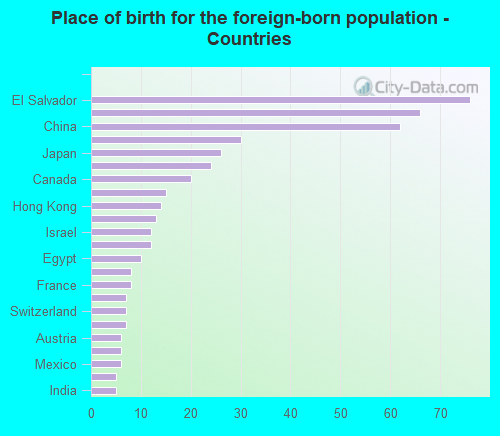
According to 2022 data, the most numerous races in East Richmond Heights, CA are Hispanic (530 residents), White alone (1,554 residents), and Asian alone (355 residents). 82.7% of East Richmond Heights residents speak English at home. 14.1% of East Richmond Heights, CA residents are foreign-born (6.2% born in Asia, 5.1% born in Latin America, 1.5% born in Europe), which is 84.8% less than the foreign-born rate of 26.0% across the entire state of California.
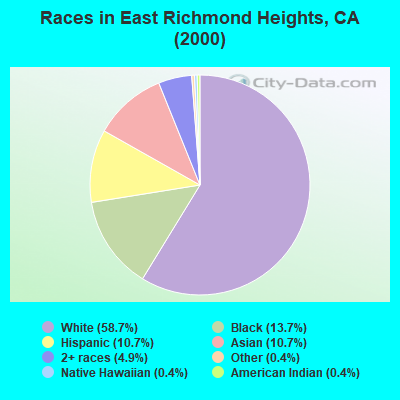
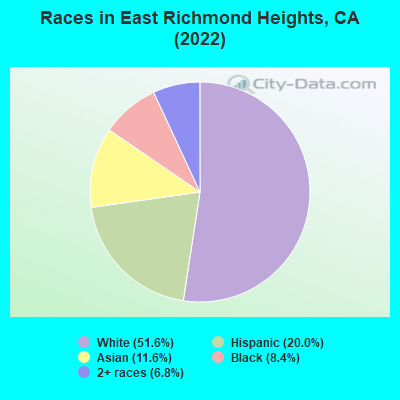
Race distribution in East Richmond Heights
2000 2022
15,816,790 46.7% White alone 10,966,556 32.4% Hispanic 3,648,860 10.8% Asian alone 2,181,926 6.4% Black alone 903,115 2.7% Two or more races 178,984 0.5% American Indian alone 103,736 0.3% Native Hawaiian and Other 71,681 0.2% Other race alone
15,732,184 40.3% Hispanic 13,160,426 33.7% White alone 5,957,867 15.3% Asian alone 2,025,218 5.2% Black alone 1,663,222 4.3% Two or more races 251,618 0.6% Other race alone 135,777 0.3% Native Hawaiian and Other 103,030 0.3% American Indian alone
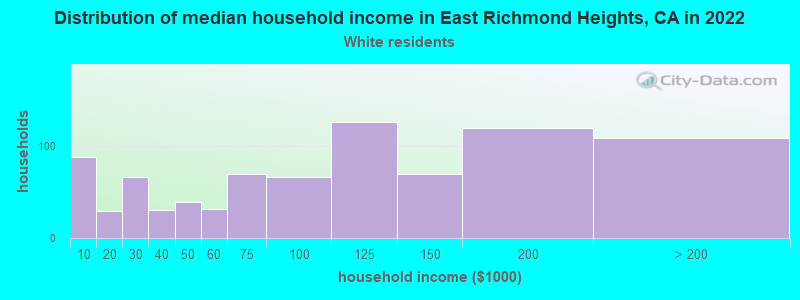
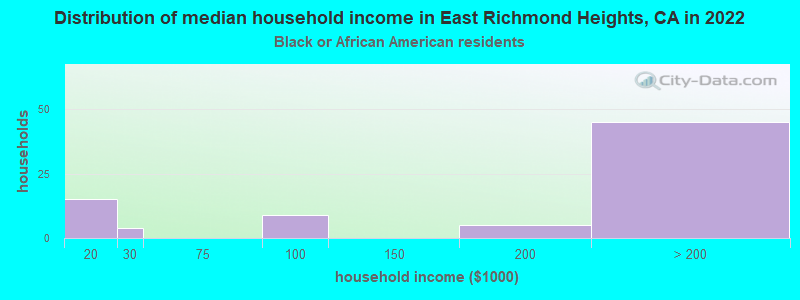
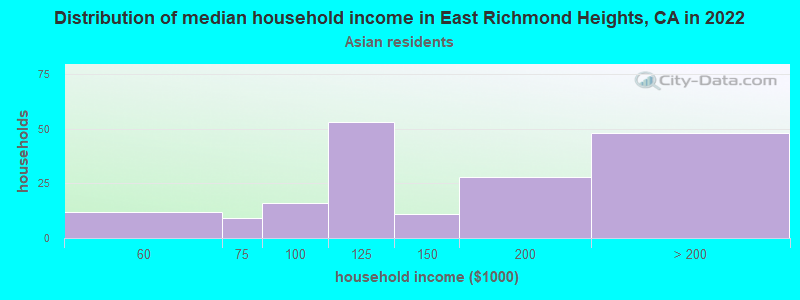
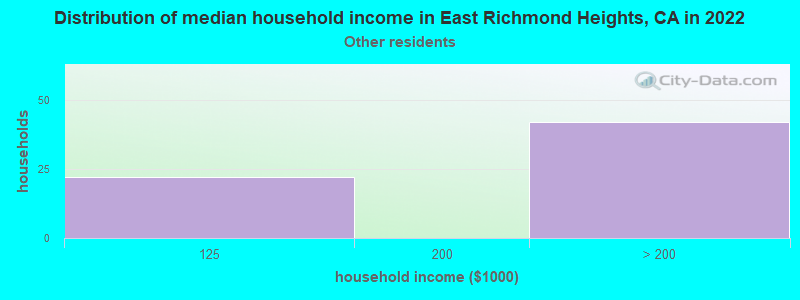
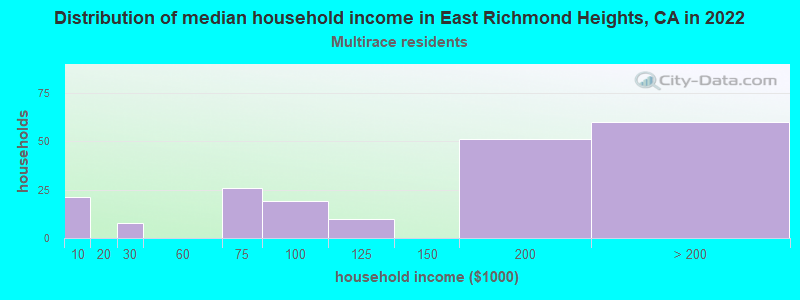
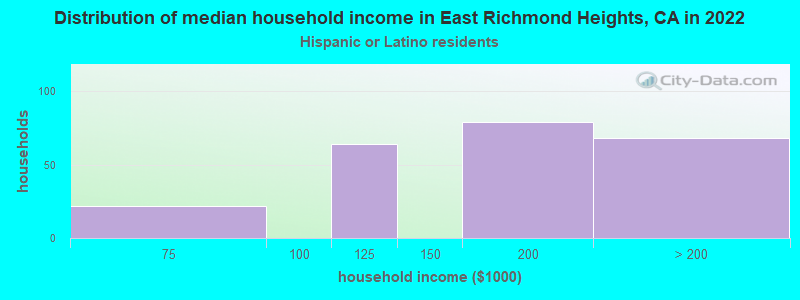
Income and house value in East Richmond Heights Median household income in 2022 $140,059 White non-Hispanic householders$79,801 Black householders$86,981 Asian householders$105,710 Native Hawaiian and other Pacific Islander householders$121,924 Some other race householders$109,688 Two or more races householdersover $200,000 Hispanic or Latino race householdersMedian 2022 house value $797,604 White Non-Hispanic householders$831,797 Black or African American householders $861,671 Asian householders$809,841 Some other race householders$842,595 Two or more races householders$702,582 Hispanic or Latino householders
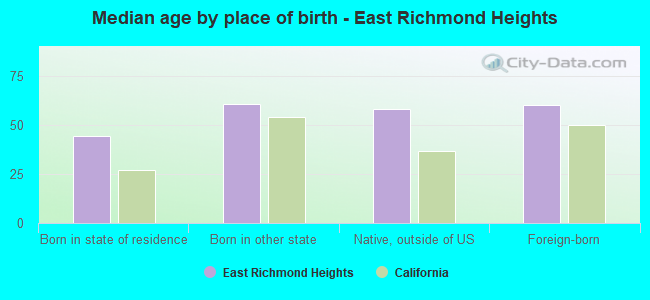
Median age by race in East Richmond Heights
55.8 Median age for White residents53.5 59.8 55.0 Median age for Black or African American residents57.3 54.1 56.3 Median age for American Indian / Alaska Native residents59.3 Median age for Asian residents60.9 54.7 53.2 Median age for Other race residents35.1 52.8 32.7 Median age for Two or more races residents80.9 11.5 53.0 Median age for White alone residents50.7 56.3 45.9 Median age for Hispanic or Latino residents47.0 43.7
Owner/renter occupied households by race in East Richmond Heights
House owners and renters - White residents 643 81.5% Owner occupied146 18.5% Renter occupiedHouse owners and renters - Black or African American residents 160 84.6% Owner occupied29 15.4% Renter occupiedHouse owners and renters - Asian residents 143 100.0% Owner occupiedHouse owners and renters - Other race residents 46 52.5% Owner occupied42 47.5% Renter occupiedHouse owners and renters - Two or more races residents 145 60.4% Owner occupied95 39.6% Renter occupiedHouse owners and renters - White alone residents 622 80.2% Owner occupied154 19.8% Renter occupiedHouse owners and renters - Hispanic or Latino residents 170 74.8% Owner occupied57 25.2% Renter occupied
Language usage in East Richmond Heights
English speakers - Total 82.7% of residents of East Richmond Heights speak English at home.
7.1% of residents speak Spanish at home 111 50.2% Speak English very well110 49.8% Speak English less than very well10.6% of residents speak other language at home 246 75.0% Speak English very well82 25.0% Speak English less than very well
English speakers - Born in the United States 95.0% of residents of East Richmond Heights speak English at home.
2.5% of residents speak Spanish at home 22 100.0% Speak English very well2.4% of residents speak other language at home 21 100.0% Speak English very well
English speakers - Native, born elsewhere 82.4% of residents of East Richmond Heights speak English at home.
17.6% of residents speak other language at home 6 100.0% Speak English less than very well
English speakers - Foreign-born 27.3% of residents of East Richmond Heights speak English at home.
29.1% of residents speak Spanish at home 21 16.4% Speak English very well107 83.6% Speak English less than very well45.2% of residents speak other language at home 132 66.3% Speak English very well67 33.7% Speak English less than very well
White (Caucasian) - Speak only English Native:
100.0% (1,410)Foreign-born:
70.9% (40)
White (Caucasian) - Speak another language Native:
3.9% (55)Foreign-born:
50.5% (28)
Black or African American - Speak only English Native:
100.0% (499)Foreign-born:
99.6% (11)
Asian - Speak only English Native:
63.2% (111)Foreign-born:
30.7% (65)
Asian - Speak another language Native:
36.9% (65)Foreign-born:
72.4% (153)
Other race - Speak only English Native:
36.5% (35)Foreign-born:
2.6% (5)
Other race - Speak another language Native:
63.4% (60)Foreign-born:
96.5% (195)
White alone - Speak only English Native:
96.0% (1,350)Foreign-born:
39.4% (37)
White alone - Speak another language Native:
4.0% (56)Foreign-born:
60.3% (56)
Hispanic or Latino - Speak only English Native:
74.2% (269)Foreign-born:
8.8% (13)
Hispanic or Latino - Speak another language Native:
25.8% (93)Foreign-born:
91.7% (135)
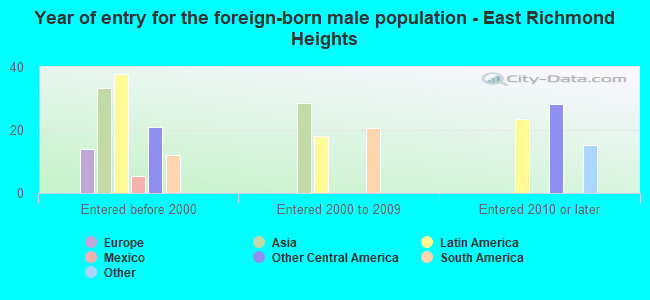
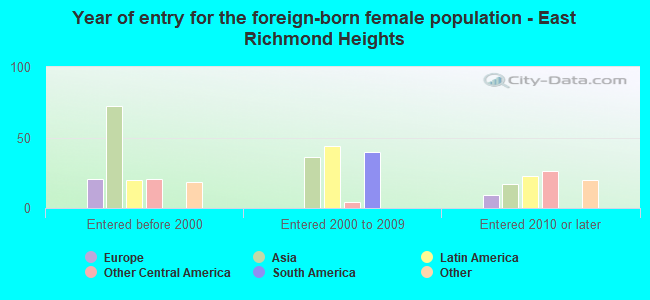
Foreign-born residents in East Richmond Heights 450 residents are foreign born (6.2% Asia , 5.1% Latin America , 1.5% Europe ).
This city:
14.1%California:
100.0%
Marital status for residents in East Richmond Heights Marital status - White (Caucasian) population 15 years and over
Males 15.3% Never married64.8% Now married3.2% Separated2.2% Widowed14.4% DivorcedFemales 19.8% Never married48.8% Now married0.0% Separated10.8% Widowed20.7% DivorcedWomen who gave birth in the past 12 months Now married:
100.0% (4)Unmarried:
0.0% (0)
Women who did not give birth in the past 12 months Now married:
55.4% (160)Unmarried:
44.6% (129)
Marital status - Black or African American population 15 years and over
Males 10.2% Never married62.1% Now married0.0% Separated17.0% Widowed10.7% DivorcedFemales 49.8% Never married22.6% Now married0.0% Separated21.3% Widowed6.3% DivorcedWomen who did not give birth in the past 12 months Now married:
14.1% (18)Unmarried:
85.9% (110)
Marital status - Asian population 15 years and over
Males 23.9% Never married70.7% Now married0.0% Separated0.0% Widowed5.4% DivorcedFemales 9.6% Never married58.4% Now married2.3% Separated15.5% Widowed14.2% DivorcedWomen who did not give birth in the past 12 months Now married:
77.5% (67)Unmarried:
22.5% (20)
Marital status - Other race population 15 years and over
Males 59.5% Never married40.5% Now married0.0% Separated0.0% Widowed0.0% DivorcedFemales 17.0% Never married30.0% Now married0.0% Separated31.0% Widowed22.0% DivorcedWomen who did not give birth in the past 12 months Now married:
0.0% (0)Unmarried:
100.0% (37)
Marital status - Two or more races population 15 years and over
Males 41.1% Never married58.9% Now married0.0% Separated0.0% Widowed0.0% DivorcedFemales 33.3% Never married0.0% Now married0.0% Separated11.8% Widowed54.9% DivorcedWomen who did not give birth in the past 12 months Now married:
0.0% (0)Unmarried:
100.0% (45)
Marital status - White alone, not Hispanic / Latino population 15 years and over
Males 15.5% Never married64.4% Now married3.5% Separated1.2% Widowed15.5% DivorcedFemales 19.0% Never married47.7% Now married0.0% Separated12.5% Widowed20.8% DivorcedWomen who gave birth in the past 12 months Now married:
100.0% (5)Unmarried:
0.0% (0)
Women who did not give birth in the past 12 months Now married:
50.3% (136)Unmarried:
49.7% (135)
Marital status - Hispanic or Latino population 15 years and over
Males 47.8% Never married46.3% Now married0.0% Separated5.9% Widowed0.0% DivorcedFemales 18.1% Never married38.4% Now married0.0% Separated15.5% Widowed28.0% DivorcedWomen who did not give birth in the past 12 months Now married:
56.5% (77)Unmarried:
43.5% (59)
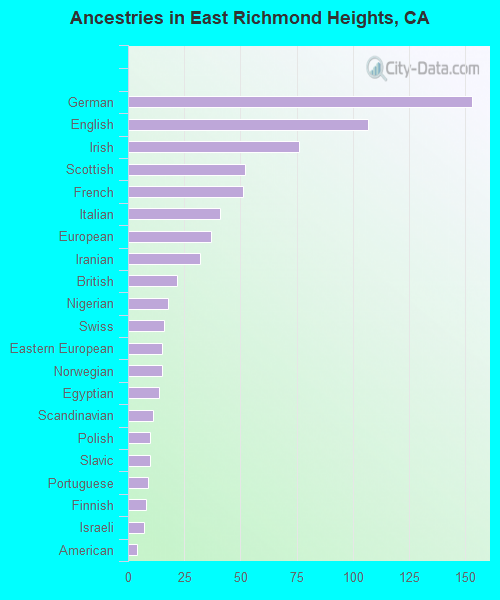
Ancestries in East Richmond Heights
156 11.0% European49 3.5% American48 3.4% Irish33 2.3% German33 2.3% Italian18 1.3% Nigerian16 1.1% Brazilian16 1.1% English15 1.1% Eastern European15 1.1% Norwegian14 1.0% French12 0.8% Egyptian12 0.8% Israeli11 0.8% British11 0.8% Russian11 0.8% Swiss9 0.6% Scottish8 0.6% Scandinavian5 0.4% Finnish5 0.4% Hungarian2 0.1% Scotch-Irish
Children Nativity (place of birth) in East Richmond Heights
Children under 6 years - Living with two parents Both parents native 99 100.0% NativeOne native, one foreign-born parent 11 100.0% NativeChildren under 6 years - Living with one parent Native parent 1 81.8% NativeForeign-born parent 4 100.0% NativeChildren 6 to 17 years - Living with two parents Both parents native 126 100.0% NativeBoth parents foreign-born 45 100.0% NativeOne native, one foreign-born parent 37 100.0% NativeChildren 6 to 17 years - Living with one parent Native parent 70 80.9% Native17 19.1% Foreign-bornForeign-born parent 5 100.0% Native
Grandparents responsible for own grandchildren in East Richmond Heights
Grandparents (30 to 59 years) Other race 8 100.0% Not responsible for grandchildrenHispanic or Latino 7 100.0% Not responsible for grandchildren
Grandparents (60 years and over) Other race 30 100.0% Not responsible for grandchildrenHispanic or Latino 32 100.0% Not responsible for grandchildren