Races in Easton, Pennsylvania (PA) Detailed Stats
Data:
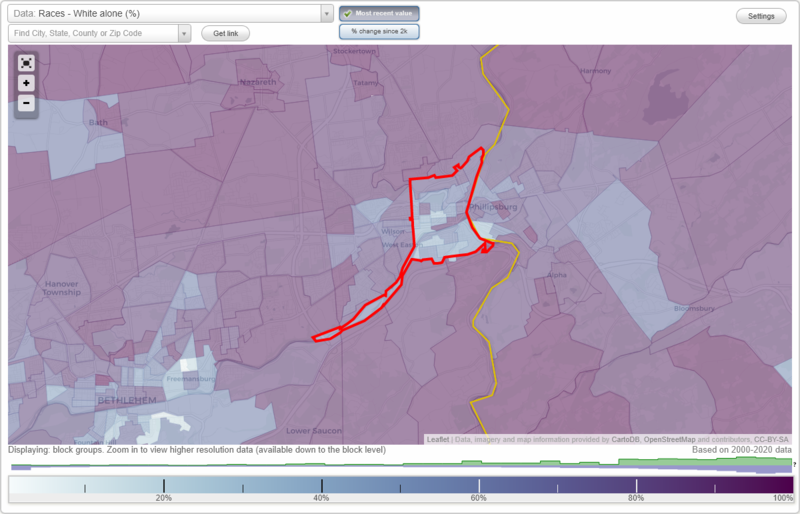
Races - White alone (%)
Races - White alone (% change since 2000)
Races - Black alone (%)
Races - Black alone (% change since 2000)
Races - American Indian alone (%)
Races - American Indian alone (% change since 2000)
Races - Asian alone (%)
Races - Asian alone (% change since 2000)
Races - Hispanic (%)
Races - Hispanic (% change since 2000)
Races - Native Hawaiian and Other Pacific Islander alone (%)
Races - Native Hawaiian and Other Pacific Islander alone (% change since 2000)
Races - Two or more races(%)
Races - Two or more races(% change since 2000)
Races - Other race alone (%)
Races - Other race alone (% change since 2000)
Racial diversity
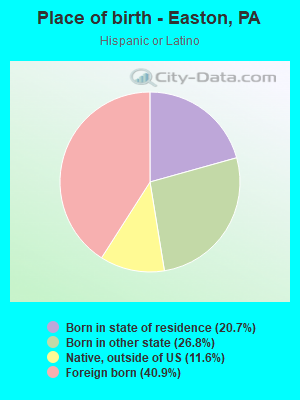
Place of birth - Born in state of residence (%)
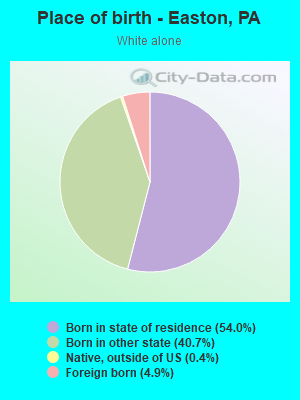
Place of birth - Born in state of residence (%) - White
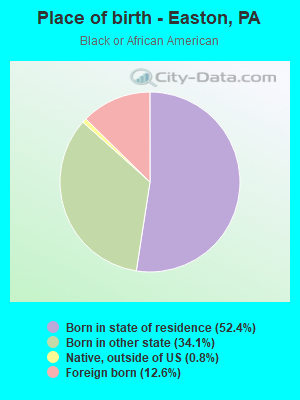
Place of birth - Born in state of residence (%) - Black or African American
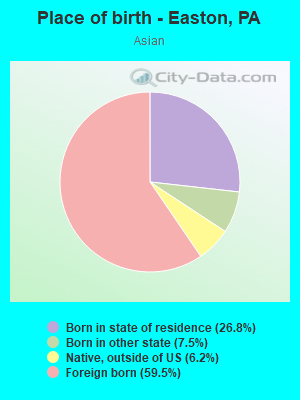
Place of birth - Born in state of residence (%) - Asian
Place of birth - Born in state of residence (%) - Hispanic or Latino
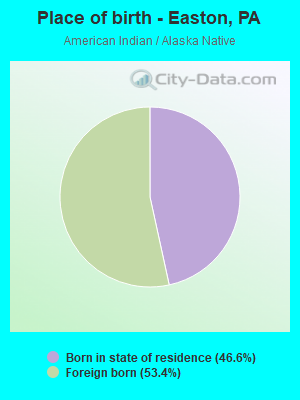
Place of birth - Born in state of residence (%) - American Indian and Alaska Native
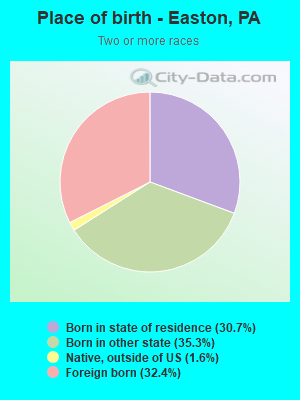
Place of birth - Born in state of residence (%) - Multirace
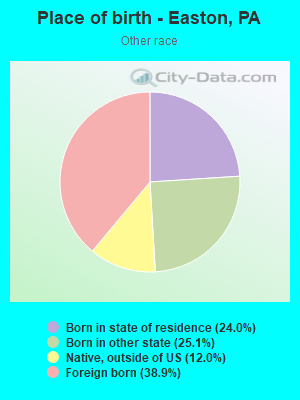
Place of birth - Born in state of residence (%) - Other Race
Place of birth - Born in other state (%)
Place of birth - Born in other state (%) - White
Place of birth - Born in other state (%) - Black or African American
Place of birth - Born in other state (%) - Asian
Place of birth - Born in other state (%) - Hispanic or Latino
Place of birth - Born in other state (%) - American Indian and Alaska Native
Place of birth - Born in other state (%) - Multirace
Place of birth - Born in other state (%) - Other Race
Place of birth - Native, outside of US (%)
Place of birth - Native, outside of US (%) - White
Place of birth - Native, outside of US (%) - Black or African American
Place of birth - Native, outside of US (%) - Asian
Place of birth - Native, outside of US (%) - Hispanic or Latino
Place of birth - Native, outside of US (%) - American Indian and Alaska Native
Place of birth - Native, outside of US (%) - Multirace
Place of birth - Native, outside of US (%) - Other Race
Place of birth - Foreign born (%)
Place of birth - Foreign born (%) - White
Place of birth - Foreign born (%) - Black or African American
Place of birth - Foreign born (%) - Asian
Place of birth - Foreign born (%) - Hispanic or Latino
Place of birth - Foreign born (%) - American Indian and Alaska Native
Place of birth - Foreign born (%) - Multirace
Place of birth - Foreign born (%) - Other Race
Residents speaking English at home (%)
Residents speaking English at home - Born in the United States (%)
Residents speaking English at home - Native, born elsewhere (%)
Residents speaking English at home - Foreign born (%)
Residents speaking Spanish at home (%)
Residents speaking Spanish at home - Born in the United States (%)
Residents speaking Spanish at home - Native, born elsewhere (%)
Residents speaking Spanish at home - Foreign born (%)
Residents speaking other language at home (%)
Residents speaking other language at home - Born in the United States (%)
Residents speaking other language at home - Native, born elsewhere (%)
Residents speaking other language at home - Foreign born (%)
Marital status - Never married (%)
Marital status - Now married (%)
Marital status - Separated (%)
Marital status - Widowed (%)
Marital status - Divorced (%)
Ancestries Reported - Arab (%)
Ancestries Reported - Czech (%)
Ancestries Reported - Danish (%)
Ancestries Reported - Dutch (%)
Ancestries Reported - English (%)
Ancestries Reported - French (%)
Ancestries Reported - French Canadian (%)
Ancestries Reported - German (%)
Ancestries Reported - Greek (%)
Ancestries Reported - Hungarian (%)
Ancestries Reported - Irish (%)
Ancestries Reported - Italian (%)
Ancestries Reported - Lithuanian (%)
Ancestries Reported - Norwegian (%)
Ancestries Reported - Polish (%)
Ancestries Reported - Portuguese (%)
Ancestries Reported - Russian (%)
Ancestries Reported - Scotch-Irish (%)
Ancestries Reported - Scottish (%)
Ancestries Reported - Slovak (%)
Ancestries Reported - Subsaharan African (%)
Ancestries Reported - Swedish (%)
Ancestries Reported - Swiss (%)
Ancestries Reported - Ukrainian (%)
Ancestries Reported - United States (%)
Ancestries Reported - Welsh (%)
Ancestries Reported - West Indian (%)
Ancestries Reported - Other (%)
Geographical mobility - Same house 1 year ago (%)
Geographical mobility - Same house 1 year ago (%) - White
Geographical mobility - Same house 1 year ago (%) - Black or African American
Geographical mobility - Same house 1 year ago (%) - Asian
Geographical mobility - Same house 1 year ago (%) - Hispanic or Latino
Geographical mobility - Same house 1 year ago (%) - American Indian and Alaska Native
Geographical mobility - Same house 1 year ago (%) - Multirace
Geographical mobility - Same house 1 year ago (%) - Other Race
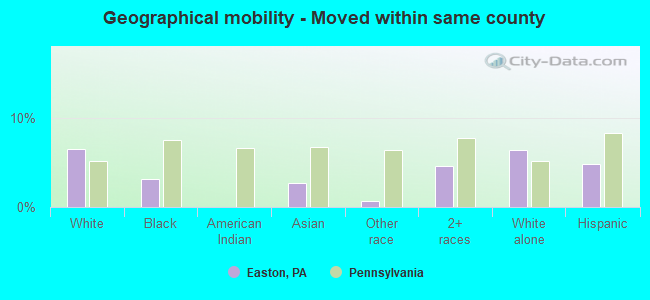
Geographical mobility - Moved within same county (%)
Geographical mobility - Moved within same county (%) - White
Geographical mobility - Moved within same county (%) - Black or African American
Geographical mobility - Moved within same county (%) - Asian
Geographical mobility - Moved within same county (%) - Hispanic or Latino
Geographical mobility - Moved within same county (%) - American Indian and Alaska Native
Geographical mobility - Moved within same county (%) - Multirace
Geographical mobility - Moved within same county (%) - Other Race
Geographical mobility - Moved from different county within same state (%)
Geographical mobility - Moved from different county within same state (%) - White
Geographical mobility - Moved from different county within same state (%) - Black or African American
Geographical mobility - Moved from different county within same state (%) - Asian
Geographical mobility - Moved from different county within same state (%) - Hispanic or Latino
Geographical mobility - Moved from different county within same state (%) - American Indian and Alaska Native
Geographical mobility - Moved from different county within same state (%) - Multirace
Geographical mobility - Moved from different county within same state (%) - Other Race
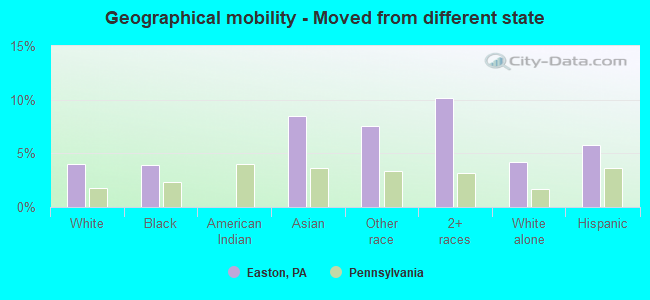
Geographical mobility - Moved from different state (%)
Geographical mobility - Moved from different state (%) - White
Geographical mobility - Moved from different state (%) - Black or African American
Geographical mobility - Moved from different state (%) - Asian
Geographical mobility - Moved from different state (%) - Hispanic or Latino
Geographical mobility - Moved from different state (%) - American Indian and Alaska Native
Geographical mobility - Moved from different state (%) - Multirace
Geographical mobility - Moved from different state (%) - Other Race
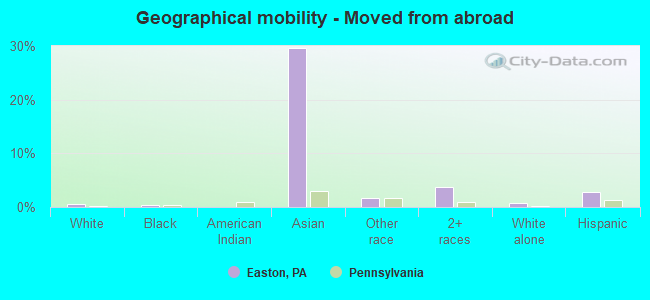
Geographical mobility - Moved from abroad (%)
Geographical mobility - Moved from abroad (%) - White
Geographical mobility - Moved from abroad (%) - Black or African American
Geographical mobility - Moved from abroad (%) - Asian
Geographical mobility - Moved from abroad (%) - Hispanic or Latino
Geographical mobility - Moved from abroad (%) - American Indian and Alaska Native
Geographical mobility - Moved from abroad (%) - Multirace
Geographical mobility - Moved from abroad (%) - Other Race
Place of birth for the foreign-born population - Ireland (%)
Place of birth for the foreign-born population - Denmark (%)
Place of birth for the foreign-born population - Norway (%)
Place of birth for the foreign-born population - Sweden (%)
Place of birth for the foreign-born population - United Kingdom (%)
Place of birth for the foreign-born population - England (%)
Place of birth for the foreign-born population - Scotland (%)
Place of birth for the foreign-born population - Other Northern Europe (%)
Place of birth for the foreign-born population - Austria (%)
Place of birth for the foreign-born population - Belgium (%)
Place of birth for the foreign-born population - France (%)
Place of birth for the foreign-born population - Germany (%)
Place of birth for the foreign-born population - Netherlands (%)
Place of birth for the foreign-born population - Switzerland (%)
Place of birth for the foreign-born population - Other Western Europe (%)
Place of birth for the foreign-born population - Greece (%)
Place of birth for the foreign-born population - Italy (%)
Place of birth for the foreign-born population - Portugal (%)
Place of birth for the foreign-born population - Spain (%)
Place of birth for the foreign-born population - Other Southern Europe (%)
Place of birth for the foreign-born population - Albania (%)
Place of birth for the foreign-born population - Belarus (%)
Place of birth for the foreign-born population - Bosnia and Herzegovina (%)
Place of birth for the foreign-born population - Bulgaria (%)
Place of birth for the foreign-born population - Croatia (%)
Place of birth for the foreign-born population - Czechoslovakia (%)
Place of birth for the foreign-born population - Hungary (%)
Place of birth for the foreign-born population - Latvia (%)
Place of birth for the foreign-born population - Lithuania (%)
Place of birth for the foreign-born population - North Macedonia (Macedonia) (%)
Place of birth for the foreign-born population - Moldova (%)
Place of birth for the foreign-born population - Poland (%)
Place of birth for the foreign-born population - Romania (%)
Place of birth for the foreign-born population - Russia (%)
Place of birth for the foreign-born population - Serbia (%)
Place of birth for the foreign-born population - Ukraine (%)
Place of birth for the foreign-born population - Other Eastern Europe (%)
Place of birth for the foreign-born population - China (%)
Place of birth for the foreign-born population - Hong Kong (%)
Place of birth for the foreign-born population - Taiwan (%)
Place of birth for the foreign-born population - Japan (%)
Place of birth for the foreign-born population - Korea (%)
Place of birth for the foreign-born population - Other Eastern Asia (%)
Place of birth for the foreign-born population - Afghanistan (%)
Place of birth for the foreign-born population - Bangladesh (%)
Place of birth for the foreign-born population - India (%)
Place of birth for the foreign-born population - Iran (%)
Place of birth for the foreign-born population - Kazakhstan (%)
Place of birth for the foreign-born population - Nepal (%)
Place of birth for the foreign-born population - Pakistan (%)
Place of birth for the foreign-born population - Sri Lanka (%)
Place of birth for the foreign-born population - Uzbekistan (%)
Place of birth for the foreign-born population - Other South Central Asia (%)
Place of birth for the foreign-born population - Burma (%)
Place of birth for the foreign-born population - Cambodia (%)
Place of birth for the foreign-born population - Indonesia (%)
Place of birth for the foreign-born population - Laos (%)
Place of birth for the foreign-born population - Malaysia (%)
Place of birth for the foreign-born population - Philippines (%)
Place of birth for the foreign-born population - Singapore (%)
Place of birth for the foreign-born population - Thailand (%)
Place of birth for the foreign-born population - Vietnam (%)
Place of birth for the foreign-born population - Other South Eastern Asia (%)
Place of birth for the foreign-born population - Armenia (%)
Place of birth for the foreign-born population - Iraq (%)
Place of birth for the foreign-born population - Israel (%)
Place of birth for the foreign-born population - Jordan (%)
Place of birth for the foreign-born population - Kuwait (%)
Place of birth for the foreign-born population - Lebanon (%)
Place of birth for the foreign-born population - Saudi Arabia (%)
Place of birth for the foreign-born population - Syria (%)
Place of birth for the foreign-born population - Turkey (%)
Place of birth for the foreign-born population - Yemen (%)
Place of birth for the foreign-born population - Other Western Asia (%)
Place of birth for the foreign-born population - Eritrea (%)
Place of birth for the foreign-born population - Ethiopia (%)
Place of birth for the foreign-born population - Kenya (%)
Place of birth for the foreign-born population - Somalia (%)
Place of birth for the foreign-born population - Uganda (%)
Place of birth for the foreign-born population - Zimbabwe (%)
Place of birth for the foreign-born population - Other Eastern Africa (%)
Place of birth for the foreign-born population - Cameroon (%)
Place of birth for the foreign-born population - Congo (%)
Place of birth for the foreign-born population - Democratic Republic of Congo (Zaire) (%)
Place of birth for the foreign-born population - Other Middle Africa (%)
Place of birth for the foreign-born population - Egypt (%)
Place of birth for the foreign-born population - Morocco (%)
Place of birth for the foreign-born population - Sudan (%)
Place of birth for the foreign-born population - Other Northern Africa (%)
Place of birth for the foreign-born population - South Africa (%)
Place of birth for the foreign-born population - Other Southern Africa (%)
Place of birth for the foreign-born population - Cabo Verde (%)
Place of birth for the foreign-born population - Ghana (%)
Place of birth for the foreign-born population - Liberia (%)
Place of birth for the foreign-born population - Nigeria (%)
Place of birth for the foreign-born population - Senegal (%)
Place of birth for the foreign-born population - Sierra Leone (%)
Place of birth for the foreign-born population - Other Western Africa (%)
Place of birth for the foreign-born population - Australia (%)
Place of birth for the foreign-born population - New Zealand (%)
Place of birth for the foreign-born population - Fiji (%)
Place of birth for the foreign-born population - Micronesia (%)
Place of birth for the foreign-born population - Bahamas (%)
Place of birth for the foreign-born population - Barbados (%)
Place of birth for the foreign-born population - Cuba (%)
Place of birth for the foreign-born population - Dominica (%)
Place of birth for the foreign-born population - Dominican Republic (%)
Place of birth for the foreign-born population - Grenada (%)
Place of birth for the foreign-born population - Haiti (%)
Place of birth for the foreign-born population - Jamaica (%)
Place of birth for the foreign-born population - St. Vincent and the Grenadines (%)
Place of birth for the foreign-born population - Trinidad and Tobago (%)
Place of birth for the foreign-born population - West Indies (%)
Place of birth for the foreign-born population - Other Caribbean (%)
Place of birth for the foreign-born population - Belize (%)
Place of birth for the foreign-born population - Costa Rica (%)
Place of birth for the foreign-born population - El Salvador (%)
Place of birth for the foreign-born population - Guatemala (%)
Place of birth for the foreign-born population - Honduras (%)
Place of birth for the foreign-born population - Mexico (%)
Place of birth for the foreign-born population - Nicaragua (%)
Place of birth for the foreign-born population - Panama (%)
Place of birth for the foreign-born population - Other Central America (%)
Place of birth for the foreign-born population - Argentina (%)
Place of birth for the foreign-born population - Bolivia (%)
Place of birth for the foreign-born population - Brazil (%)
Place of birth for the foreign-born population - Chile (%)
Place of birth for the foreign-born population - Colombia (%)
Place of birth for the foreign-born population - Ecuador (%)
Place of birth for the foreign-born population - Guyana (%)
Place of birth for the foreign-born population - Peru (%)
Place of birth for the foreign-born population - Uruguay (%)
Place of birth for the foreign-born population - Venezuela (%)
Place of birth for the foreign-born population - Other South America (%)
Place of birth for the foreign-born population - Canada (%)
Place of birth for the foreign-born population - Other Northern America (%)
Place of birth for the foreign-born population - Other (%)
Latest news about races in Easton, PA collected exclusively by city-data.com from local newspapers, TV, and radio stations
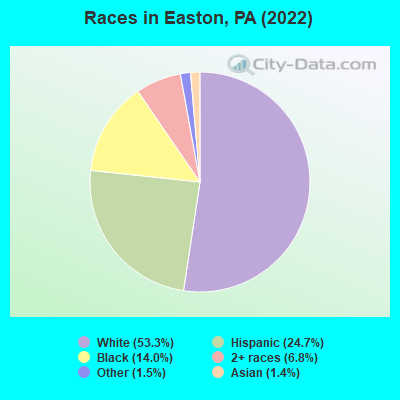
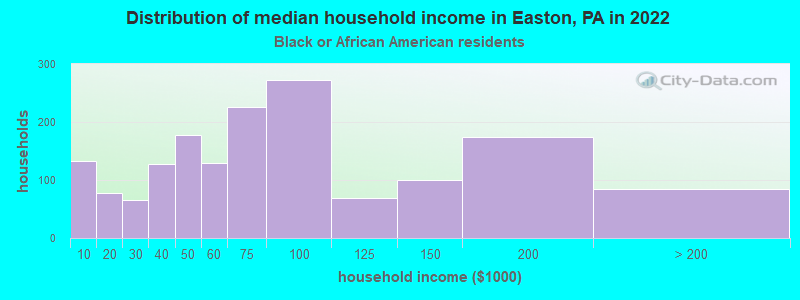
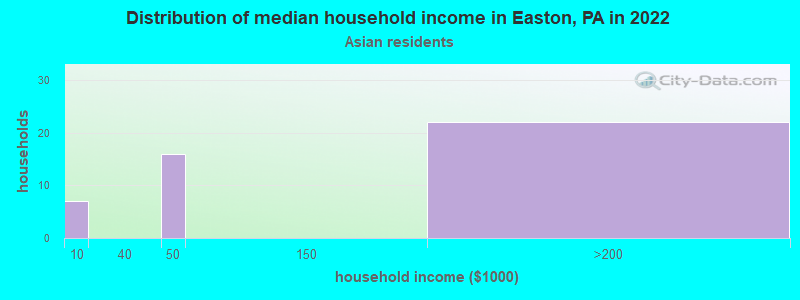
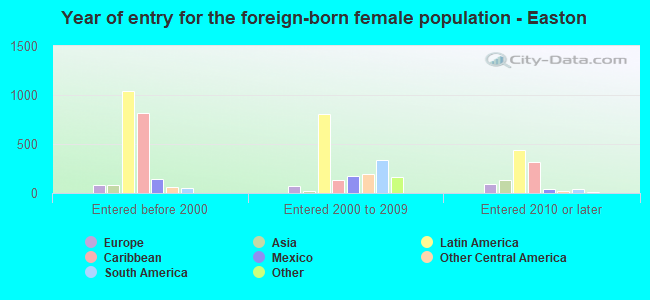
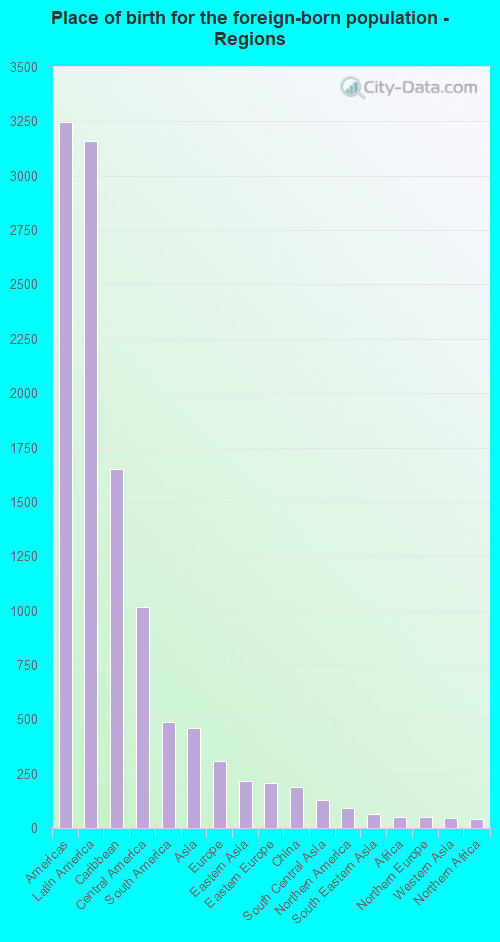
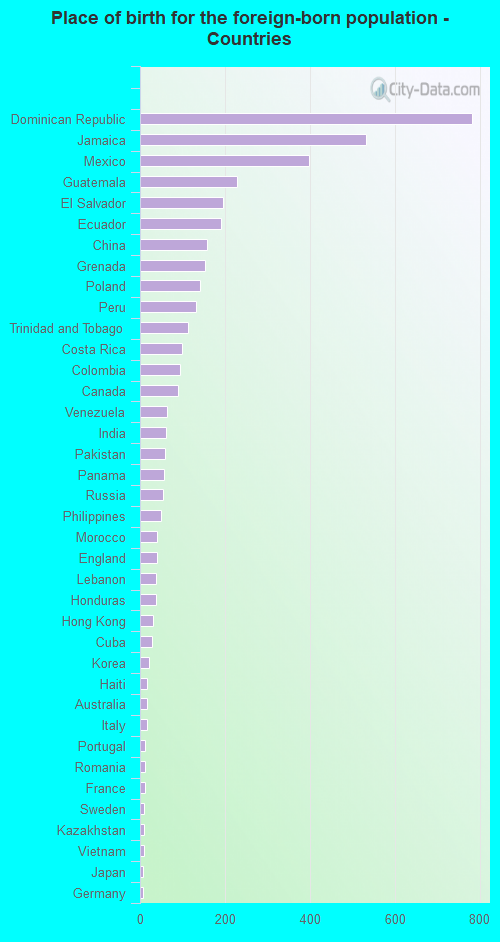
According to 2022 data, the most numerous races in Easton, PA are White alone (15,595 residents), Black alone (4,085 residents), and Hispanic (7,225 residents). 77.2% of Easton residents speak English at home. 14.0% of Easton, PA residents are foreign-born (10.5% born in Latin America, 1.5% born in Asia), which is 49.9% greater than the foreign-born rate of 7.0% across the entire state of Pennsylvania.
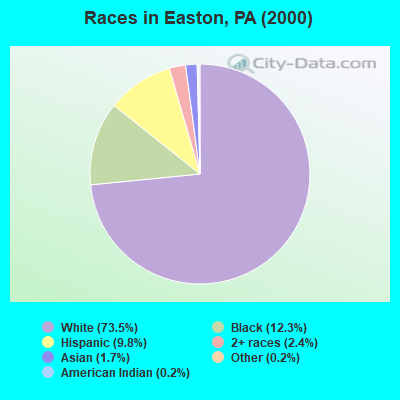
Race distribution in Easton
2000 2022
10,322,455 84.1% White alone 1,202,437 9.8% Black alone 394,088 3.2% Hispanic 218,296 1.8% Asian alone 113,097 0.9% Two or more races 13,086 0.1% Other race alone 14,904 0.1% American Indian alone 2,691 0.02% Native Hawaiian and Other
9,487,228 73.1% White alone 1,311,581 10.1% Black alone 1,115,997 8.6% Hispanic 493,942 3.8% Two or more races 487,124 3.8% Asian alone 63,582 0.5% Other race alone 10,130 0.08% American Indian alone 2,424 0.02% Native Hawaiian and Other
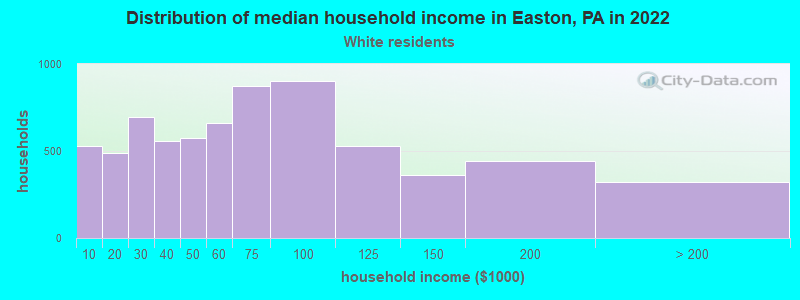
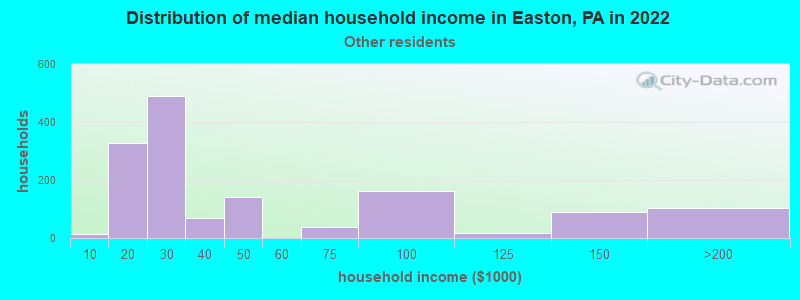
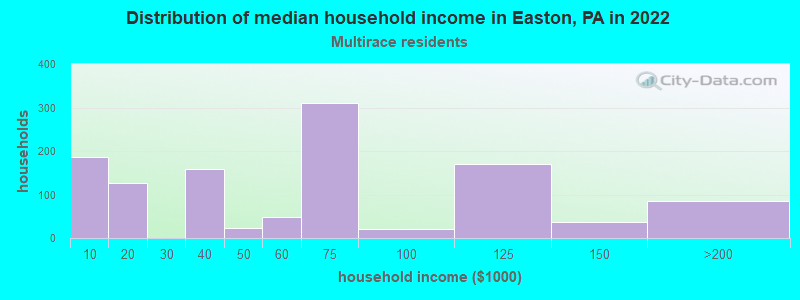
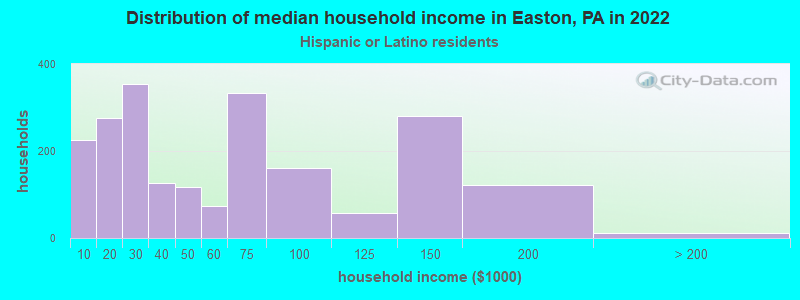
Income and house value in Easton Median household income in 2022 $59,350 White non-Hispanic householders$49,713 Black householders$35,373 Some other race householders$64,966 Two or more races householders$41,951 Hispanic or Latino race householdersMedian 2022 house value $164,347 White Non-Hispanic householders$163,919 Black or African American householders$240,429 American Indian or Alaska Native householders $166,484 Asian householders$149,600 Some other race householders$196,831 Two or more races householders$157,080 Hispanic or Latino householders
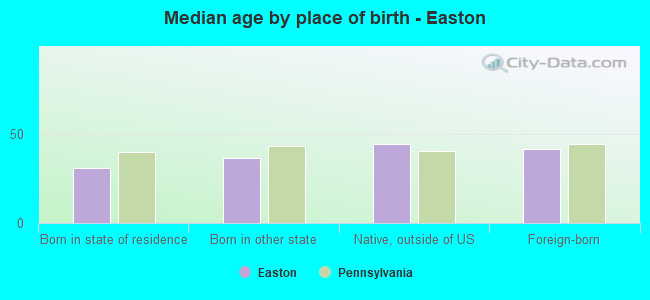
Median age by race in Easton
38.4 Median age for White residents37.7 40.1 42.8 Median age for Black or African American residents37.5 43.5 34.0 Median age for American Indian / Alaska Native residents-835,945,662.7 11.2 23.8 Median age for Asian residents19.5 24.1 -680,432,644.4 Median age for Native Hawaiian / Pacific Islander residents-649,523,808.9 -666,666,666.0 27.5 Median age for Other race residents24.3 30.2 24.0 Median age for Two or more races residents27.8 21.4 38.8 Median age for White alone residents37.7 41.8 25.7 Median age for Hispanic or Latino residents25.1 26.6
Owner/renter occupied households by race in Easton
House owners and renters - White residents 3,315 48.3% Owner occupied3,555 51.7% Renter occupiedHouse owners and renters - Black or African American residents 664 43.7% Owner occupied856 56.3% Renter occupiedHouse owners and renters - American Indian / Alaska Native residents 62 100.0% Renter occupiedHouse owners and renters - Asian residents 30 66.5% Owner occupied15 33.5% Renter occupiedHouse owners and renters - Other race residents 455 32.1% Owner occupied965 67.9% Renter occupiedHouse owners and renters - Two or more races residents 543 51.8% Owner occupied505 48.2% Renter occupiedHouse owners and renters - White alone residents 3,169 47.8% Owner occupied3,461 52.2% Renter occupiedHouse owners and renters - Hispanic or Latino residents 762 37.8% Owner occupied1,257 62.2% Renter occupied
Language usage in Easton
English speakers - Total 77.2% of residents of Easton speak English at home.
21.8% of residents speak Spanish at home 3,174 51.7% Speak English very well2,969 48.3% Speak English less than very well3.3% of residents speak other language at home 477 52.0% Speak English very well440 48.0% Speak English less than very well
English speakers - Born in the United States 87.3% of residents of Easton speak English at home.
12.8% of residents speak Spanish at home 1,101 79.6% Speak English very well282 20.4% Speak English less than very well0.9% of residents speak other language at home 66 66.7% Speak English very well33 33.3% Speak English less than very well
English speakers - Native, born elsewhere 23.6% of residents of Easton speak English at home.
71.0% of residents speak Spanish at home 389 51.6% Speak English very well365 48.4% Speak English less than very well5.8% of residents speak other language at home 30 48.4% Speak English very well32 51.6% Speak English less than very well
English speakers - Foreign-born 25.3% of residents of Easton speak English at home.
68.6% of residents speak Spanish at home 795 25.8% Speak English very well2,284 74.2% Speak English less than very well13.1% of residents speak other language at home 266 45.2% Speak English very well322 54.8% Speak English less than very well
White (Caucasian) - Speak only English Native:
96.2% (14,546)Foreign-born:
47.2% (453)
White (Caucasian) - Speak another language Native:
3.6% (546)Foreign-born:
54.5% (524)
Black or African American - Speak only English Native:
97.5% (3,691)Foreign-born:
55.5% (316)
Black or African American - Speak another language Native:
2.9% (111)Foreign-born:
15.3% (87)
American Indian / Alaska Native - Speak another language Native:
100.0% (82)Foreign-born:
100.0% (110)
Asian - Speak only English Native:
46.4% (67)Foreign-born:
16.7% (41)
Asian - Speak another language Native:
54.3% (79)Foreign-born:
98.0% (240)
Other race - Speak only English Native:
22.0% (546)Foreign-born:
3.3% (62)
Other race - Speak another language Native:
80.5% (1,999)Foreign-born:
99.2% (1,867)
Two or more races - Speak only English Native:
65.4% (2,119)Foreign-born:
22.0% (334)
Two or more races - Speak another language Native:
34.4% (1,113)Foreign-born:
76.6% (1,165)
White alone - Speak only English Native:
98.0% (14,230)Foreign-born:
63.5% (487)
White alone - Speak another language Native:
1.9% (278)Foreign-born:
37.2% (285)
Hispanic or Latino - Speak only English Native:
29.7% (1,225)Foreign-born:
3.3% (103)
Hispanic or Latino - Speak another language Native:
74.0% (3,049)Foreign-born:
97.9% (3,019)
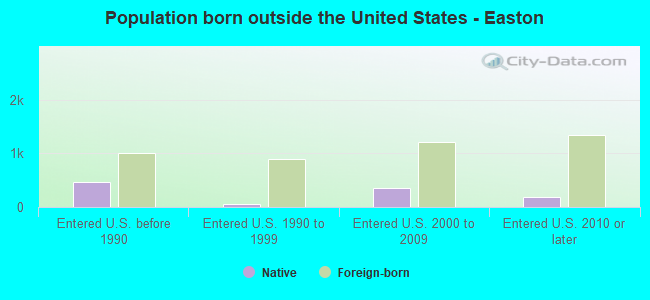
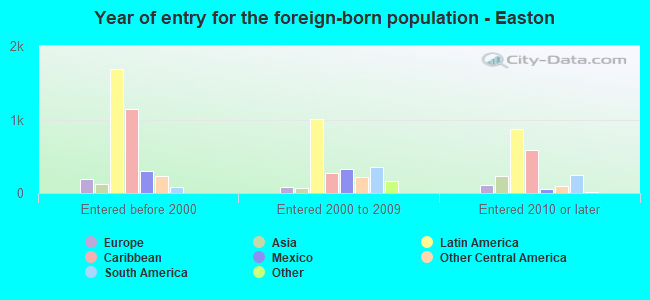
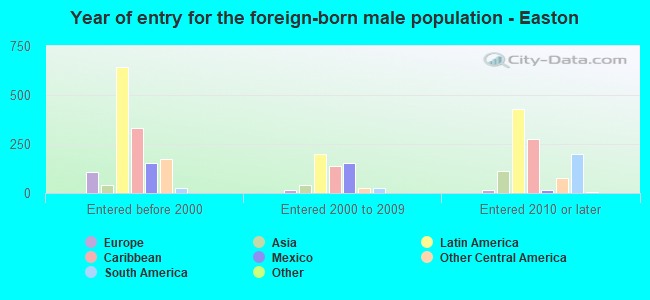
Foreign-born residents in Easton 4,086 residents are foreign born (10.5% Latin America , 1.5% Asia ).
This city:
14.0%Pennsylvania:
7.3%
Marital status for residents in Easton Marital status - White (Caucasian) population 15 years and over
Males 50.0% Never married36.0% Now married2.6% Separated1.4% Widowed9.9% DivorcedFemales 39.5% Never married35.6% Now married1.9% Separated8.6% Widowed14.3% DivorcedWomen who gave birth in the past 12 months Now married:
95.0% (73)Unmarried:
5.0% (4)
Women who did not give birth in the past 12 months Now married:
30.4% (1,261)Unmarried:
69.6% (2,887)
Marital status - Black or African American population 15 years and over
Males 59.5% Never married21.4% Now married4.2% Separated5.2% Widowed9.7% DivorcedFemales 57.8% Never married13.8% Now married3.4% Separated17.4% Widowed7.6% DivorcedWomen who gave birth in the past 12 months Now married:
10.8% (23)Unmarried:
89.2% (192)
Women who did not give birth in the past 12 months Now married:
14.3% (99)Unmarried:
85.7% (594)
Marital status - American Indian / Alaska Native population 15 years and over
Males 100.0% Never married0.0% Now married0.0% Separated0.0% Widowed0.0% DivorcedFemales 84.6% Never married15.4% Now married0.0% Separated0.0% Widowed0.0% DivorcedWomen who did not give birth in the past 12 months Now married:
0.0% (0)Unmarried:
100.0% (40)
Marital status - Asian population 15 years and over
Males 64.3% Never married35.7% Now married0.0% Separated0.0% Widowed0.0% DivorcedFemales 78.0% Never married22.0% Now married0.0% Separated0.0% Widowed0.0% DivorcedWomen who did not give birth in the past 12 months Now married:
11.2% (23)Unmarried:
88.8% (179)
Marital status - Other race population 15 years and over
Males 48.8% Never married38.4% Now married6.4% Separated1.3% Widowed5.1% DivorcedFemales 35.8% Never married42.6% Now married4.2% Separated7.2% Widowed10.2% DivorcedWomen who gave birth in the past 12 months Now married:
100.0% (181)Unmarried:
0.0% (0)
Women who did not give birth in the past 12 months Now married:
44.6% (448)Unmarried:
55.4% (555)
Marital status - Two or more races population 15 years and over
Males 56.7% Never married35.8% Now married0.0% Separated2.7% Widowed4.7% DivorcedFemales 57.9% Never married28.1% Now married0.7% Separated1.3% Widowed11.9% DivorcedWomen who gave birth in the past 12 months Now married:
100.0% (43)Unmarried:
0.0% (0)
Women who did not give birth in the past 12 months Now married:
23.6% (370)Unmarried:
76.4% (1,198)
Marital status - White alone, not Hispanic / Latino population 15 years and over
Males 50.3% Never married35.6% Now married2.1% Separated1.4% Widowed10.6% DivorcedFemales 39.1% Never married36.0% Now married2.1% Separated8.2% Widowed14.6% DivorcedWomen who gave birth in the past 12 months Now married:
95.0% (76)Unmarried:
5.0% (4)
Women who did not give birth in the past 12 months Now married:
30.4% (1,168)Unmarried:
69.6% (2,672)
Marital status - Hispanic or Latino population 15 years and over
Males 48.5% Never married41.2% Now married5.5% Separated1.1% Widowed3.7% DivorcedFemales 45.8% Never married36.6% Now married3.1% Separated6.5% Widowed7.9% DivorcedWomen who gave birth in the past 12 months Now married:
100.0% (192)Unmarried:
0.0% (0)
Women who did not give birth in the past 12 months Now married:
33.0% (654)Unmarried:
67.0% (1,325)
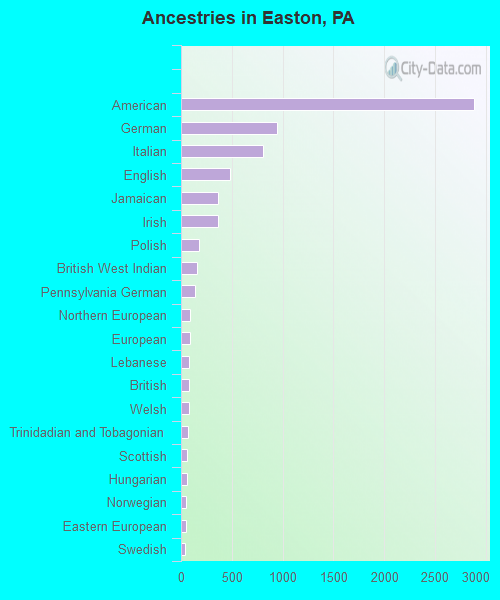
Ancestries in Easton
2,888 19.7% American950 6.5% German810 5.5% Italian484 3.3% English362 2.5% Jamaican360 2.5% Irish176 1.2% Polish153 1.0% British West Indian141 1.0% Pennsylvania German87 0.6% Northern European87 0.6% European81 0.6% Lebanese76 0.5% British76 0.5% Welsh66 0.5% Trinidadian and Tobagonian62 0.4% Scottish58 0.4% Hungarian51 0.3% Norwegian48 0.3% Eastern European44 0.3% Swedish26 0.2% Portuguese25 0.2% Lithuanian25 0.2% Scotch-Irish21 0.1% Canadian17 0.1% Dutch15 0.1% French15 0.1% Haitian14 0.10% Arab12 0.08% Slavic11 0.08% Russian10 0.07% Australian10 0.07% Ethiopian9 0.06% Moroccan9 0.06% Armenian8 0.05% Scandinavian6 0.04% Albanian4 0.03% Liberian1 0.01% Slovak1 0.01% Turkish
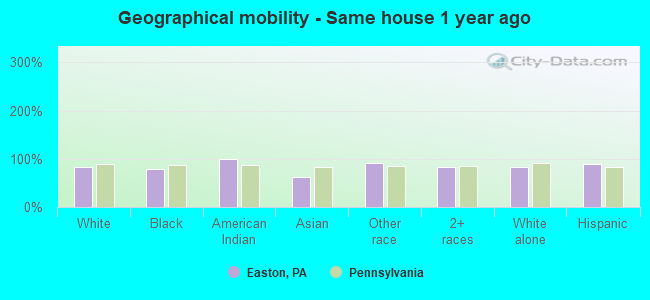
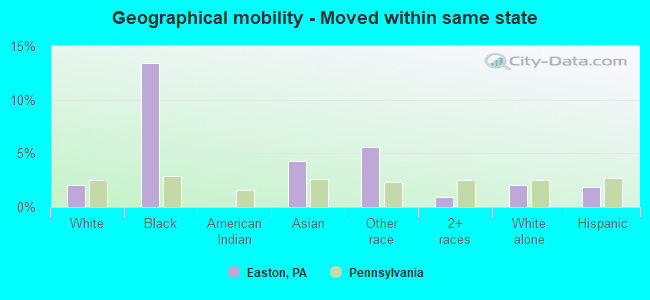
Geographical mobility in Easton Same house 1 year ago 13,778 84.0% White (Caucasian)3,519 78.7% Black or African American188 99.6% American Indian / Alaska Native250 62.2% Asian4,064 91.0% Other race3,825 81.7% Two or more races13,026 83.9% White alone, not Hispanic / Latino6,199 88.6% Hispanic or LatinoMoved within same county 1,062 6.5% White / Caucasian141 3.2% Black or African American11 2.7% Asian32 0.7% Other race216 4.6% Two or more races991 6.4% White alone, not Hispanic / Latino335 4.8% Hispanic or LatinoMoved within same state 337 2.1% White / Caucasian600 13.4% Black or African American17 4.3% Asian251 5.6% Other race43 0.9% Two or more races313 2.0% White alone, not Hispanic / Latino133 1.9% Hispanic or LatinoMoved from different state 658 4.0% White / Caucasian177 4.0% Black or African American34 8.5% Asian335 7.5% Other race475 10.1% Two or more races658 4.2% White alone, not Hispanic / Latino407 5.8% Hispanic or LatinoMoved from abroad 82 0.5% White17 0.4% Black or African American119 29.7% Asian79 1.8% Other race174 3.7% Two or more races102 0.7% White alone, not Hispanic / Latino200 2.9% Hispanic or Latino
Children Nativity (place of birth) in Easton
Children under 6 years - Living with two parents Both parents native 258 100.0% NativeBoth parents foreign-born 171 100.0% NativeOne native, one foreign-born parent 110 100.0% NativeChildren under 6 years - Living with one parent Native parent 565 100.0% NativeForeign-born parent 21 100.0% NativeChildren 6 to 17 years - Living with two parents Both parents native 798 100.0% NativeBoth parents foreign-born 328 62.6% Native196 37.4% Foreign-bornOne native, one foreign-born parent 148 100.0% NativeChildren 6 to 17 years - Living with one parent Native parent 2,060 100.0% NativeForeign-born parent 335 49.5% Native342 50.5% Foreign-born
Grandparents responsible for own grandchildren in Easton
Grandparents (30 to 59 years) White / Caucasian 90 82.0% Responsible for grandchildren20 18.0% Not responsible for grandchildrenBlack or African American 31 83.8% Responsible for grandchildren6 16.2% Not responsible for grandchildrenOther race 77 100.0% Not responsible for grandchildrenWhite alone, not Hispanic / Latino 92 82.5% Responsible for grandchildren20 17.5% Not responsible for grandchildrenHispanic or Latino 58 100.0% Not responsible for grandchildrenGrandparents (60 years and over) White / Caucasian 47 36.0% Responsible for grandchildren83 64.0% Not responsible for grandchildrenBlack or African American 40 100.0% Not responsible for grandchildrenOther race 67 100.0% Not responsible for grandchildrenWhite alone, not Hispanic / Latino 47 35.2% Responsible for grandchildren87 64.8% Not responsible for grandchildrenHispanic or Latino 1 1.5% Responsible for grandchildren72 98.5% Not responsible for grandchildren