Races in Elkhorn, Wisconsin (WI) Detailed Stats
Data:
Races - White alone (%)
Races - White alone (% change since 2000)
Races - Black alone (%)
Races - Black alone (% change since 2000)
Races - American Indian alone (%)
Races - American Indian alone (% change since 2000)
Races - Asian alone (%)
Races - Asian alone (% change since 2000)
Races - Hispanic (%)
Races - Hispanic (% change since 2000)
Races - Native Hawaiian and Other Pacific Islander alone (%)
Races - Native Hawaiian and Other Pacific Islander alone (% change since 2000)
Races - Two or more races(%)
Races - Two or more races(% change since 2000)
Races - Other race alone (%)
Races - Other race alone (% change since 2000)
Racial diversity
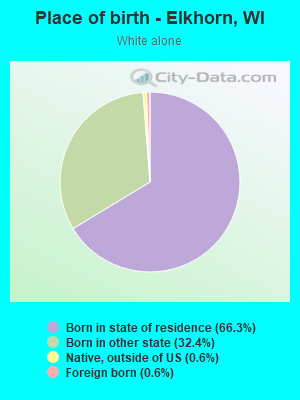
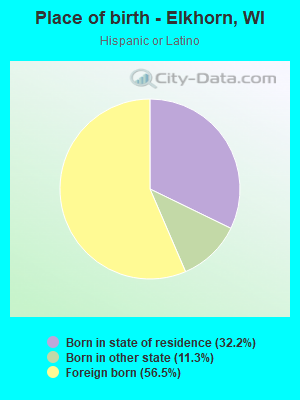
Place of birth - Born in state of residence (%)
Place of birth - Born in state of residence (%) - White
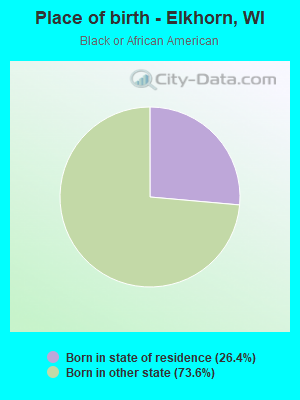
Place of birth - Born in state of residence (%) - Black or African American
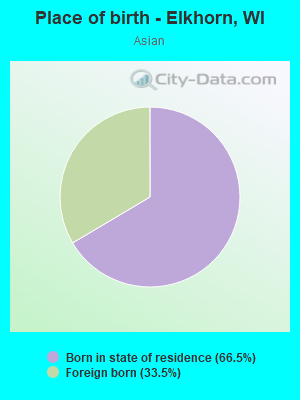
Place of birth - Born in state of residence (%) - Asian
Place of birth - Born in state of residence (%) - Hispanic or Latino
Place of birth - Born in state of residence (%) - American Indian and Alaska Native
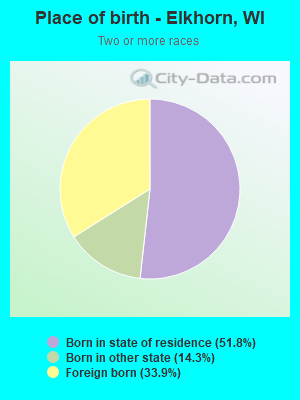
Place of birth - Born in state of residence (%) - Multirace
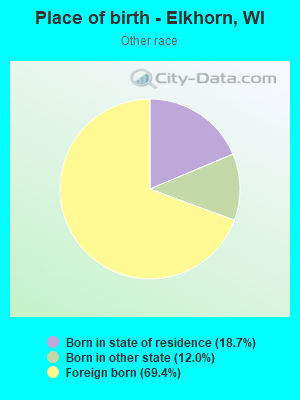
Place of birth - Born in state of residence (%) - Other Race
Place of birth - Born in other state (%)
Place of birth - Born in other state (%) - White
Place of birth - Born in other state (%) - Black or African American
Place of birth - Born in other state (%) - Asian
Place of birth - Born in other state (%) - Hispanic or Latino
Place of birth - Born in other state (%) - American Indian and Alaska Native
Place of birth - Born in other state (%) - Multirace
Place of birth - Born in other state (%) - Other Race
Place of birth - Native, outside of US (%)
Place of birth - Native, outside of US (%) - White
Place of birth - Native, outside of US (%) - Black or African American
Place of birth - Native, outside of US (%) - Asian
Place of birth - Native, outside of US (%) - Hispanic or Latino
Place of birth - Native, outside of US (%) - American Indian and Alaska Native
Place of birth - Native, outside of US (%) - Multirace
Place of birth - Native, outside of US (%) - Other Race
Place of birth - Foreign born (%)
Place of birth - Foreign born (%) - White
Place of birth - Foreign born (%) - Black or African American
Place of birth - Foreign born (%) - Asian
Place of birth - Foreign born (%) - Hispanic or Latino
Place of birth - Foreign born (%) - American Indian and Alaska Native
Place of birth - Foreign born (%) - Multirace
Place of birth - Foreign born (%) - Other Race
Residents speaking English at home (%)
Residents speaking English at home - Born in the United States (%)
Residents speaking English at home - Native, born elsewhere (%)
Residents speaking English at home - Foreign born (%)
Residents speaking Spanish at home (%)
Residents speaking Spanish at home - Born in the United States (%)
Residents speaking Spanish at home - Native, born elsewhere (%)
Residents speaking Spanish at home - Foreign born (%)
Residents speaking other language at home (%)
Residents speaking other language at home - Born in the United States (%)
Residents speaking other language at home - Native, born elsewhere (%)
Residents speaking other language at home - Foreign born (%)
Marital status - Never married (%)
Marital status - Now married (%)
Marital status - Separated (%)
Marital status - Widowed (%)
Marital status - Divorced (%)
Ancestries Reported - Arab (%)
Ancestries Reported - Czech (%)
Ancestries Reported - Danish (%)
Ancestries Reported - Dutch (%)
Ancestries Reported - English (%)
Ancestries Reported - French (%)
Ancestries Reported - French Canadian (%)
Ancestries Reported - German (%)
Ancestries Reported - Greek (%)
Ancestries Reported - Hungarian (%)
Ancestries Reported - Irish (%)
Ancestries Reported - Italian (%)
Ancestries Reported - Lithuanian (%)
Ancestries Reported - Norwegian (%)
Ancestries Reported - Polish (%)
Ancestries Reported - Portuguese (%)
Ancestries Reported - Russian (%)
Ancestries Reported - Scotch-Irish (%)
Ancestries Reported - Scottish (%)
Ancestries Reported - Slovak (%)
Ancestries Reported - Subsaharan African (%)
Ancestries Reported - Swedish (%)
Ancestries Reported - Swiss (%)
Ancestries Reported - Ukrainian (%)
Ancestries Reported - United States (%)
Ancestries Reported - Welsh (%)
Ancestries Reported - West Indian (%)
Ancestries Reported - Other (%)
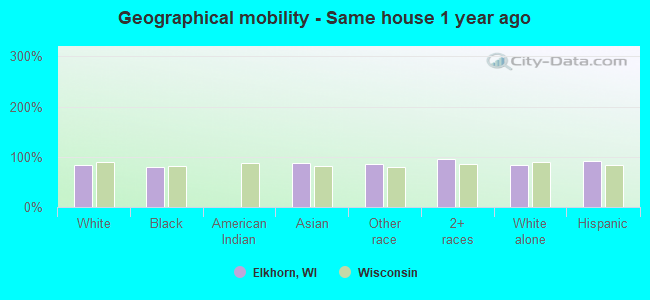
Geographical mobility - Same house 1 year ago (%)
Geographical mobility - Same house 1 year ago (%) - White
Geographical mobility - Same house 1 year ago (%) - Black or African American
Geographical mobility - Same house 1 year ago (%) - Asian
Geographical mobility - Same house 1 year ago (%) - Hispanic or Latino
Geographical mobility - Same house 1 year ago (%) - American Indian and Alaska Native
Geographical mobility - Same house 1 year ago (%) - Multirace
Geographical mobility - Same house 1 year ago (%) - Other Race
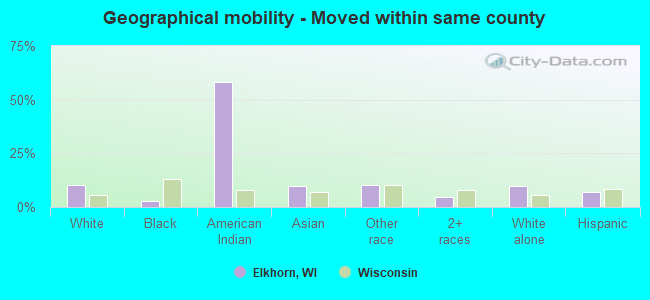
Geographical mobility - Moved within same county (%)
Geographical mobility - Moved within same county (%) - White
Geographical mobility - Moved within same county (%) - Black or African American
Geographical mobility - Moved within same county (%) - Asian
Geographical mobility - Moved within same county (%) - Hispanic or Latino
Geographical mobility - Moved within same county (%) - American Indian and Alaska Native
Geographical mobility - Moved within same county (%) - Multirace
Geographical mobility - Moved within same county (%) - Other Race
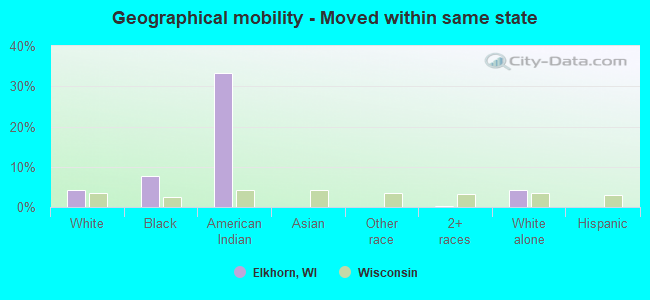
Geographical mobility - Moved from different county within same state (%)
Geographical mobility - Moved from different county within same state (%) - White
Geographical mobility - Moved from different county within same state (%) - Black or African American
Geographical mobility - Moved from different county within same state (%) - Asian
Geographical mobility - Moved from different county within same state (%) - Hispanic or Latino
Geographical mobility - Moved from different county within same state (%) - American Indian and Alaska Native
Geographical mobility - Moved from different county within same state (%) - Multirace
Geographical mobility - Moved from different county within same state (%) - Other Race
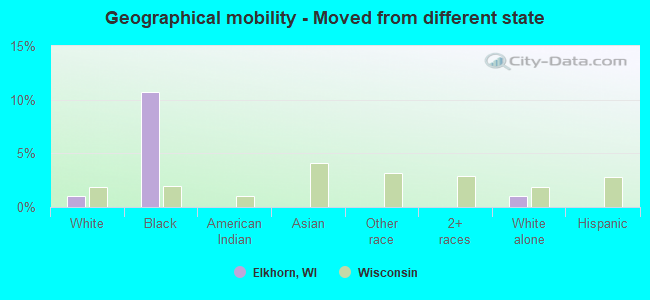
Geographical mobility - Moved from different state (%)
Geographical mobility - Moved from different state (%) - White
Geographical mobility - Moved from different state (%) - Black or African American
Geographical mobility - Moved from different state (%) - Asian
Geographical mobility - Moved from different state (%) - Hispanic or Latino
Geographical mobility - Moved from different state (%) - American Indian and Alaska Native
Geographical mobility - Moved from different state (%) - Multirace
Geographical mobility - Moved from different state (%) - Other Race
Geographical mobility - Moved from abroad (%)
Geographical mobility - Moved from abroad (%) - White
Geographical mobility - Moved from abroad (%) - Black or African American
Geographical mobility - Moved from abroad (%) - Asian
Geographical mobility - Moved from abroad (%) - Hispanic or Latino
Geographical mobility - Moved from abroad (%) - American Indian and Alaska Native
Geographical mobility - Moved from abroad (%) - Multirace
Geographical mobility - Moved from abroad (%) - Other Race
Place of birth for the foreign-born population - Ireland (%)
Place of birth for the foreign-born population - Denmark (%)
Place of birth for the foreign-born population - Norway (%)
Place of birth for the foreign-born population - Sweden (%)
Place of birth for the foreign-born population - United Kingdom (%)
Place of birth for the foreign-born population - England (%)
Place of birth for the foreign-born population - Scotland (%)
Place of birth for the foreign-born population - Other Northern Europe (%)
Place of birth for the foreign-born population - Austria (%)
Place of birth for the foreign-born population - Belgium (%)
Place of birth for the foreign-born population - France (%)
Place of birth for the foreign-born population - Germany (%)
Place of birth for the foreign-born population - Netherlands (%)
Place of birth for the foreign-born population - Switzerland (%)
Place of birth for the foreign-born population - Other Western Europe (%)
Place of birth for the foreign-born population - Greece (%)
Place of birth for the foreign-born population - Italy (%)
Place of birth for the foreign-born population - Portugal (%)
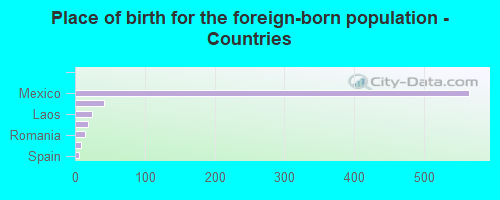
Place of birth for the foreign-born population - Spain (%)
Place of birth for the foreign-born population - Other Southern Europe (%)
Place of birth for the foreign-born population - Albania (%)
Place of birth for the foreign-born population - Belarus (%)
Place of birth for the foreign-born population - Bosnia and Herzegovina (%)
Place of birth for the foreign-born population - Bulgaria (%)
Place of birth for the foreign-born population - Croatia (%)
Place of birth for the foreign-born population - Czechoslovakia (%)
Place of birth for the foreign-born population - Hungary (%)
Place of birth for the foreign-born population - Latvia (%)
Place of birth for the foreign-born population - Lithuania (%)
Place of birth for the foreign-born population - North Macedonia (Macedonia) (%)
Place of birth for the foreign-born population - Moldova (%)
Place of birth for the foreign-born population - Poland (%)
Place of birth for the foreign-born population - Romania (%)
Place of birth for the foreign-born population - Russia (%)
Place of birth for the foreign-born population - Serbia (%)
Place of birth for the foreign-born population - Ukraine (%)
Place of birth for the foreign-born population - Other Eastern Europe (%)
Place of birth for the foreign-born population - China (%)
Place of birth for the foreign-born population - Hong Kong (%)
Place of birth for the foreign-born population - Taiwan (%)
Place of birth for the foreign-born population - Japan (%)
Place of birth for the foreign-born population - Korea (%)
Place of birth for the foreign-born population - Other Eastern Asia (%)
Place of birth for the foreign-born population - Afghanistan (%)
Place of birth for the foreign-born population - Bangladesh (%)
Place of birth for the foreign-born population - India (%)
Place of birth for the foreign-born population - Iran (%)
Place of birth for the foreign-born population - Kazakhstan (%)
Place of birth for the foreign-born population - Nepal (%)
Place of birth for the foreign-born population - Pakistan (%)
Place of birth for the foreign-born population - Sri Lanka (%)
Place of birth for the foreign-born population - Uzbekistan (%)
Place of birth for the foreign-born population - Other South Central Asia (%)
Place of birth for the foreign-born population - Burma (%)
Place of birth for the foreign-born population - Cambodia (%)
Place of birth for the foreign-born population - Indonesia (%)
Place of birth for the foreign-born population - Laos (%)
Place of birth for the foreign-born population - Malaysia (%)
Place of birth for the foreign-born population - Philippines (%)
Place of birth for the foreign-born population - Singapore (%)
Place of birth for the foreign-born population - Thailand (%)
Place of birth for the foreign-born population - Vietnam (%)
Place of birth for the foreign-born population - Other South Eastern Asia (%)
Place of birth for the foreign-born population - Armenia (%)
Place of birth for the foreign-born population - Iraq (%)
Place of birth for the foreign-born population - Israel (%)
Place of birth for the foreign-born population - Jordan (%)
Place of birth for the foreign-born population - Kuwait (%)
Place of birth for the foreign-born population - Lebanon (%)
Place of birth for the foreign-born population - Saudi Arabia (%)
Place of birth for the foreign-born population - Syria (%)
Place of birth for the foreign-born population - Turkey (%)
Place of birth for the foreign-born population - Yemen (%)
Place of birth for the foreign-born population - Other Western Asia (%)
Place of birth for the foreign-born population - Eritrea (%)
Place of birth for the foreign-born population - Ethiopia (%)
Place of birth for the foreign-born population - Kenya (%)
Place of birth for the foreign-born population - Somalia (%)
Place of birth for the foreign-born population - Uganda (%)
Place of birth for the foreign-born population - Zimbabwe (%)
Place of birth for the foreign-born population - Other Eastern Africa (%)
Place of birth for the foreign-born population - Cameroon (%)
Place of birth for the foreign-born population - Congo (%)
Place of birth for the foreign-born population - Democratic Republic of Congo (Zaire) (%)
Place of birth for the foreign-born population - Other Middle Africa (%)
Place of birth for the foreign-born population - Egypt (%)
Place of birth for the foreign-born population - Morocco (%)
Place of birth for the foreign-born population - Sudan (%)
Place of birth for the foreign-born population - Other Northern Africa (%)
Place of birth for the foreign-born population - South Africa (%)
Place of birth for the foreign-born population - Other Southern Africa (%)
Place of birth for the foreign-born population - Cabo Verde (%)
Place of birth for the foreign-born population - Ghana (%)
Place of birth for the foreign-born population - Liberia (%)
Place of birth for the foreign-born population - Nigeria (%)
Place of birth for the foreign-born population - Senegal (%)
Place of birth for the foreign-born population - Sierra Leone (%)
Place of birth for the foreign-born population - Other Western Africa (%)
Place of birth for the foreign-born population - Australia (%)
Place of birth for the foreign-born population - New Zealand (%)
Place of birth for the foreign-born population - Fiji (%)
Place of birth for the foreign-born population - Micronesia (%)
Place of birth for the foreign-born population - Bahamas (%)
Place of birth for the foreign-born population - Barbados (%)
Place of birth for the foreign-born population - Cuba (%)
Place of birth for the foreign-born population - Dominica (%)
Place of birth for the foreign-born population - Dominican Republic (%)
Place of birth for the foreign-born population - Grenada (%)
Place of birth for the foreign-born population - Haiti (%)
Place of birth for the foreign-born population - Jamaica (%)
Place of birth for the foreign-born population - St. Vincent and the Grenadines (%)
Place of birth for the foreign-born population - Trinidad and Tobago (%)
Place of birth for the foreign-born population - West Indies (%)
Place of birth for the foreign-born population - Other Caribbean (%)
Place of birth for the foreign-born population - Belize (%)
Place of birth for the foreign-born population - Costa Rica (%)
Place of birth for the foreign-born population - El Salvador (%)
Place of birth for the foreign-born population - Guatemala (%)
Place of birth for the foreign-born population - Honduras (%)
Place of birth for the foreign-born population - Mexico (%)
Place of birth for the foreign-born population - Nicaragua (%)
Place of birth for the foreign-born population - Panama (%)
Place of birth for the foreign-born population - Other Central America (%)
Place of birth for the foreign-born population - Argentina (%)
Place of birth for the foreign-born population - Bolivia (%)
Place of birth for the foreign-born population - Brazil (%)
Place of birth for the foreign-born population - Chile (%)
Place of birth for the foreign-born population - Colombia (%)
Place of birth for the foreign-born population - Ecuador (%)
Place of birth for the foreign-born population - Guyana (%)
Place of birth for the foreign-born population - Peru (%)
Place of birth for the foreign-born population - Uruguay (%)
Place of birth for the foreign-born population - Venezuela (%)
Place of birth for the foreign-born population - Other South America (%)
Place of birth for the foreign-born population - Canada (%)
Place of birth for the foreign-born population - Other Northern America (%)
Place of birth for the foreign-born population - Other (%)
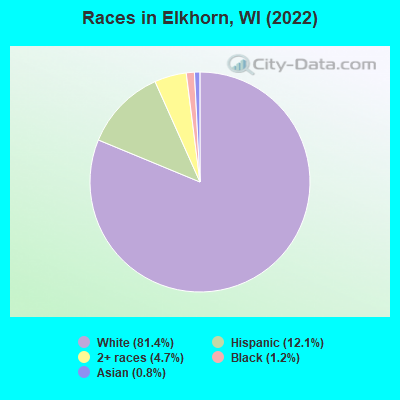
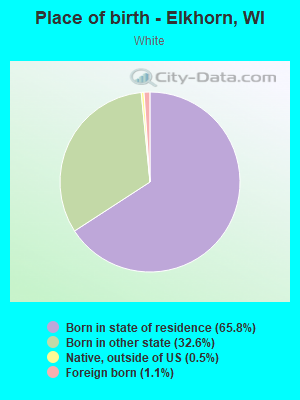
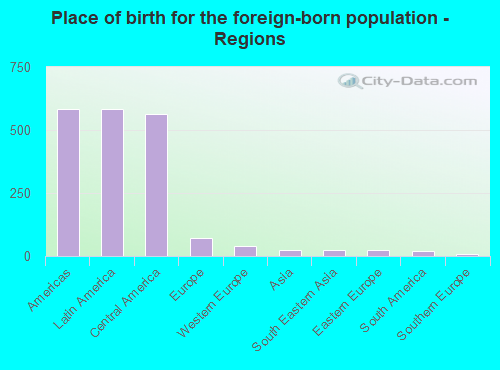
According to 2022 data, the most numerous races in Elkhorn, WI are White alone (8,363 residents), Hispanic (1,248 residents), and Black alone (119 residents). 88.4% of Elkhorn residents speak English at home. 6.7% of Elkhorn, WI residents are foreign-born (5.7% born in Latin America, 0.7% born in Europe), which is 25.0% greater than the foreign-born rate of 5.0% across the entire state of Wisconsin.
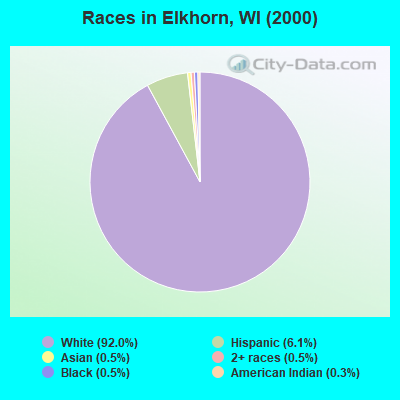
Race distribution in Elkhorn
2000 2022
4,681,630 87.3% White alone 300,245 5.6% Black alone 192,921 3.6% Hispanic 87,995 1.6% Asian alone 51,921 1.0% Two or more races 43,980 0.8% American Indian alone 3,637 0.07% Other race alone 1,346 0.03% Native Hawaiian and Other
4,654,031 79.0% White alone 447,022 7.6% Hispanic 345,678 5.9% Black alone 217,532 3.7% Two or more races 172,242 2.9% Asian alone 33,762 0.6% American Indian alone 19,680 0.3% Other race alone 2,592 0.04% Native Hawaiian and Other
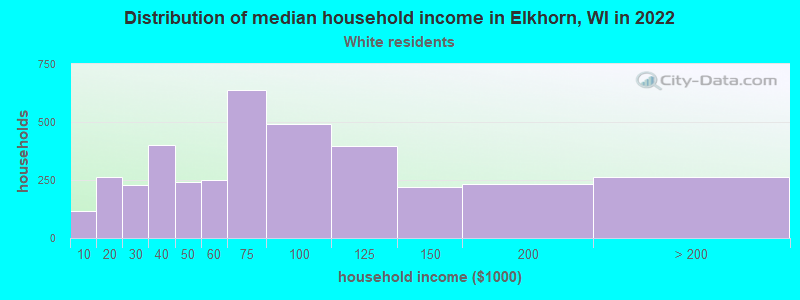
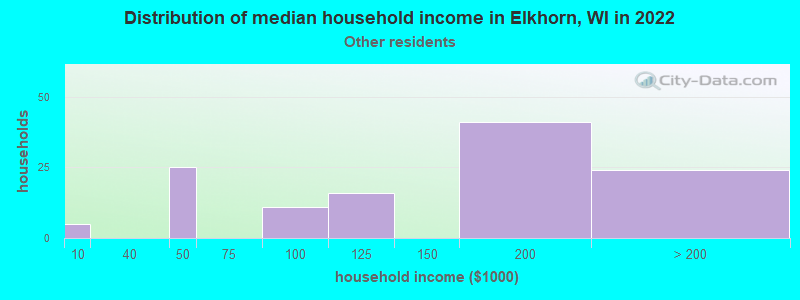
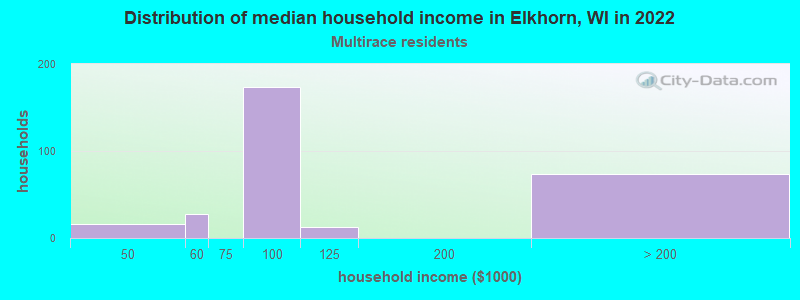
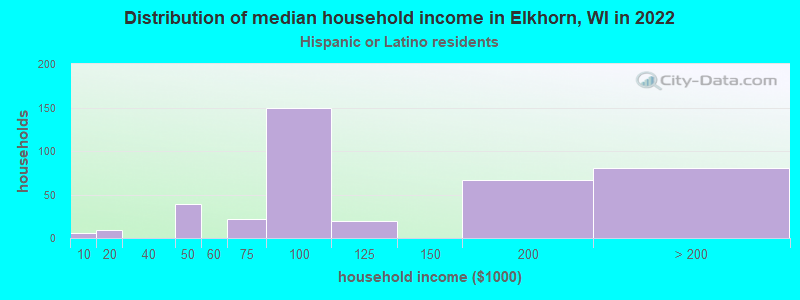
Income and house value in Elkhorn Median household income in 2022 $67,472 White non-Hispanic householders$137,443 Some other race householders$90,373 Two or more races householders$92,169 Hispanic or Latino race householdersMedian 2022 house value $265,016 White Non-Hispanic householders $219,307 Asian householders$288,562 Some other race householders$173,137 Two or more races householders$256,013 Hispanic or Latino householders
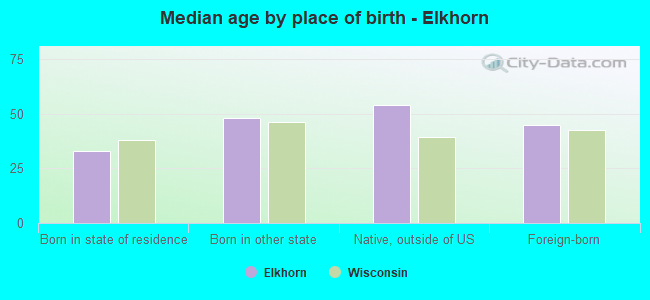
Median age by race in Elkhorn
42.4 Median age for White residents42.7 42.2 27.5 Median age for Black or African American residents41.8 23.2 -729,317,268.3 Median age for American Indian / Alaska Native residents-704,819,276.4 -689,393,938.7 35.1 Median age for Asian residents28.3 -664,845,172.4 -825,688,072.6 Median age for Native Hawaiian / Pacific Islander residents-862,745,097.2 -666,666,666.0 33.5 Median age for Other race residents25.1 31.4 24.7 Median age for Two or more races residents27.1 31.5 41.7 Median age for White alone residents43.1 40.8 35.7 Median age for Hispanic or Latino residents25.1 42.8
Owner/renter occupied households by race in Elkhorn
House owners and renters - White residents 2,050 54.9% Owner occupied1,686 45.1% Renter occupiedHouse owners and renters - Black or African American residents 9 100.0% Renter occupiedHouse owners and renters - Asian residents 42 100.0% Renter occupiedHouse owners and renters - Other race residents 95 79.3% Owner occupied25 20.7% Renter occupiedHouse owners and renters - Two or more races residents 381 100.0% Owner occupiedHouse owners and renters - White alone residents 2,020 53.9% Owner occupied1,725 46.1% Renter occupiedHouse owners and renters - Hispanic or Latino residents 360 89.5% Owner occupied42 10.5% Renter occupied
Language usage in Elkhorn
English speakers - Total 88.4% of residents of Elkhorn speak English at home.
10.4% of residents speak Spanish at home 543 53.6% Speak English very well471 46.4% Speak English less than very well0.7% of residents speak other language at home 73 100.0% Speak English very well
English speakers - Born in the United States 97.9% of residents of Elkhorn speak English at home.
3.0% of residents speak Spanish at home 80 88.9% Speak English very well10 11.1% Speak English less than very well
All residents speak only English at home
English speakers - Foreign-born 13.1% of residents of Elkhorn speak English at home.
86.1% of residents speak Spanish at home 200 31.1% Speak English very well443 68.9% Speak English less than very well3.5% of residents speak other language at home 26 100.0% Speak English very well
White (Caucasian) - Speak only English Native:
98.8% (7,858)Foreign-born:
61.7% (54)
White (Caucasian) - Speak another language Native:
1.4% (111)Foreign-born:
100.0% (88)
Asian - Speak another language Native:
76.8% (45)Foreign-born:
100.0% (28)
Other race - Speak another language Native:
84.2% (87)Foreign-born:
91.6% (197)
Two or more races - Speak only English Native:
63.9% (611)Foreign-born:
7.5% (44)
Two or more races - Speak another language Native:
36.8% (352)Foreign-born:
92.3% (536)
White alone - Speak only English Native:
98.5% (7,869)Foreign-born:
93.9% (49)
White alone - Speak another language Native:
0.9% (74)Foreign-born:
20.5% (11)
Hispanic or Latino - Speak only English Native:
39.1% (217)Foreign-born:
8.9% (63)
Hispanic or Latino - Speak another language Native:
57.6% (320)Foreign-born:
93.7% (666)
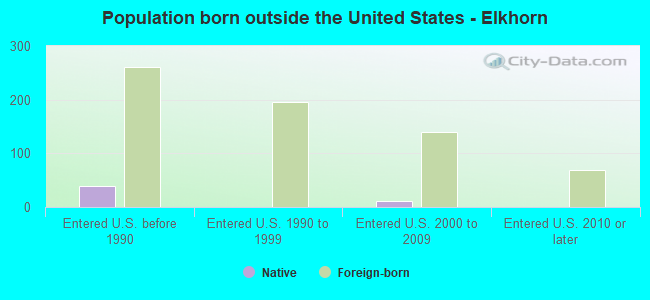
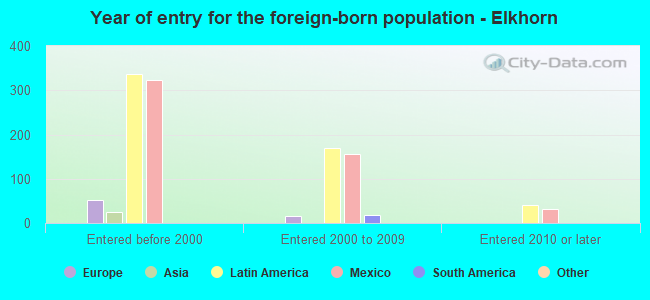
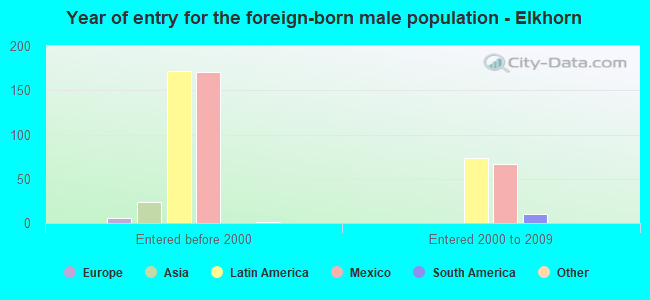
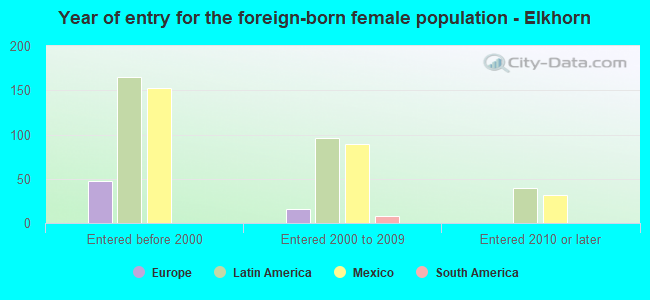
Foreign-born residents in Elkhorn 685 residents are foreign born (5.7% Latin America , 0.7% Europe ).
This city:
6.7%Wisconsin:
5.0%
Marital status for residents in Elkhorn Marital status - White (Caucasian) population 15 years and over
Males 39.3% Never married43.1% Now married1.6% Separated3.5% Widowed12.5% DivorcedFemales 35.9% Never married37.8% Now married0.0% Separated11.6% Widowed14.7% DivorcedWomen who gave birth in the past 12 months Now married:
100.0% (108)Unmarried:
0.0% (0)
Women who did not give birth in the past 12 months Now married:
29.9% (577)Unmarried:
70.1% (1,354)
Marital status - Black or African American population 15 years and over
Males 48.7% Never married41.0% Now married0.0% Separated10.3% Widowed0.0% DivorcedFemales 64.4% Never married35.6% Now married0.0% Separated0.0% Widowed0.0% DivorcedWomen who did not give birth in the past 12 months Now married:
35.6% (30)Unmarried:
64.4% (54)
Marital status - American Indian / Alaska Native population 15 years and over
Males 100.0% Never married0.0% Now married0.0% Separated0.0% Widowed0.0% DivorcedFemales 0.0% Never married100.0% Now married0.0% Separated0.0% Widowed0.0% DivorcedWomen who did not give birth in the past 12 months Now married:
100.0% (4)Unmarried:
0.0% (0)
Marital status - Other race population 15 years and over
Males 52.5% Never married28.8% Now married0.0% Separated0.0% Widowed18.6% DivorcedFemales 17.1% Never married55.2% Now married0.0% Separated0.0% Widowed27.6% DivorcedWomen who did not give birth in the past 12 months Now married:
92.1% (53)Unmarried:
7.9% (5)
Marital status - Two or more races population 15 years and over
Males 34.6% Never married65.4% Now married0.0% Separated0.0% Widowed0.0% DivorcedFemales 25.9% Never married74.1% Now married0.0% Separated0.0% Widowed0.0% DivorcedWomen who did not give birth in the past 12 months Now married:
54.3% (159)Unmarried:
45.7% (134)
Marital status - White alone, not Hispanic / Latino population 15 years and over
Males 38.3% Never married43.4% Now married1.6% Separated3.7% Widowed13.1% DivorcedFemales 36.3% Never married37.2% Now married0.0% Separated11.5% Widowed15.0% DivorcedWomen who gave birth in the past 12 months Now married:
100.0% (113)Unmarried:
0.0% (0)
Women who did not give birth in the past 12 months Now married:
29.0% (576)Unmarried:
71.0% (1,411)
Marital status - Hispanic or Latino population 15 years and over
Males 47.4% Never married46.3% Now married0.0% Separated0.0% Widowed6.3% DivorcedFemales 18.6% Never married72.7% Now married0.0% Separated2.2% Widowed6.5% DivorcedWomen who did not give birth in the past 12 months Now married:
76.4% (193)Unmarried:
23.6% (60)
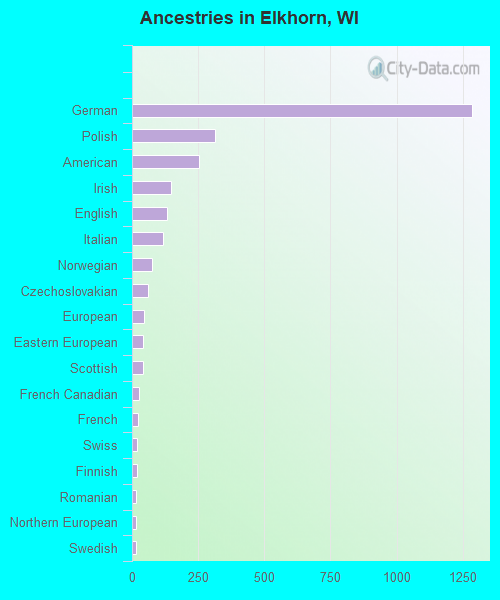
Ancestries in Elkhorn
1,285 31.8% German315 7.8% Polish252 6.2% American146 3.6% Irish134 3.3% English118 2.9% Italian76 1.9% Norwegian60 1.5% Czechoslovakian44 1.1% European41 1.0% Eastern European41 1.0% Scottish26 0.6% French Canadian24 0.6% French20 0.5% Swiss19 0.5% Finnish17 0.4% Romanian14 0.3% Northern European14 0.3% Swedish8 0.2% Welsh6 0.1% Lithuanian6 0.1% Slovak5 0.1% Dutch5 0.1% Scandinavian5 0.1% Ukrainian
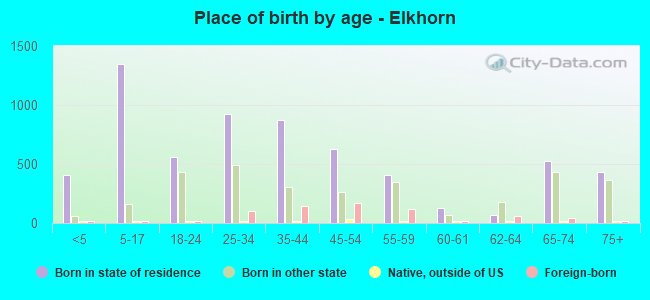
Children Nativity (place of birth) in Elkhorn
Children under 6 years - Living with two parents Both parents native 261 100.0% NativeBoth parents foreign-born 67 100.0% NativeChildren under 6 years - Living with one parent Native parent 222 100.0% NativeChildren 6 to 17 years - Living with two parents Both parents native 690 100.0% NativeBoth parents foreign-born 95 100.0% NativeChildren 6 to 17 years - Living with one parent Native parent 535 100.0% NativeForeign-born parent 49 58.8% Native34 41.2% Foreign-born
Grandparents responsible for own grandchildren in Elkhorn
Grandparents (30 to 59 years) White / Caucasian 14 100.0% Not responsible for grandchildrenTwo or more races 180 100.0% Not responsible for grandchildrenWhite alone, not Hispanic / Latino 15 100.0% Not responsible for grandchildrenHispanic or Latino 95 100.0% Not responsible for grandchildren
Grandparents (60 years and over) White / Caucasian 51 100.0% Not responsible for grandchildrenWhite alone, not Hispanic / Latino 52 100.0% Not responsible for grandchildren