Races in Elkridge, Maryland (MD) Detailed Stats
Data:
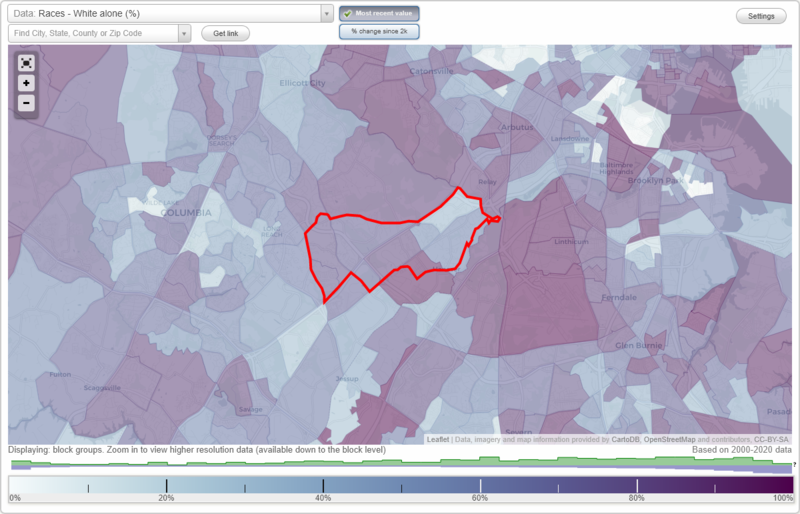
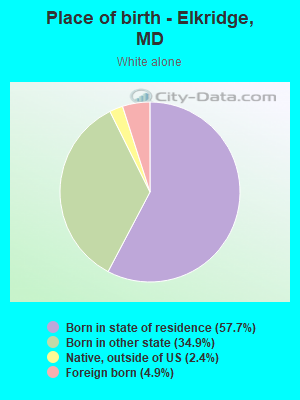
Races - White alone (%)
Races - White alone (% change since 2000)
Races - Black alone (%)
Races - Black alone (% change since 2000)
Races - American Indian alone (%)
Races - American Indian alone (% change since 2000)
Races - Asian alone (%)
Races - Asian alone (% change since 2000)
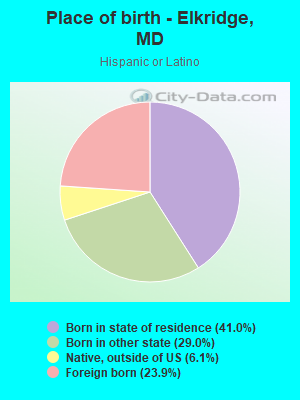
Races - Hispanic (%)
Races - Hispanic (% change since 2000)
Races - Native Hawaiian and Other Pacific Islander alone (%)
Races - Native Hawaiian and Other Pacific Islander alone (% change since 2000)
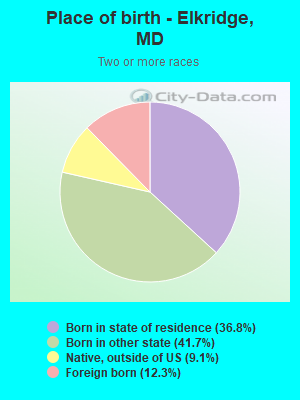
Races - Two or more races(%)
Races - Two or more races(% change since 2000)
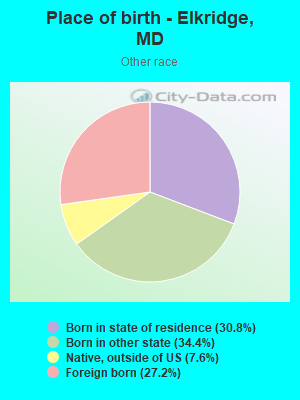
Races - Other race alone (%)
Races - Other race alone (% change since 2000)
Racial diversity
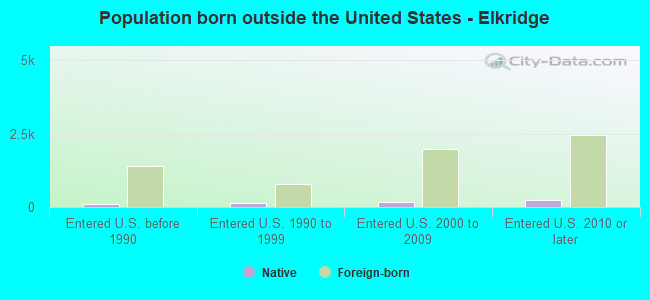
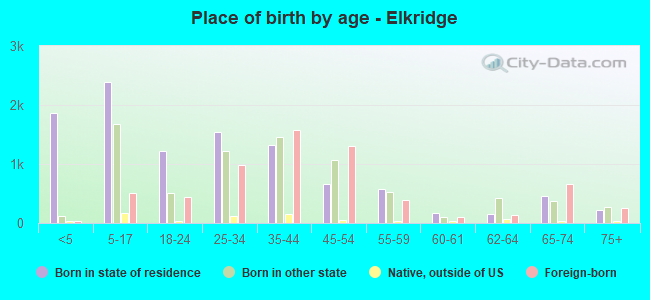
Place of birth - Born in state of residence (%)
Place of birth - Born in state of residence (%) - White
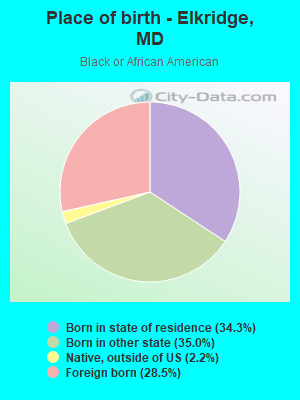
Place of birth - Born in state of residence (%) - Black or African American
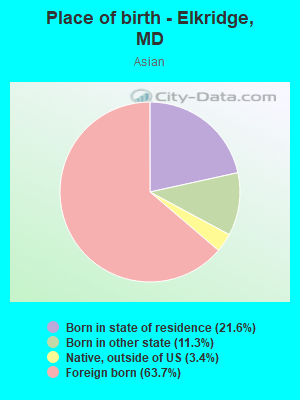
Place of birth - Born in state of residence (%) - Asian
Place of birth - Born in state of residence (%) - Hispanic or Latino
Place of birth - Born in state of residence (%) - American Indian and Alaska Native
Place of birth - Born in state of residence (%) - Multirace
Place of birth - Born in state of residence (%) - Other Race
Place of birth - Born in other state (%)
Place of birth - Born in other state (%) - White
Place of birth - Born in other state (%) - Black or African American
Place of birth - Born in other state (%) - Asian
Place of birth - Born in other state (%) - Hispanic or Latino
Place of birth - Born in other state (%) - American Indian and Alaska Native
Place of birth - Born in other state (%) - Multirace
Place of birth - Born in other state (%) - Other Race
Place of birth - Native, outside of US (%)
Place of birth - Native, outside of US (%) - White
Place of birth - Native, outside of US (%) - Black or African American
Place of birth - Native, outside of US (%) - Asian
Place of birth - Native, outside of US (%) - Hispanic or Latino
Place of birth - Native, outside of US (%) - American Indian and Alaska Native
Place of birth - Native, outside of US (%) - Multirace
Place of birth - Native, outside of US (%) - Other Race
Place of birth - Foreign born (%)
Place of birth - Foreign born (%) - White
Place of birth - Foreign born (%) - Black or African American
Place of birth - Foreign born (%) - Asian
Place of birth - Foreign born (%) - Hispanic or Latino
Place of birth - Foreign born (%) - American Indian and Alaska Native
Place of birth - Foreign born (%) - Multirace
Place of birth - Foreign born (%) - Other Race
Residents speaking English at home (%)
Residents speaking English at home - Born in the United States (%)
Residents speaking English at home - Native, born elsewhere (%)
Residents speaking English at home - Foreign born (%)
Residents speaking Spanish at home (%)
Residents speaking Spanish at home - Born in the United States (%)
Residents speaking Spanish at home - Native, born elsewhere (%)
Residents speaking Spanish at home - Foreign born (%)
Residents speaking other language at home (%)
Residents speaking other language at home - Born in the United States (%)
Residents speaking other language at home - Native, born elsewhere (%)
Residents speaking other language at home - Foreign born (%)
Marital status - Never married (%)
Marital status - Now married (%)
Marital status - Separated (%)
Marital status - Widowed (%)
Marital status - Divorced (%)
Ancestries Reported - Arab (%)
Ancestries Reported - Czech (%)
Ancestries Reported - Danish (%)
Ancestries Reported - Dutch (%)
Ancestries Reported - English (%)
Ancestries Reported - French (%)
Ancestries Reported - French Canadian (%)
Ancestries Reported - German (%)
Ancestries Reported - Greek (%)
Ancestries Reported - Hungarian (%)
Ancestries Reported - Irish (%)
Ancestries Reported - Italian (%)
Ancestries Reported - Lithuanian (%)
Ancestries Reported - Norwegian (%)
Ancestries Reported - Polish (%)
Ancestries Reported - Portuguese (%)
Ancestries Reported - Russian (%)
Ancestries Reported - Scotch-Irish (%)
Ancestries Reported - Scottish (%)
Ancestries Reported - Slovak (%)
Ancestries Reported - Subsaharan African (%)
Ancestries Reported - Swedish (%)
Ancestries Reported - Swiss (%)
Ancestries Reported - Ukrainian (%)
Ancestries Reported - United States (%)
Ancestries Reported - Welsh (%)
Ancestries Reported - West Indian (%)
Ancestries Reported - Other (%)
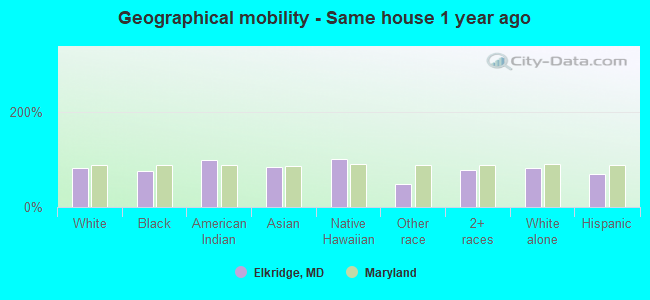
Geographical mobility - Same house 1 year ago (%)
Geographical mobility - Same house 1 year ago (%) - White
Geographical mobility - Same house 1 year ago (%) - Black or African American
Geographical mobility - Same house 1 year ago (%) - Asian
Geographical mobility - Same house 1 year ago (%) - Hispanic or Latino
Geographical mobility - Same house 1 year ago (%) - American Indian and Alaska Native
Geographical mobility - Same house 1 year ago (%) - Multirace
Geographical mobility - Same house 1 year ago (%) - Other Race
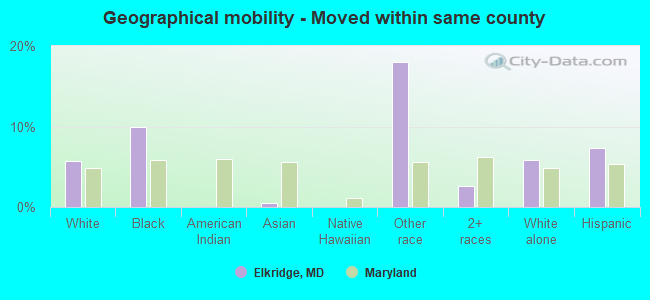
Geographical mobility - Moved within same county (%)
Geographical mobility - Moved within same county (%) - White
Geographical mobility - Moved within same county (%) - Black or African American
Geographical mobility - Moved within same county (%) - Asian
Geographical mobility - Moved within same county (%) - Hispanic or Latino
Geographical mobility - Moved within same county (%) - American Indian and Alaska Native
Geographical mobility - Moved within same county (%) - Multirace
Geographical mobility - Moved within same county (%) - Other Race
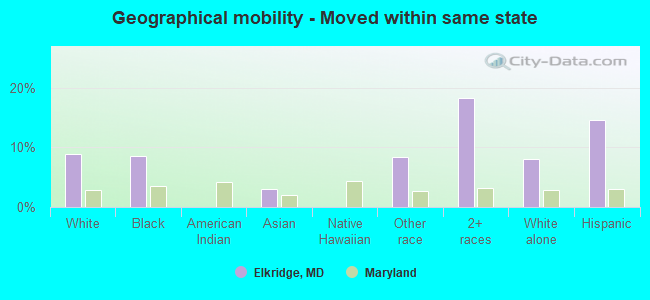
Geographical mobility - Moved from different county within same state (%)
Geographical mobility - Moved from different county within same state (%) - White
Geographical mobility - Moved from different county within same state (%) - Black or African American
Geographical mobility - Moved from different county within same state (%) - Asian
Geographical mobility - Moved from different county within same state (%) - Hispanic or Latino
Geographical mobility - Moved from different county within same state (%) - American Indian and Alaska Native
Geographical mobility - Moved from different county within same state (%) - Multirace
Geographical mobility - Moved from different county within same state (%) - Other Race
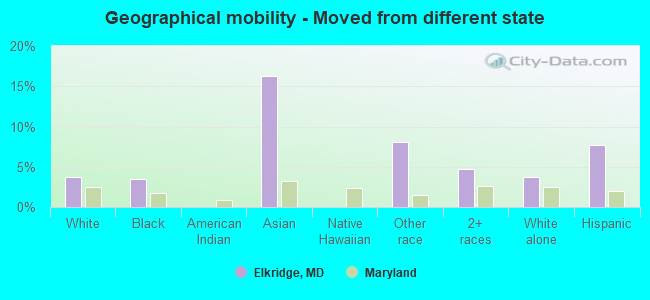
Geographical mobility - Moved from different state (%)
Geographical mobility - Moved from different state (%) - White
Geographical mobility - Moved from different state (%) - Black or African American
Geographical mobility - Moved from different state (%) - Asian
Geographical mobility - Moved from different state (%) - Hispanic or Latino
Geographical mobility - Moved from different state (%) - American Indian and Alaska Native
Geographical mobility - Moved from different state (%) - Multirace
Geographical mobility - Moved from different state (%) - Other Race
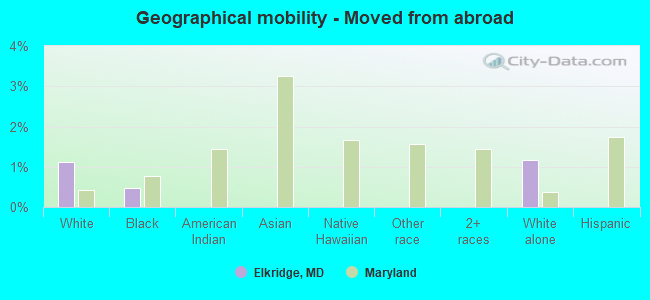
Geographical mobility - Moved from abroad (%)
Geographical mobility - Moved from abroad (%) - White
Geographical mobility - Moved from abroad (%) - Black or African American
Geographical mobility - Moved from abroad (%) - Asian
Geographical mobility - Moved from abroad (%) - Hispanic or Latino
Geographical mobility - Moved from abroad (%) - American Indian and Alaska Native
Geographical mobility - Moved from abroad (%) - Multirace
Geographical mobility - Moved from abroad (%) - Other Race
Place of birth for the foreign-born population - Ireland (%)
Place of birth for the foreign-born population - Denmark (%)
Place of birth for the foreign-born population - Norway (%)
Place of birth for the foreign-born population - Sweden (%)
Place of birth for the foreign-born population - United Kingdom (%)
Place of birth for the foreign-born population - England (%)
Place of birth for the foreign-born population - Scotland (%)
Place of birth for the foreign-born population - Other Northern Europe (%)
Place of birth for the foreign-born population - Austria (%)
Place of birth for the foreign-born population - Belgium (%)
Place of birth for the foreign-born population - France (%)
Place of birth for the foreign-born population - Germany (%)
Place of birth for the foreign-born population - Netherlands (%)
Place of birth for the foreign-born population - Switzerland (%)
Place of birth for the foreign-born population - Other Western Europe (%)
Place of birth for the foreign-born population - Greece (%)
Place of birth for the foreign-born population - Italy (%)
Place of birth for the foreign-born population - Portugal (%)
Place of birth for the foreign-born population - Spain (%)
Place of birth for the foreign-born population - Other Southern Europe (%)
Place of birth for the foreign-born population - Albania (%)
Place of birth for the foreign-born population - Belarus (%)
Place of birth for the foreign-born population - Bosnia and Herzegovina (%)
Place of birth for the foreign-born population - Bulgaria (%)
Place of birth for the foreign-born population - Croatia (%)
Place of birth for the foreign-born population - Czechoslovakia (%)
Place of birth for the foreign-born population - Hungary (%)
Place of birth for the foreign-born population - Latvia (%)
Place of birth for the foreign-born population - Lithuania (%)
Place of birth for the foreign-born population - North Macedonia (Macedonia) (%)
Place of birth for the foreign-born population - Moldova (%)
Place of birth for the foreign-born population - Poland (%)
Place of birth for the foreign-born population - Romania (%)
Place of birth for the foreign-born population - Russia (%)
Place of birth for the foreign-born population - Serbia (%)
Place of birth for the foreign-born population - Ukraine (%)
Place of birth for the foreign-born population - Other Eastern Europe (%)
Place of birth for the foreign-born population - China (%)
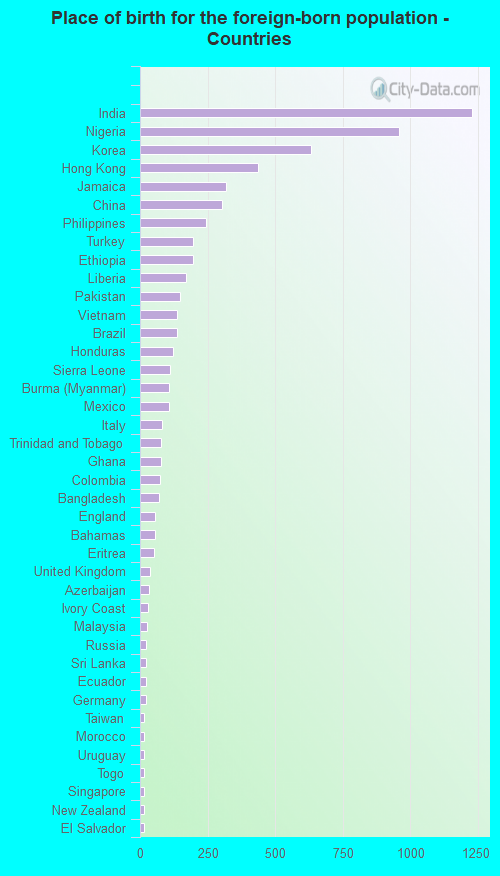
Place of birth for the foreign-born population - Hong Kong (%)
Place of birth for the foreign-born population - Taiwan (%)
Place of birth for the foreign-born population - Japan (%)
Place of birth for the foreign-born population - Korea (%)
Place of birth for the foreign-born population - Other Eastern Asia (%)
Place of birth for the foreign-born population - Afghanistan (%)
Place of birth for the foreign-born population - Bangladesh (%)
Place of birth for the foreign-born population - India (%)
Place of birth for the foreign-born population - Iran (%)
Place of birth for the foreign-born population - Kazakhstan (%)
Place of birth for the foreign-born population - Nepal (%)
Place of birth for the foreign-born population - Pakistan (%)
Place of birth for the foreign-born population - Sri Lanka (%)
Place of birth for the foreign-born population - Uzbekistan (%)
Place of birth for the foreign-born population - Other South Central Asia (%)
Place of birth for the foreign-born population - Burma (%)
Place of birth for the foreign-born population - Cambodia (%)
Place of birth for the foreign-born population - Indonesia (%)
Place of birth for the foreign-born population - Laos (%)
Place of birth for the foreign-born population - Malaysia (%)
Place of birth for the foreign-born population - Philippines (%)
Place of birth for the foreign-born population - Singapore (%)
Place of birth for the foreign-born population - Thailand (%)
Place of birth for the foreign-born population - Vietnam (%)
Place of birth for the foreign-born population - Other South Eastern Asia (%)
Place of birth for the foreign-born population - Armenia (%)
Place of birth for the foreign-born population - Iraq (%)
Place of birth for the foreign-born population - Israel (%)
Place of birth for the foreign-born population - Jordan (%)
Place of birth for the foreign-born population - Kuwait (%)
Place of birth for the foreign-born population - Lebanon (%)
Place of birth for the foreign-born population - Saudi Arabia (%)
Place of birth for the foreign-born population - Syria (%)
Place of birth for the foreign-born population - Turkey (%)
Place of birth for the foreign-born population - Yemen (%)
Place of birth for the foreign-born population - Other Western Asia (%)
Place of birth for the foreign-born population - Eritrea (%)
Place of birth for the foreign-born population - Ethiopia (%)
Place of birth for the foreign-born population - Kenya (%)
Place of birth for the foreign-born population - Somalia (%)
Place of birth for the foreign-born population - Uganda (%)
Place of birth for the foreign-born population - Zimbabwe (%)
Place of birth for the foreign-born population - Other Eastern Africa (%)
Place of birth for the foreign-born population - Cameroon (%)
Place of birth for the foreign-born population - Congo (%)
Place of birth for the foreign-born population - Democratic Republic of Congo (Zaire) (%)
Place of birth for the foreign-born population - Other Middle Africa (%)
Place of birth for the foreign-born population - Egypt (%)
Place of birth for the foreign-born population - Morocco (%)
Place of birth for the foreign-born population - Sudan (%)
Place of birth for the foreign-born population - Other Northern Africa (%)
Place of birth for the foreign-born population - South Africa (%)
Place of birth for the foreign-born population - Other Southern Africa (%)
Place of birth for the foreign-born population - Cabo Verde (%)
Place of birth for the foreign-born population - Ghana (%)
Place of birth for the foreign-born population - Liberia (%)
Place of birth for the foreign-born population - Nigeria (%)
Place of birth for the foreign-born population - Senegal (%)
Place of birth for the foreign-born population - Sierra Leone (%)
Place of birth for the foreign-born population - Other Western Africa (%)
Place of birth for the foreign-born population - Australia (%)
Place of birth for the foreign-born population - New Zealand (%)
Place of birth for the foreign-born population - Fiji (%)
Place of birth for the foreign-born population - Micronesia (%)
Place of birth for the foreign-born population - Bahamas (%)
Place of birth for the foreign-born population - Barbados (%)
Place of birth for the foreign-born population - Cuba (%)
Place of birth for the foreign-born population - Dominica (%)
Place of birth for the foreign-born population - Dominican Republic (%)
Place of birth for the foreign-born population - Grenada (%)
Place of birth for the foreign-born population - Haiti (%)
Place of birth for the foreign-born population - Jamaica (%)
Place of birth for the foreign-born population - St. Vincent and the Grenadines (%)
Place of birth for the foreign-born population - Trinidad and Tobago (%)
Place of birth for the foreign-born population - West Indies (%)
Place of birth for the foreign-born population - Other Caribbean (%)
Place of birth for the foreign-born population - Belize (%)
Place of birth for the foreign-born population - Costa Rica (%)
Place of birth for the foreign-born population - El Salvador (%)
Place of birth for the foreign-born population - Guatemala (%)
Place of birth for the foreign-born population - Honduras (%)
Place of birth for the foreign-born population - Mexico (%)
Place of birth for the foreign-born population - Nicaragua (%)
Place of birth for the foreign-born population - Panama (%)
Place of birth for the foreign-born population - Other Central America (%)
Place of birth for the foreign-born population - Argentina (%)
Place of birth for the foreign-born population - Bolivia (%)
Place of birth for the foreign-born population - Brazil (%)
Place of birth for the foreign-born population - Chile (%)
Place of birth for the foreign-born population - Colombia (%)
Place of birth for the foreign-born population - Ecuador (%)
Place of birth for the foreign-born population - Guyana (%)
Place of birth for the foreign-born population - Peru (%)
Place of birth for the foreign-born population - Uruguay (%)
Place of birth for the foreign-born population - Venezuela (%)
Place of birth for the foreign-born population - Other South America (%)
Place of birth for the foreign-born population - Canada (%)
Place of birth for the foreign-born population - Other Northern America (%)
Place of birth for the foreign-born population - Other (%)
Latest news about races in Elkridge, MD collected exclusively by city-data.com from local newspapers, TV, and radio stations
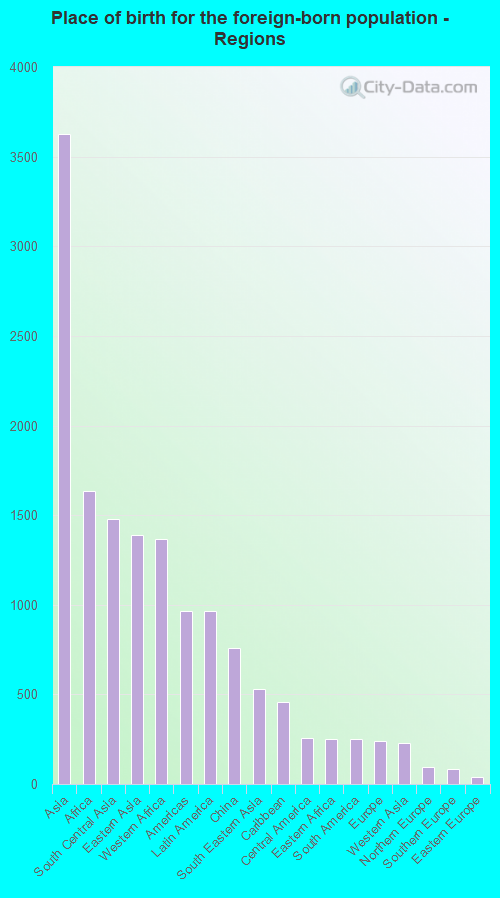
According to 2022 data, the most numerous races in Elkridge, MD are White alone (9,364 residents), Black alone (8,296 residents), and Hispanic (1,462 residents). 73.7% of Elkridge residents speak English at home. 25.4% of Elkridge, MD residents are foreign-born (13.5% born in Asia, 6.1% born in Africa, 3.6% born in Latin America), which is 37.0% greater than the foreign-born rate of 16.0% across the entire state of Maryland.
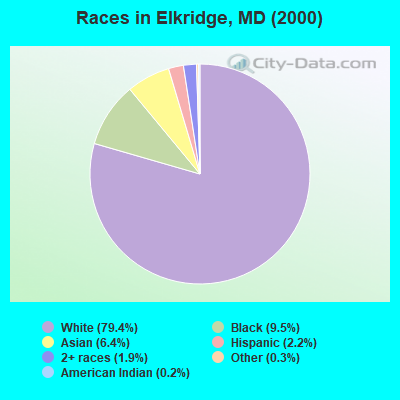
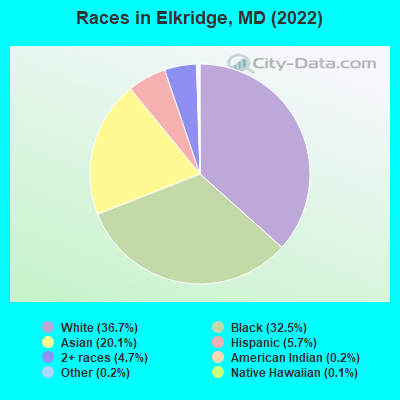
Race distribution in Elkridge
2000 2022
3,286,547 62.1% White alone 1,464,735 27.7% Black alone 227,916 4.3% Hispanic 209,738 4.0% Asian alone 82,946 1.6% Two or more races 13,312 0.3% American Indian alone 9,379 0.2% Other race alone 1,913 0.04% Native Hawaiian and Other
2,906,492 47.1% White alone 1,800,914 29.2% Black alone 705,842 11.4% Hispanic 401,818 6.5% Asian alone 291,317 4.7% Two or more races 46,930 0.8% Other race alone 8,930 0.1% American Indian alone 2,417 0.04% Native Hawaiian and Other
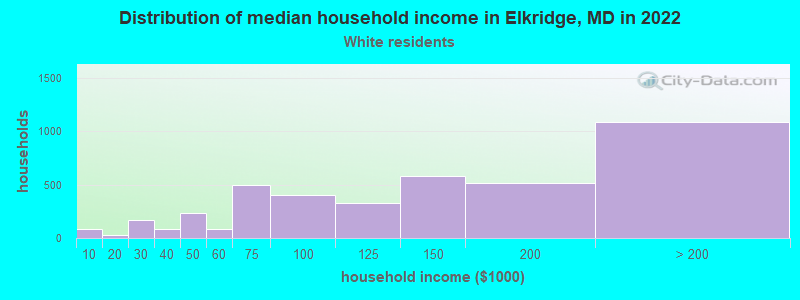
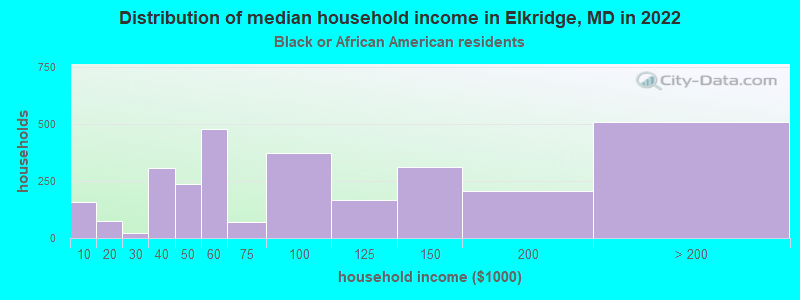
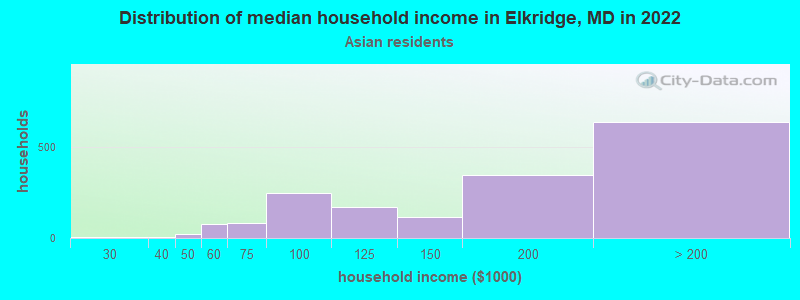
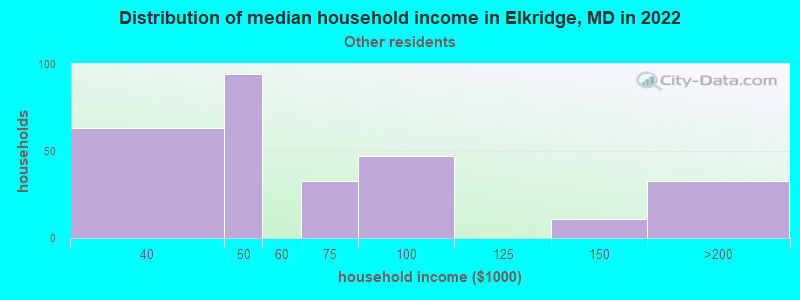
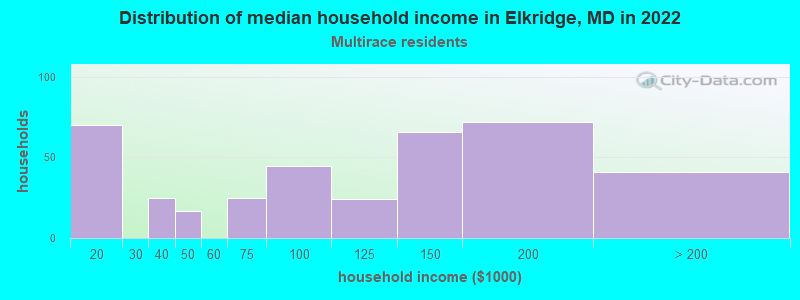
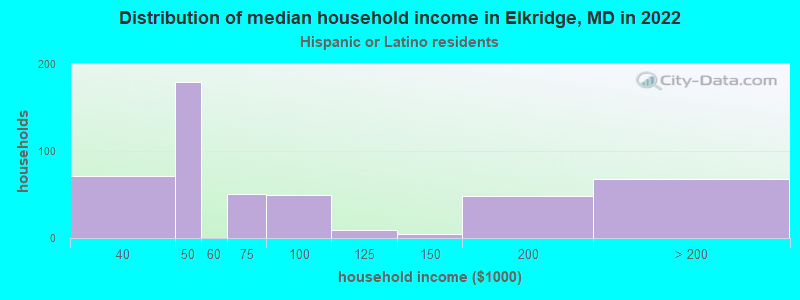
Income and house value in Elkridge Median household income in 2022 $126,874 White non-Hispanic householders$86,503 Black householders$171,737 Asian householders$111,677 Two or more races householders$63,279 Hispanic or Latino race householdersMedian 2022 house value $468,588 White Non-Hispanic householders$480,717 Black or African American householders$908,482 American Indian or Alaska Native householders $511,779 Asian householders$485,450 Some other race householders$351,441 Two or more races householders$427,764 Hispanic or Latino householders
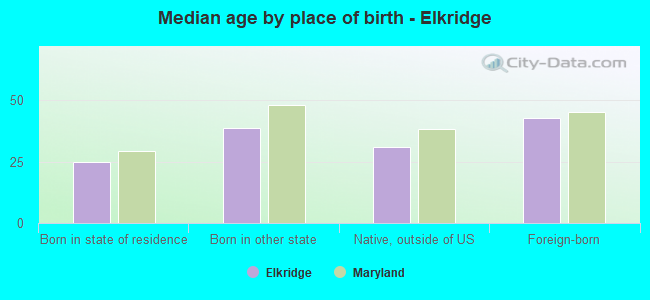
Median age by race in Elkridge
37.0 Median age for White residents36.8 38.2 30.0 Median age for Black or African American residents30.4 30.8 -617,131,062.3 Median age for American Indian / Alaska Native residents-634,408,601.5 -953,703,702.8 38.8 Median age for Asian residents38.3 38.9 -763,333,332.6 Median age for Native Hawaiian / Pacific Islander residents-720,061,021.4 -760,942,760.2 21.7 Median age for Other race residents31.7 21.9 24.3 Median age for Two or more races residents15.3 31.7 37.7 Median age for White alone residents36.3 38.2 21.8 Median age for Hispanic or Latino residents19.5 27.2
Owner/renter occupied households by race in Elkridge
House owners and renters - White residents 2,953 72.7% Owner occupied1,107 27.3% Renter occupiedHouse owners and renters - Black or African American residents 1,016 36.7% Owner occupied1,750 63.3% Renter occupiedHouse owners and renters - Asian residents 1,372 81.8% Owner occupied305 18.2% Renter occupiedHouse owners and renters - Other race residents 106 30.5% Owner occupied241 69.5% Renter occupiedHouse owners and renters - Two or more races residents 226 66.8% Owner occupied112 33.2% Renter occupiedHouse owners and renters - White alone residents 2,957 72.0% Owner occupied1,151 28.0% Renter occupiedHouse owners and renters - Hispanic or Latino residents 173 45.6% Owner occupied206 54.4% Renter occupied
Language usage in Elkridge
English speakers - Total 73.7% of residents of Elkridge speak English at home.
4.9% of residents speak Spanish at home 1,032 89.5% Speak English very well121 10.5% Speak English less than very well21.4% of residents speak other language at home 3,847 76.5% Speak English very well1,183 23.5% Speak English less than very well
English speakers - Born in the United States 91.7% of residents of Elkridge speak English at home.
3.4% of residents speak Spanish at home 242 92.7% Speak English very well19 7.3% Speak English less than very well4.7% of residents speak other language at home 366 100.0% Speak English very well
English speakers - Native, born elsewhere 65.5% of residents of Elkridge speak English at home.
16.0% of residents speak Spanish at home 80 77.7% Speak English very well23 22.3% Speak English less than very well16.9% of residents speak other language at home 34 31.2% Speak English very well75 68.8% Speak English less than very well
English speakers - Foreign-born 33.7% of residents of Elkridge speak English at home.
6.6% of residents speak Spanish at home 369 86.6% Speak English very well57 13.4% Speak English less than very well61.0% of residents speak other language at home 2,892 73.6% Speak English very well1,037 26.4% Speak English less than very well
White (Caucasian) - Speak only English Native:
95.6% (8,121)Foreign-born:
28.7% (129)
White (Caucasian) - Speak another language Native:
4.4% (375)Foreign-born:
71.4% (322)
Black or African American - Speak only English Native:
96.0% (5,108)Foreign-born:
55.6% (1,376)
Black or African American - Speak another language Native:
4.1% (220)Foreign-born:
34.3% (849)
Asian - Speak only English Native:
57.9% (803)Foreign-born:
12.5% (406)
Asian - Speak another language Native:
42.2% (585)Foreign-born:
86.7% (2,821)
Other race - Speak only English Native:
19.0% (77)Foreign-born:
10.0% (17)
Other race - Speak another language Native:
96.9% (394)Foreign-born:
90.0% (154)
Two or more races - Speak only English Native:
80.3% (1,129)Foreign-born:
15.3% (35)
Two or more races - Speak another language Native:
18.7% (262)Foreign-born:
80.8% (186)
White alone - Speak only English Native:
95.8% (8,149)Foreign-born:
29.0% (134)
White alone - Speak another language Native:
4.4% (372)Foreign-born:
70.9% (327)
Hispanic or Latino - Speak only English Native:
23.8% (204)Foreign-born:
6.1% (22)
Hispanic or Latino - Speak another language Native:
86.6% (743)Foreign-born:
90.0% (321)
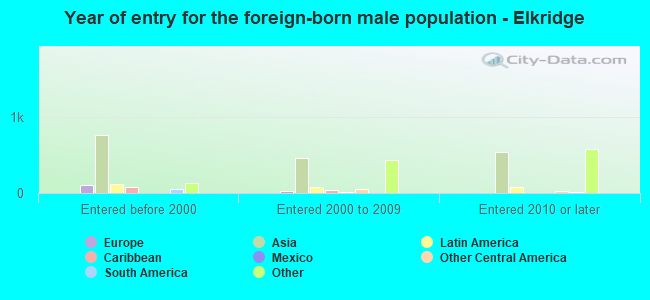
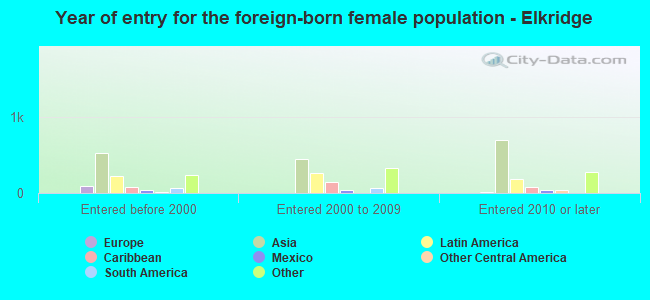
Foreign-born residents in Elkridge 6,479 residents are foreign born (13.5% Asia , 6.1% Africa , 3.6% Latin America ).
This city:
25.4%Maryland:
15.7%
Marital status for residents in Elkridge Marital status - White (Caucasian) population 15 years and over
Males 32.5% Never married57.5% Now married1.1% Separated1.4% Widowed7.6% DivorcedFemales 29.8% Never married50.5% Now married2.3% Separated5.9% Widowed11.5% DivorcedWomen who gave birth in the past 12 months Now married:
44.3% (36)Unmarried:
55.7% (46)
Women who did not give birth in the past 12 months Now married:
47.9% (1,051)Unmarried:
52.1% (1,145)
Marital status - Black or African American population 15 years and over
Males 41.4% Never married39.1% Now married0.0% Separated8.2% Widowed11.3% DivorcedFemales 47.5% Never married26.3% Now married9.5% Separated2.9% Widowed13.8% DivorcedWomen who gave birth in the past 12 months Now married:
43.3% (53)Unmarried:
56.7% (69)
Women who did not give birth in the past 12 months Now married:
35.1% (869)Unmarried:
64.9% (1,609)
Marital status - Asian population 15 years and over
Males 18.5% Never married78.0% Now married0.0% Separated1.2% Widowed2.3% DivorcedFemales 21.4% Never married70.4% Now married1.0% Separated5.3% Widowed1.8% DivorcedWomen who gave birth in the past 12 months Now married:
100.0% (220)Unmarried:
0.0% (0)
Women who did not give birth in the past 12 months Now married:
65.3% (788)Unmarried:
34.7% (419)
Marital status - Other race population 15 years and over
Males 20.0% Never married54.0% Now married26.0% Separated0.0% Widowed0.0% DivorcedFemales 49.1% Never married25.7% Now married5.6% Separated0.0% Widowed19.6% DivorcedWomen who gave birth in the past 12 months Now married:
100.0% (29)Unmarried:
0.0% (0)
Women who did not give birth in the past 12 months Now married:
24.6% (74)Unmarried:
75.4% (227)
Marital status - Two or more races population 15 years and over
Males 58.1% Never married27.7% Now married0.0% Separated0.0% Widowed14.2% DivorcedFemales 36.2% Never married45.5% Now married6.4% Separated0.0% Widowed12.0% DivorcedWomen who gave birth in the past 12 months Now married:
100.0% (11)Unmarried:
0.0% (0)
Women who did not give birth in the past 12 months Now married:
43.0% (207)Unmarried:
57.0% (274)
Marital status - White alone, not Hispanic / Latino population 15 years and over
Males 31.7% Never married57.9% Now married1.1% Separated1.4% Widowed7.8% DivorcedFemales 28.8% Never married51.3% Now married2.3% Separated6.1% Widowed11.4% DivorcedWomen who gave birth in the past 12 months Now married:
44.3% (38)Unmarried:
55.7% (48)
Women who did not give birth in the past 12 months Now married:
49.6% (1,092)Unmarried:
50.4% (1,110)
Marital status - Hispanic or Latino population 15 years and over
Males 43.5% Never married46.6% Now married3.7% Separated0.0% Widowed6.3% DivorcedFemales 38.1% Never married31.9% Now married13.8% Separated0.0% Widowed16.1% DivorcedWomen who gave birth in the past 12 months Now married:
100.0% (49)Unmarried:
0.0% (0)
Women who did not give birth in the past 12 months Now married:
35.1% (154)Unmarried:
64.9% (284)
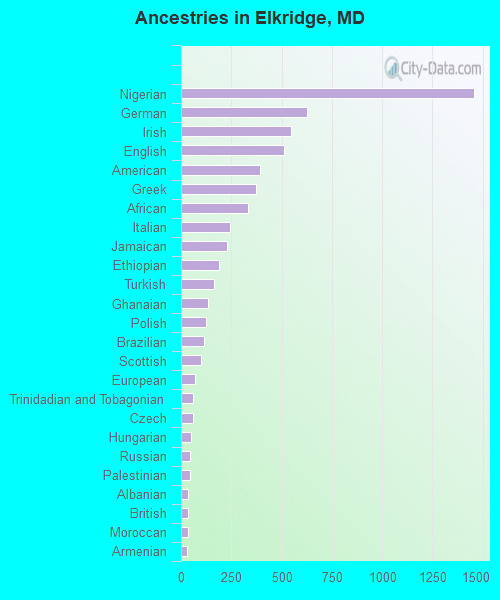
Ancestries in Elkridge
1,459 9.4% Nigerian626 4.0% German547 3.5% Irish512 3.3% English393 2.5% American372 2.4% Greek334 2.2% African242 1.6% Italian229 1.5% Jamaican188 1.2% Ethiopian165 1.1% Turkish135 0.9% Ghanaian125 0.8% Polish115 0.7% Brazilian99 0.6% Scottish70 0.5% European61 0.4% Trinidadian and Tobagonian59 0.4% Czech52 0.3% Hungarian46 0.3% Russian44 0.3% Palestinian37 0.2% Albanian35 0.2% British34 0.2% Moroccan32 0.2% Armenian29 0.2% Slavic21 0.1% Portuguese18 0.1% French17 0.1% Norwegian16 0.1% Swedish13 0.08% Scandinavian8 0.05% Cape Verdean
Geographical mobility in Elkridge Same house 1 year ago 7,608 81.7% White (Caucasian)5,954 75.2% Black or African American83 98.9% American Indian / Alaska Native4,050 82.8% Asian21 100.0% Native Hawaiian / Pacific Islander298 49.4% Other race1,467 78.2% Two or more races7,665 82.3% White alone, not Hispanic / Latino956 69.5% Hispanic or LatinoMoved within same county 538 5.8% White / Caucasian787 9.9% Black or African American22 0.4% Asian109 18.0% Other race50 2.7% Two or more races546 5.9% White alone, not Hispanic / Latino100 7.3% Hispanic or LatinoMoved within same state 830 8.9% White / Caucasian674 8.5% Black or African American150 3.1% Asian51 8.4% Other race342 18.2% Two or more races743 8.0% White alone, not Hispanic / Latino200 14.5% Hispanic or LatinoMoved from different state 348 3.7% White / Caucasian272 3.4% Black or African American794 16.2% Asian49 8.1% Other race89 4.7% Two or more races351 3.8% White alone, not Hispanic / Latino106 7.7% Hispanic or LatinoMoved from abroad 104 1.1% White37 0.5% Black or African American109 1.2% White alone, not Hispanic / Latino
Children Nativity (place of birth) in Elkridge
Children under 6 years - Living with two parents Both parents native 676 100.0% NativeBoth parents foreign-born 472 100.0% NativeOne native, one foreign-born parent 455 100.0% NativeChildren under 6 years - Living with one parent Native parent 411 100.0% NativeForeign-born parent 94 100.0% NativeChildren 6 to 17 years - Living with two parents Both parents native 758 100.0% NativeBoth parents foreign-born 581 65.6% Native304 34.4% Foreign-bornOne native, one foreign-born parent 315 89.7% Native36 10.3% Foreign-bornChildren 6 to 17 years - Living with one parent Native parent 951 100.0% NativeForeign-born parent 721 55.5% Native579 44.5% Foreign-born
Grandparents responsible for own grandchildren in Elkridge
Grandparents (30 to 59 years) White / Caucasian 43 51.1% Responsible for grandchildren41 48.9% Not responsible for grandchildrenBlack or African American 82 65.6% Responsible for grandchildren43 34.4% Not responsible for grandchildrenWhite alone, not Hispanic / Latino 44 49.6% Responsible for grandchildren44 50.4% Not responsible for grandchildrenHispanic or Latino 30 100.0% Responsible for grandchildrenGrandparents (60 years and over) White / Caucasian 16 15.6% Responsible for grandchildren85 84.4% Not responsible for grandchildrenBlack or African American 12 10.0% Responsible for grandchildren104 90.0% Not responsible for grandchildrenWhite alone, not Hispanic / Latino 16 14.7% Responsible for grandchildren91 85.3% Not responsible for grandchildren