Races in Elsmere, Colorado (CO) Detailed Stats
Ancestries, Foreign-born residents, place of birth
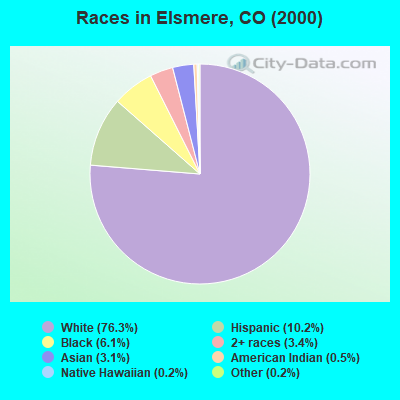
Race distribution in Elsmere

- 21,37776.3%White alone
- 2,85310.2%Hispanic
- 1,6956.1%Black alone
- 9463.4%Two or more races
- 8613.1%Asian alone
- 1430.5%American Indian alone
- 610.2%Other race alone
- 700.2%Native Hawaiian and Other
Pacific Islander alone
2000
2022
-
- 3,202,88074.5%White alone
- 735,60117.1%Hispanic
- 158,4433.7%Black alone
- 93,2772.2%Asian alone
- 72,7211.7%Two or more races
- 28,9820.7%American Indian alone
- 5,5120.1%Other race alone
- 3,8450.09%Native Hawaiian and Other
Pacific Islander alone

-
- 3,793,27065.0%White alone
- 1,314,96222.5%Hispanic
- 268,7544.6%Two or more races
- 220,7563.8%Black alone
- 182,6583.1%Asian alone
- 29,7980.5%Other race alone
- 23,3890.4%American Indian alone
- 6,3390.1%Native Hawaiian and Other
Pacific Islander alone

Income and house value in Elsmere
- Median household income in 2022
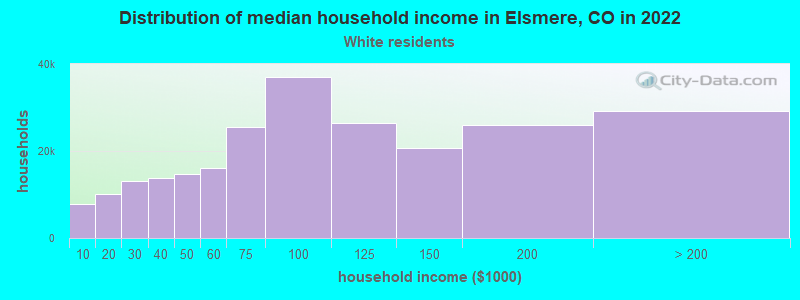
- $98,857White non-Hispanic householders
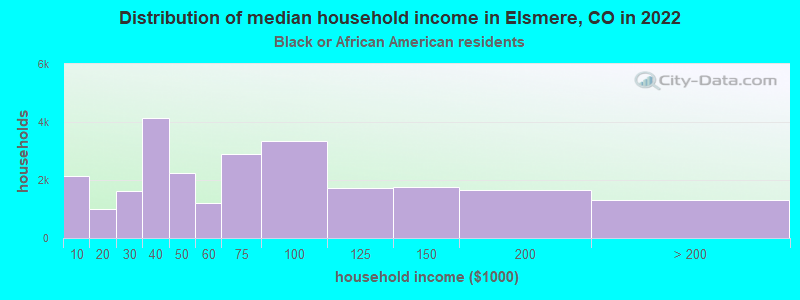
- $99,365Black householders
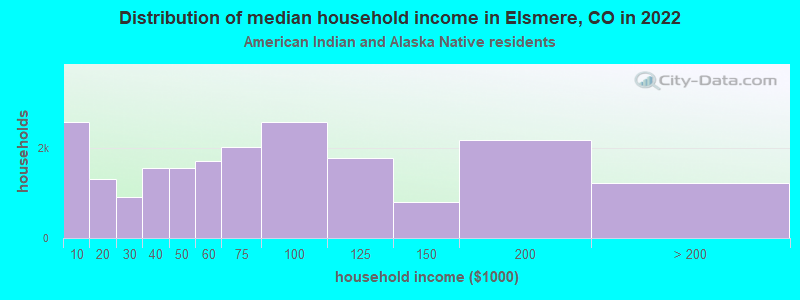
- $100,672American Indian and Alaska Native householders
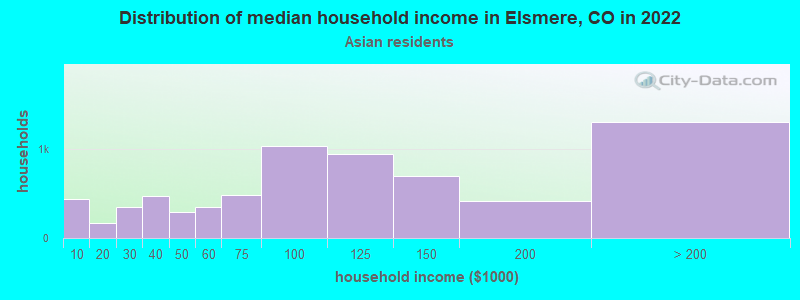
- $105,393Asian householders
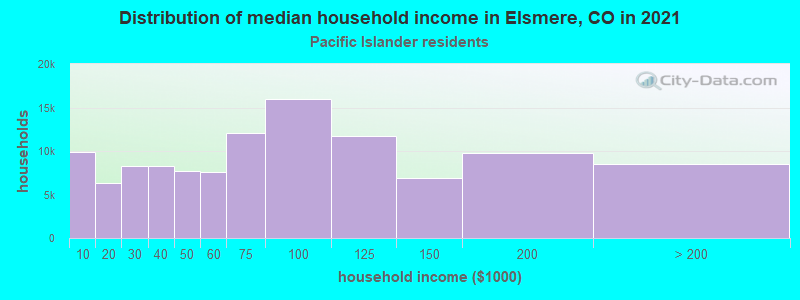
- $70,029Native Hawaiian and other Pacific Islander householders
- $94,427Some other race householders
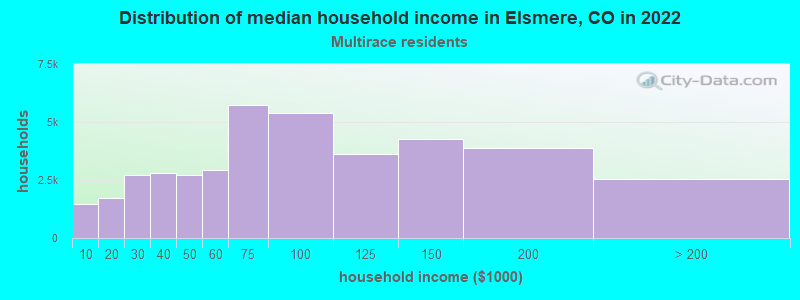
- $99,691Two or more races householders
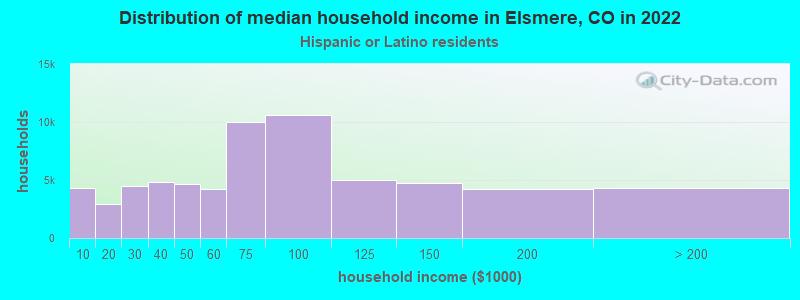
- $116,630Hispanic or Latino race householders
- Median 2022 house value
- $482,999White Non-Hispanic householders
- $466,412Black or African American householders
- $471,720American Indian or Alaska Native householders
- $502,902Asian householders
- $331,730Some other race householders
- $462,100Two or more races householders
- $467,739Hispanic or Latino householders
Household income for White non-Hispanic householders
Household income for Black householders
Household income for American Indian and Alaska Native householders
Household income for Asian householders
Household income for Native Hawaiian and other Pacific Islander householders
Household income for Two or more races householders
Household income for Hispanic or Latino race householders
Zip code: 80915