Races in Emmett, Idaho (ID) Detailed Stats
Data:
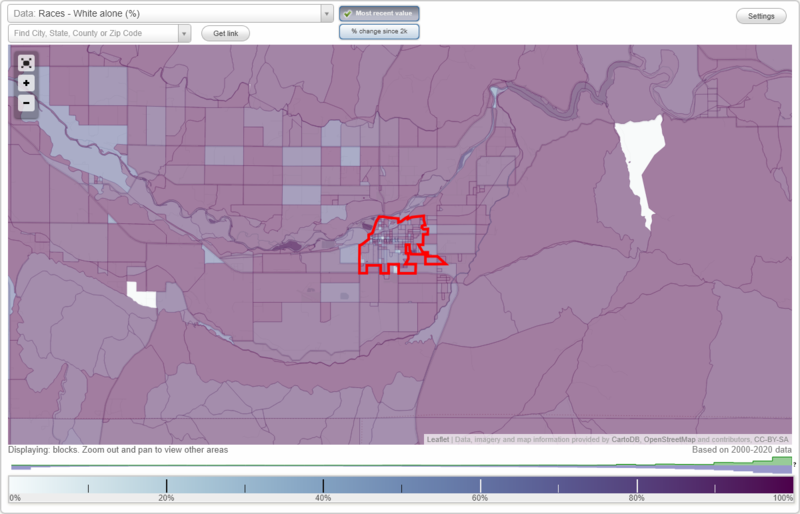
Races - White alone (%)
Races - White alone (% change since 2000)
Races - Black alone (%)
Races - Black alone (% change since 2000)
Races - American Indian alone (%)
Races - American Indian alone (% change since 2000)
Races - Asian alone (%)
Races - Asian alone (% change since 2000)
Races - Hispanic (%)
Races - Hispanic (% change since 2000)
Races - Native Hawaiian and Other Pacific Islander alone (%)
Races - Native Hawaiian and Other Pacific Islander alone (% change since 2000)
Races - Two or more races(%)
Races - Two or more races(% change since 2000)
Races - Other race alone (%)
Races - Other race alone (% change since 2000)
Racial diversity
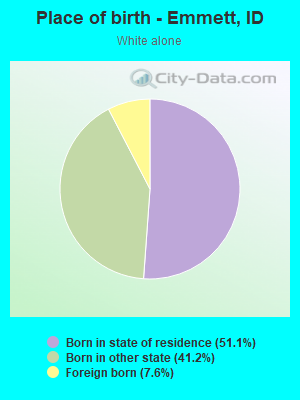
Place of birth - Born in state of residence (%)
Place of birth - Born in state of residence (%) - White
Place of birth - Born in state of residence (%) - Black or African American
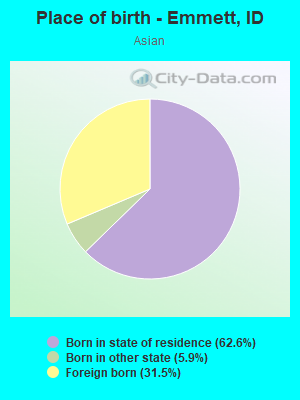
Place of birth - Born in state of residence (%) - Asian
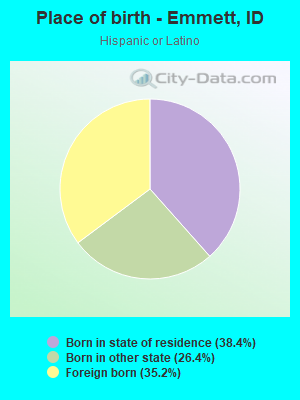
Place of birth - Born in state of residence (%) - Hispanic or Latino
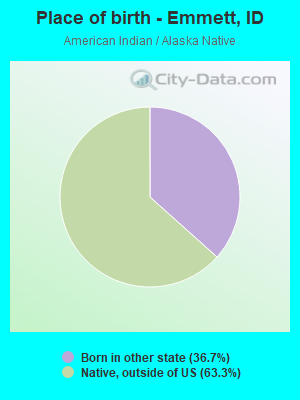
Place of birth - Born in state of residence (%) - American Indian and Alaska Native
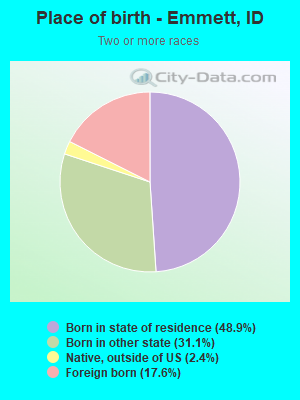
Place of birth - Born in state of residence (%) - Multirace
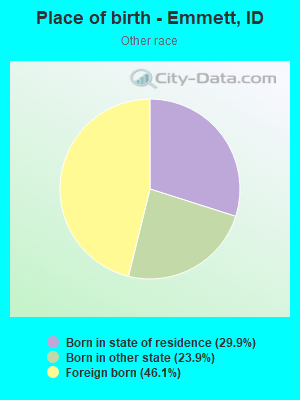
Place of birth - Born in state of residence (%) - Other Race
Place of birth - Born in other state (%)
Place of birth - Born in other state (%) - White
Place of birth - Born in other state (%) - Black or African American
Place of birth - Born in other state (%) - Asian
Place of birth - Born in other state (%) - Hispanic or Latino
Place of birth - Born in other state (%) - American Indian and Alaska Native
Place of birth - Born in other state (%) - Multirace
Place of birth - Born in other state (%) - Other Race
Place of birth - Native, outside of US (%)
Place of birth - Native, outside of US (%) - White
Place of birth - Native, outside of US (%) - Black or African American
Place of birth - Native, outside of US (%) - Asian
Place of birth - Native, outside of US (%) - Hispanic or Latino
Place of birth - Native, outside of US (%) - American Indian and Alaska Native
Place of birth - Native, outside of US (%) - Multirace
Place of birth - Native, outside of US (%) - Other Race
Place of birth - Foreign born (%)
Place of birth - Foreign born (%) - White
Place of birth - Foreign born (%) - Black or African American
Place of birth - Foreign born (%) - Asian
Place of birth - Foreign born (%) - Hispanic or Latino
Place of birth - Foreign born (%) - American Indian and Alaska Native
Place of birth - Foreign born (%) - Multirace
Place of birth - Foreign born (%) - Other Race
Residents speaking English at home (%)
Residents speaking English at home - Born in the United States (%)
Residents speaking English at home - Native, born elsewhere (%)
Residents speaking English at home - Foreign born (%)
Residents speaking Spanish at home (%)
Residents speaking Spanish at home - Born in the United States (%)
Residents speaking Spanish at home - Native, born elsewhere (%)
Residents speaking Spanish at home - Foreign born (%)
Residents speaking other language at home (%)
Residents speaking other language at home - Born in the United States (%)
Residents speaking other language at home - Native, born elsewhere (%)
Residents speaking other language at home - Foreign born (%)
Marital status - Never married (%)
Marital status - Now married (%)
Marital status - Separated (%)
Marital status - Widowed (%)
Marital status - Divorced (%)
Ancestries Reported - Arab (%)
Ancestries Reported - Czech (%)
Ancestries Reported - Danish (%)
Ancestries Reported - Dutch (%)
Ancestries Reported - English (%)
Ancestries Reported - French (%)
Ancestries Reported - French Canadian (%)
Ancestries Reported - German (%)
Ancestries Reported - Greek (%)
Ancestries Reported - Hungarian (%)
Ancestries Reported - Irish (%)
Ancestries Reported - Italian (%)
Ancestries Reported - Lithuanian (%)
Ancestries Reported - Norwegian (%)
Ancestries Reported - Polish (%)
Ancestries Reported - Portuguese (%)
Ancestries Reported - Russian (%)
Ancestries Reported - Scotch-Irish (%)
Ancestries Reported - Scottish (%)
Ancestries Reported - Slovak (%)
Ancestries Reported - Subsaharan African (%)
Ancestries Reported - Swedish (%)
Ancestries Reported - Swiss (%)
Ancestries Reported - Ukrainian (%)
Ancestries Reported - United States (%)
Ancestries Reported - Welsh (%)
Ancestries Reported - West Indian (%)
Ancestries Reported - Other (%)
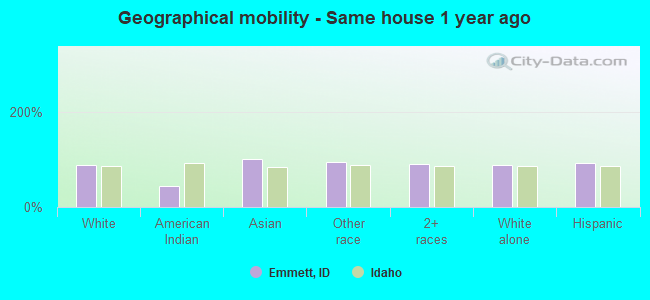
Geographical mobility - Same house 1 year ago (%)
Geographical mobility - Same house 1 year ago (%) - White
Geographical mobility - Same house 1 year ago (%) - Black or African American
Geographical mobility - Same house 1 year ago (%) - Asian
Geographical mobility - Same house 1 year ago (%) - Hispanic or Latino
Geographical mobility - Same house 1 year ago (%) - American Indian and Alaska Native
Geographical mobility - Same house 1 year ago (%) - Multirace
Geographical mobility - Same house 1 year ago (%) - Other Race
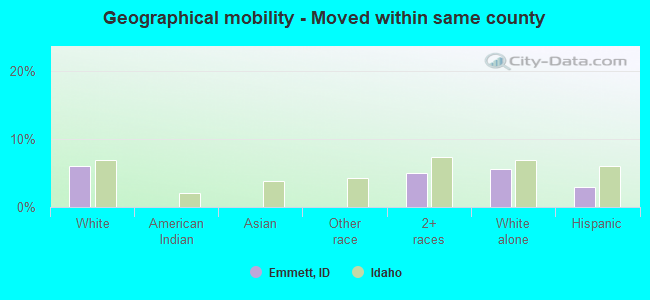
Geographical mobility - Moved within same county (%)
Geographical mobility - Moved within same county (%) - White
Geographical mobility - Moved within same county (%) - Black or African American
Geographical mobility - Moved within same county (%) - Asian
Geographical mobility - Moved within same county (%) - Hispanic or Latino
Geographical mobility - Moved within same county (%) - American Indian and Alaska Native
Geographical mobility - Moved within same county (%) - Multirace
Geographical mobility - Moved within same county (%) - Other Race
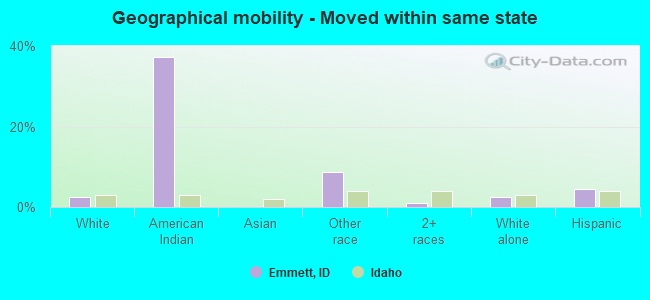
Geographical mobility - Moved from different county within same state (%)
Geographical mobility - Moved from different county within same state (%) - White
Geographical mobility - Moved from different county within same state (%) - Black or African American
Geographical mobility - Moved from different county within same state (%) - Asian
Geographical mobility - Moved from different county within same state (%) - Hispanic or Latino
Geographical mobility - Moved from different county within same state (%) - American Indian and Alaska Native
Geographical mobility - Moved from different county within same state (%) - Multirace
Geographical mobility - Moved from different county within same state (%) - Other Race
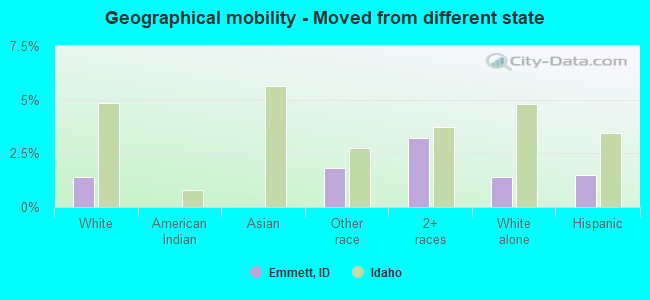
Geographical mobility - Moved from different state (%)
Geographical mobility - Moved from different state (%) - White
Geographical mobility - Moved from different state (%) - Black or African American
Geographical mobility - Moved from different state (%) - Asian
Geographical mobility - Moved from different state (%) - Hispanic or Latino
Geographical mobility - Moved from different state (%) - American Indian and Alaska Native
Geographical mobility - Moved from different state (%) - Multirace
Geographical mobility - Moved from different state (%) - Other Race
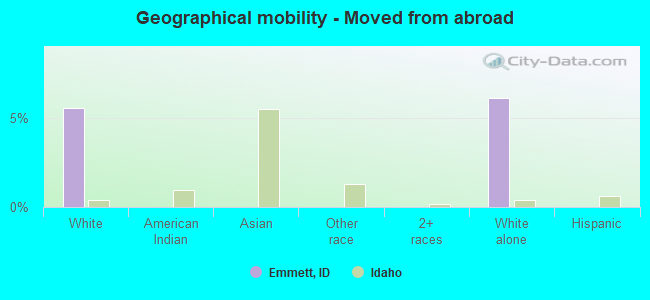
Geographical mobility - Moved from abroad (%)
Geographical mobility - Moved from abroad (%) - White
Geographical mobility - Moved from abroad (%) - Black or African American
Geographical mobility - Moved from abroad (%) - Asian
Geographical mobility - Moved from abroad (%) - Hispanic or Latino
Geographical mobility - Moved from abroad (%) - American Indian and Alaska Native
Geographical mobility - Moved from abroad (%) - Multirace
Geographical mobility - Moved from abroad (%) - Other Race
Place of birth for the foreign-born population - Ireland (%)
Place of birth for the foreign-born population - Denmark (%)
Place of birth for the foreign-born population - Norway (%)
Place of birth for the foreign-born population - Sweden (%)
Place of birth for the foreign-born population - United Kingdom (%)
Place of birth for the foreign-born population - England (%)
Place of birth for the foreign-born population - Scotland (%)
Place of birth for the foreign-born population - Other Northern Europe (%)
Place of birth for the foreign-born population - Austria (%)
Place of birth for the foreign-born population - Belgium (%)
Place of birth for the foreign-born population - France (%)
Place of birth for the foreign-born population - Germany (%)
Place of birth for the foreign-born population - Netherlands (%)
Place of birth for the foreign-born population - Switzerland (%)
Place of birth for the foreign-born population - Other Western Europe (%)
Place of birth for the foreign-born population - Greece (%)
Place of birth for the foreign-born population - Italy (%)
Place of birth for the foreign-born population - Portugal (%)
Place of birth for the foreign-born population - Spain (%)
Place of birth for the foreign-born population - Other Southern Europe (%)
Place of birth for the foreign-born population - Albania (%)
Place of birth for the foreign-born population - Belarus (%)
Place of birth for the foreign-born population - Bosnia and Herzegovina (%)
Place of birth for the foreign-born population - Bulgaria (%)
Place of birth for the foreign-born population - Croatia (%)
Place of birth for the foreign-born population - Czechoslovakia (%)
Place of birth for the foreign-born population - Hungary (%)
Place of birth for the foreign-born population - Latvia (%)
Place of birth for the foreign-born population - Lithuania (%)
Place of birth for the foreign-born population - North Macedonia (Macedonia) (%)
Place of birth for the foreign-born population - Moldova (%)
Place of birth for the foreign-born population - Poland (%)
Place of birth for the foreign-born population - Romania (%)
Place of birth for the foreign-born population - Russia (%)
Place of birth for the foreign-born population - Serbia (%)
Place of birth for the foreign-born population - Ukraine (%)
Place of birth for the foreign-born population - Other Eastern Europe (%)
Place of birth for the foreign-born population - China (%)
Place of birth for the foreign-born population - Hong Kong (%)
Place of birth for the foreign-born population - Taiwan (%)
Place of birth for the foreign-born population - Japan (%)
Place of birth for the foreign-born population - Korea (%)
Place of birth for the foreign-born population - Other Eastern Asia (%)
Place of birth for the foreign-born population - Afghanistan (%)
Place of birth for the foreign-born population - Bangladesh (%)
Place of birth for the foreign-born population - India (%)
Place of birth for the foreign-born population - Iran (%)
Place of birth for the foreign-born population - Kazakhstan (%)
Place of birth for the foreign-born population - Nepal (%)
Place of birth for the foreign-born population - Pakistan (%)
Place of birth for the foreign-born population - Sri Lanka (%)
Place of birth for the foreign-born population - Uzbekistan (%)
Place of birth for the foreign-born population - Other South Central Asia (%)
Place of birth for the foreign-born population - Burma (%)
Place of birth for the foreign-born population - Cambodia (%)
Place of birth for the foreign-born population - Indonesia (%)
Place of birth for the foreign-born population - Laos (%)
Place of birth for the foreign-born population - Malaysia (%)
Place of birth for the foreign-born population - Philippines (%)
Place of birth for the foreign-born population - Singapore (%)
Place of birth for the foreign-born population - Thailand (%)
Place of birth for the foreign-born population - Vietnam (%)
Place of birth for the foreign-born population - Other South Eastern Asia (%)
Place of birth for the foreign-born population - Armenia (%)
Place of birth for the foreign-born population - Iraq (%)
Place of birth for the foreign-born population - Israel (%)
Place of birth for the foreign-born population - Jordan (%)
Place of birth for the foreign-born population - Kuwait (%)
Place of birth for the foreign-born population - Lebanon (%)
Place of birth for the foreign-born population - Saudi Arabia (%)
Place of birth for the foreign-born population - Syria (%)
Place of birth for the foreign-born population - Turkey (%)
Place of birth for the foreign-born population - Yemen (%)
Place of birth for the foreign-born population - Other Western Asia (%)
Place of birth for the foreign-born population - Eritrea (%)
Place of birth for the foreign-born population - Ethiopia (%)
Place of birth for the foreign-born population - Kenya (%)
Place of birth for the foreign-born population - Somalia (%)
Place of birth for the foreign-born population - Uganda (%)
Place of birth for the foreign-born population - Zimbabwe (%)
Place of birth for the foreign-born population - Other Eastern Africa (%)
Place of birth for the foreign-born population - Cameroon (%)
Place of birth for the foreign-born population - Congo (%)
Place of birth for the foreign-born population - Democratic Republic of Congo (Zaire) (%)
Place of birth for the foreign-born population - Other Middle Africa (%)
Place of birth for the foreign-born population - Egypt (%)
Place of birth for the foreign-born population - Morocco (%)
Place of birth for the foreign-born population - Sudan (%)
Place of birth for the foreign-born population - Other Northern Africa (%)
Place of birth for the foreign-born population - South Africa (%)
Place of birth for the foreign-born population - Other Southern Africa (%)
Place of birth for the foreign-born population - Cabo Verde (%)
Place of birth for the foreign-born population - Ghana (%)
Place of birth for the foreign-born population - Liberia (%)
Place of birth for the foreign-born population - Nigeria (%)
Place of birth for the foreign-born population - Senegal (%)
Place of birth for the foreign-born population - Sierra Leone (%)
Place of birth for the foreign-born population - Other Western Africa (%)
Place of birth for the foreign-born population - Australia (%)
Place of birth for the foreign-born population - New Zealand (%)
Place of birth for the foreign-born population - Fiji (%)
Place of birth for the foreign-born population - Micronesia (%)
Place of birth for the foreign-born population - Bahamas (%)
Place of birth for the foreign-born population - Barbados (%)
Place of birth for the foreign-born population - Cuba (%)
Place of birth for the foreign-born population - Dominica (%)
Place of birth for the foreign-born population - Dominican Republic (%)
Place of birth for the foreign-born population - Grenada (%)
Place of birth for the foreign-born population - Haiti (%)
Place of birth for the foreign-born population - Jamaica (%)
Place of birth for the foreign-born population - St. Vincent and the Grenadines (%)
Place of birth for the foreign-born population - Trinidad and Tobago (%)
Place of birth for the foreign-born population - West Indies (%)
Place of birth for the foreign-born population - Other Caribbean (%)
Place of birth for the foreign-born population - Belize (%)
Place of birth for the foreign-born population - Costa Rica (%)
Place of birth for the foreign-born population - El Salvador (%)
Place of birth for the foreign-born population - Guatemala (%)
Place of birth for the foreign-born population - Honduras (%)
Place of birth for the foreign-born population - Mexico (%)
Place of birth for the foreign-born population - Nicaragua (%)
Place of birth for the foreign-born population - Panama (%)
Place of birth for the foreign-born population - Other Central America (%)
Place of birth for the foreign-born population - Argentina (%)
Place of birth for the foreign-born population - Bolivia (%)
Place of birth for the foreign-born population - Brazil (%)
Place of birth for the foreign-born population - Chile (%)
Place of birth for the foreign-born population - Colombia (%)
Place of birth for the foreign-born population - Ecuador (%)
Place of birth for the foreign-born population - Guyana (%)
Place of birth for the foreign-born population - Peru (%)
Place of birth for the foreign-born population - Uruguay (%)
Place of birth for the foreign-born population - Venezuela (%)
Place of birth for the foreign-born population - Other South America (%)
Place of birth for the foreign-born population - Canada (%)
Place of birth for the foreign-born population - Other Northern America (%)
Place of birth for the foreign-born population - Other (%)
Latest news about races in Emmett, ID collected exclusively by city-data.com from local newspapers, TV, and radio stations
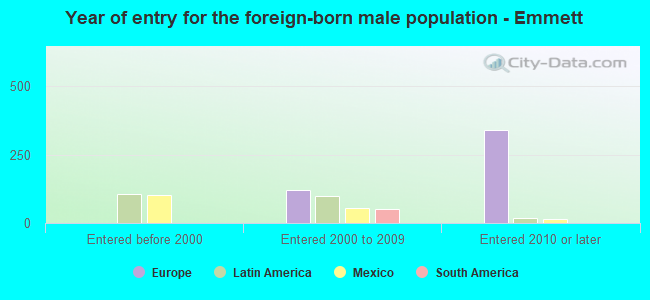
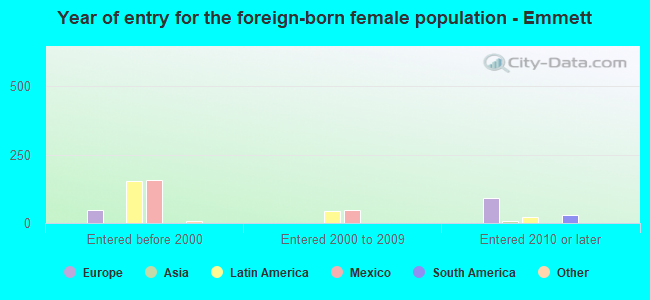
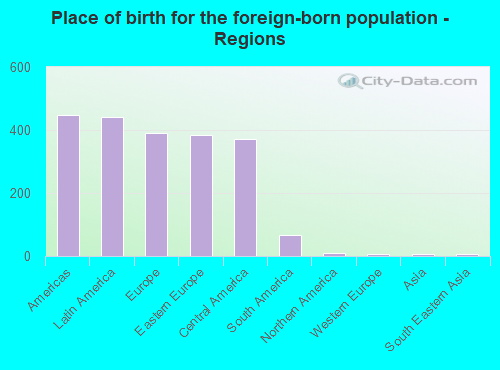
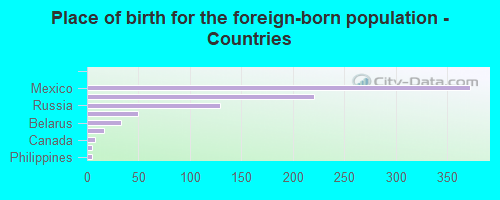
According to 2022 data, the most numerous races in Emmett, ID are White alone (6,299 residents), Hispanic (1,257 residents), and Two or more races (427 residents). 82.7% of Emmett residents speak English at home. 10.5% of Emmett, ID residents are foreign-born (5.6% born in Latin America, 5.0% born in Europe), which is 52.3% greater than the foreign-born rate of 5.0% across the entire state of Idaho.
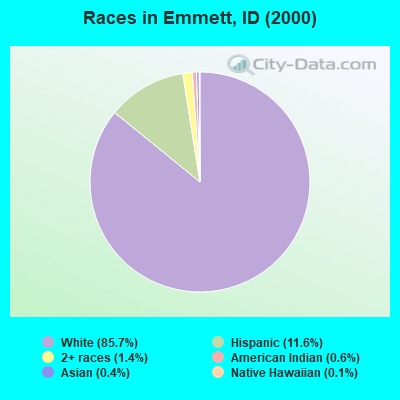
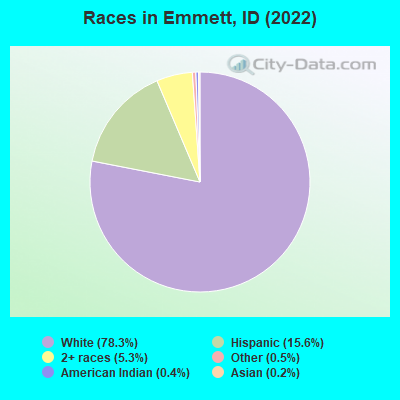
Race distribution in Emmett
2000 2022
1,139,291 88.0% White alone 101,690 7.9% Hispanic 18,261 1.4% Two or more races 15,789 1.2% American Indian alone 11,641 0.9% Asian alone 4,889 0.4% Black alone 1,192 0.09% Other race alone 1,200 0.09% Native Hawaiian and Other
1,531,219 79.0% White alone 261,921 13.5% Hispanic 81,112 4.2% Two or more races 25,174 1.3% Asian alone 15,825 0.8% American Indian alone 11,868 0.6% Black alone 8,752 0.5% Other race alone 3,162 0.2% Native Hawaiian and Other
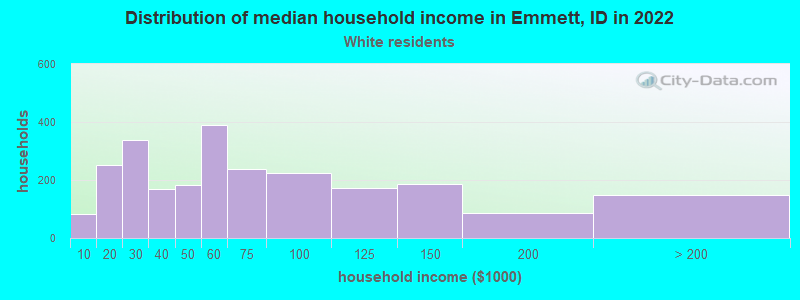
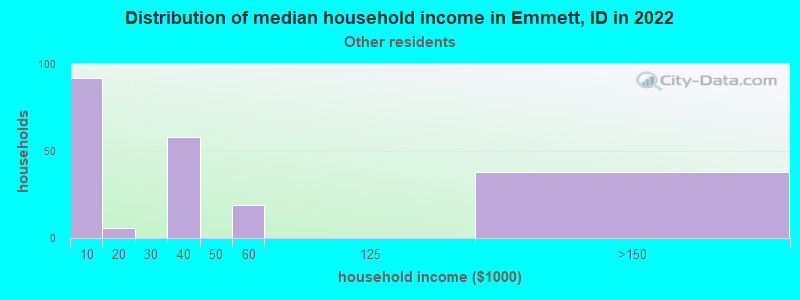
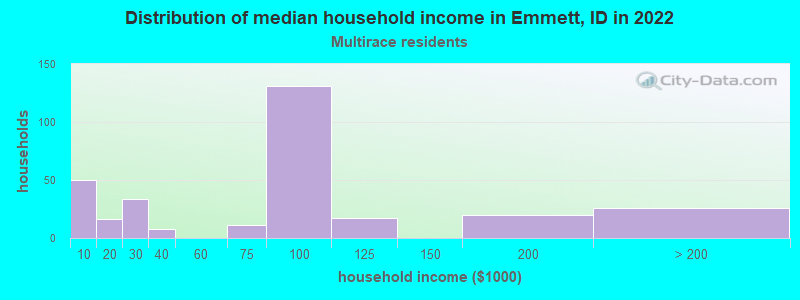
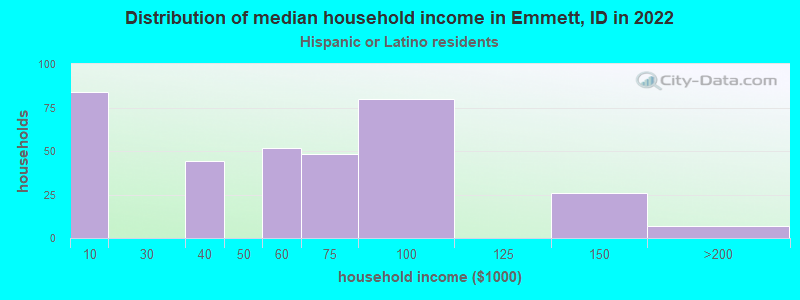
Income and house value in Emmett Median household income in 2022 $55,442 White non-Hispanic householders$80,162 Two or more races householders$57,898 Hispanic or Latino race householdersMedian 2022 house value $309,210 White Non-Hispanic householders$273,721 American Indian or Alaska Native householders $358,669 Asian householders$336,016 Some other race householders$207,650 Two or more races householders$316,761 Hispanic or Latino householders
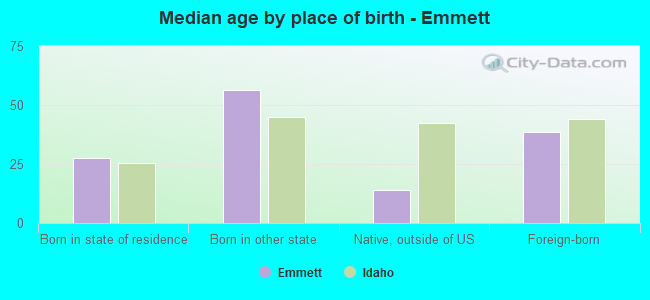
Median age by race in Emmett
38.9 Median age for White residents38.0 40.6 -774,193,547.6 Median age for Black or African American residents-680,851,063.1 -869,696,968.8 12.7 Median age for American Indian / Alaska Native residents-708,860,758.8 -601,489,757.3 17.8 Median age for Asian residents18.9 5.6 -393,939,393.5 Median age for Native Hawaiian / Pacific Islander residents-355,119,825.4 -679,245,282.3 25.9 Median age for Other race residents47.3 17.9 26.9 Median age for Two or more races residents15.1 33.1 39.7 Median age for White alone residents38.1 41.3 20.6 Median age for Hispanic or Latino residents18.2 20.9
Owner/renter occupied households by race in Emmett
House owners and renters - White residents 1,651 66.7% Owner occupied823 33.3% Renter occupiedHouse owners and renters - American Indian / Alaska Native residents 15 100.0% Owner occupiedHouse owners and renters - Asian residents 2 100.0% Owner occupiedHouse owners and renters - Other race residents 75 38.6% Owner occupied119 61.4% Renter occupiedHouse owners and renters - Two or more races residents 124 41.5% Owner occupied176 58.5% Renter occupiedHouse owners and renters - White alone residents 1,615 66.7% Owner occupied806 33.3% Renter occupiedHouse owners and renters - Hispanic or Latino residents 134 39.0% Owner occupied210 61.0% Renter occupied
Language usage in Emmett
English speakers - Total 82.7% of residents of Emmett speak English at home.
10.1% of residents speak Spanish at home 394 51.5% Speak English very well371 48.5% Speak English less than very well7.8% of residents speak other language at home 282 47.6% Speak English very well311 52.4% Speak English less than very well
English speakers - Born in the United States 93.8% of residents of Emmett speak English at home.
6.0% of residents speak Spanish at home 157 84.4% Speak English very well29 15.6% Speak English less than very well0.4% of residents speak other language at home 12 100.0% Speak English very well
English speakers - Native, born elsewhere 96.9% of residents of Emmett speak English at home.
English speakers - Foreign-born 6.8% of residents of Emmett speak English at home.
42.0% of residents speak Spanish at home 73 19.3% Speak English very well305 80.7% Speak English less than very well57.4% of residents speak other language at home 189 36.6% Speak English very well328 63.4% Speak English less than very well
White (Caucasian) - Speak only English Native:
98.2% (5,489)Foreign-born:
1.8% (7)
White (Caucasian) - Speak another language Native:
2.0% (110)Foreign-born:
100.0% (364)
Asian - Speak only English Native:
59.3% (5)Foreign-born:
46.3% (2)
Asian - Speak another language Native:
36.5% (3)Foreign-born:
57.7% (3)
Other race - Speak another language Native:
83.5% (250)Foreign-born:
99.1% (308)
Two or more races - Speak only English Native:
81.5% (699)Foreign-born:
53.9% (103)
Two or more races - Speak another language Native:
18.0% (155)Foreign-born:
57.7% (110)
White alone - Speak only English Native:
97.8% (5,388)Foreign-born:
1.5% (7)
White alone - Speak another language Native:
2.2% (124)Foreign-born:
100.0% (483)
Hispanic or Latino - Speak only English Native:
49.4% (355)Foreign-born:
13.7% (60)
Hispanic or Latino - Speak another language Native:
50.4% (362)Foreign-born:
86.9% (381)
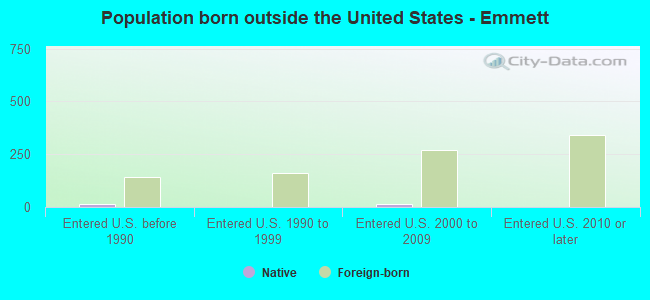
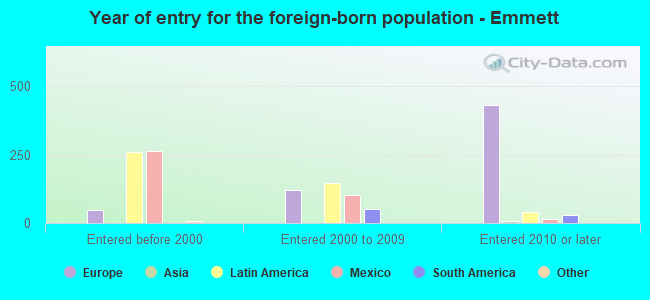
Foreign-born residents in Emmett 843 residents are foreign born (5.6% Latin America , 5.0% Europe ).
This city:
10.5%Idaho:
5.7%
Marital status for residents in Emmett Marital status - White (Caucasian) population 15 years and over
Males 23.5% Never married48.2% Now married1.0% Separated4.7% Widowed22.6% DivorcedFemales 19.2% Never married50.5% Now married2.2% Separated13.2% Widowed15.0% DivorcedWomen who gave birth in the past 12 months Now married:
81.9% (69)Unmarried:
18.1% (15)
Women who did not give birth in the past 12 months Now married:
45.4% (570)Unmarried:
54.6% (686)
Marital status - Asian population 15 years and over
Males 66.7% Never married33.3% Now married0.0% Separated0.0% Widowed0.0% DivorcedFemales 0.0% Never married100.0% Now married0.0% Separated0.0% Widowed0.0% DivorcedWomen who did not give birth in the past 12 months Now married:
100.0% (3)Unmarried:
0.0% (0)
Marital status - Other race population 15 years and over
Males 24.5% Never married48.6% Now married0.0% Separated0.0% Widowed26.9% DivorcedFemales 38.8% Never married50.2% Now married0.0% Separated6.0% Widowed5.0% DivorcedWomen who gave birth in the past 12 months Now married:
100.0% (30)Unmarried:
0.0% (0)
Women who did not give birth in the past 12 months Now married:
45.3% (79)Unmarried:
54.7% (95)
Marital status - Two or more races population 15 years and over
Males 38.9% Never married36.7% Now married4.8% Separated7.9% Widowed11.8% DivorcedFemales 53.0% Never married7.8% Now married3.2% Separated12.9% Widowed23.0% DivorcedWomen who gave birth in the past 12 months Now married:
100.0% (9)Unmarried:
0.0% (0)
Women who did not give birth in the past 12 months Now married:
4.5% (9)Unmarried:
95.5% (196)
Marital status - White alone, not Hispanic / Latino population 15 years and over
Males 24.0% Never married47.0% Now married1.0% Separated4.8% Widowed23.1% DivorcedFemales 19.0% Never married51.3% Now married0.8% Separated13.5% Widowed15.3% DivorcedWomen who gave birth in the past 12 months Now married:
81.9% (70)Unmarried:
18.1% (16)
Women who did not give birth in the past 12 months Now married:
44.3% (547)Unmarried:
55.7% (688)
Marital status - Hispanic or Latino population 15 years and over
Males 18.8% Never married54.8% Now married0.0% Separated4.7% Widowed21.7% DivorcedFemales 52.4% Never married34.5% Now married13.1% Separated0.0% Widowed0.0% DivorcedWomen who gave birth in the past 12 months Now married:
100.0% (30)Unmarried:
0.0% (0)
Women who did not give birth in the past 12 months Now married:
41.0% (120)Unmarried:
59.0% (173)
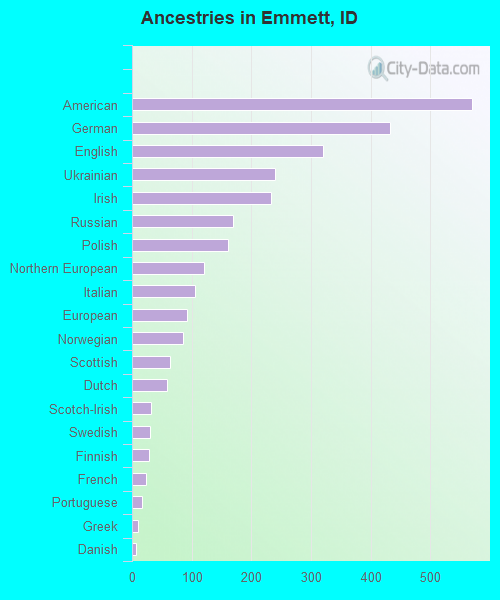
Ancestries in Emmett
570 13.5% American432 10.2% German320 7.6% English240 5.7% Ukrainian233 5.5% Irish170 4.0% Russian161 3.8% Polish120 2.8% Northern European105 2.5% Italian92 2.2% European85 2.0% Norwegian63 1.5% Scottish59 1.4% Dutch32 0.8% Scotch-Irish30 0.7% Swedish28 0.7% Finnish24 0.6% French17 0.4% Portuguese10 0.2% Greek7 0.2% Danish
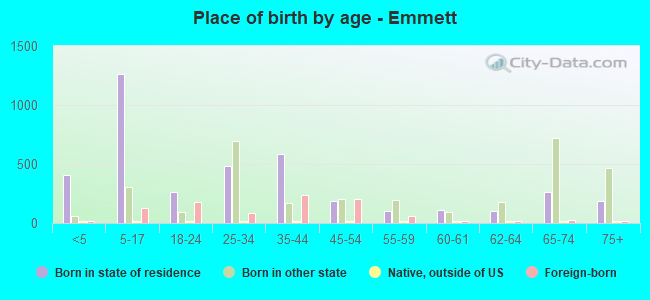
Children Nativity (place of birth) in Emmett
Children under 6 years - Living with two parents Both parents native 202 99.7% Native1 0.3% Foreign-bornBoth parents foreign-born 70 100.0% NativeOne native, one foreign-born parent 46 95.9% Native2 4.1% Foreign-bornChildren under 6 years - Living with one parent Native parent 247 100.0% NativeForeign-born parent 1 100.0% NativeChildren 6 to 17 years - Living with two parents Both parents native 561 100.0% NativeBoth parents foreign-born 232 100.0% NativeOne native, one foreign-born parent 53 100.0% NativeChildren 6 to 17 years - Living with one parent Native parent 343 100.0% NativeForeign-born parent 33 51.1% Native31 48.9% Foreign-born
Grandparents responsible for own grandchildren in Emmett
Grandparents (30 to 59 years) White / Caucasian 21 100.0% Not responsible for grandchildrenOther race 80 100.0% Not responsible for grandchildrenWhite alone, not Hispanic / Latino 21 100.0% Not responsible for grandchildrenHispanic or Latino 66 100.0% Not responsible for grandchildrenGrandparents (60 years and over) White / Caucasian 36 30.2% Responsible for grandchildren84 69.8% Not responsible for grandchildrenWhite alone, not Hispanic / Latino 36 29.4% Responsible for grandchildren87 70.6% Not responsible for grandchildren