Races in Erlton-Ellisburg, New Jersey (NJ) Detailed Stats
Ancestries, Foreign-born residents, place of birth

Recent posts about races in Erlton-Ellisburg, New Jersey on our local forum with over 2,400,000 registered users:
 | Cherry Hill- Barclay-Kingston or Erlton-Ellisburg sections? (3 replies) |
12.3% of Erlton-Ellisburg, NJ residents are foreign-born (5.2% born in Europe, 5.1% born in Asia, 1.7% born in Latin America), which is 86.7% less than the foreign-born rate of 23.0% across the entire state of New Jersey.
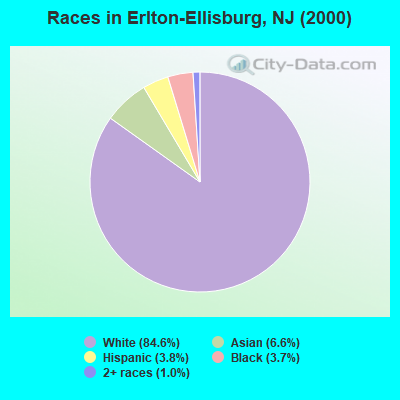
Race distribution in Erlton-Ellisburg

- 6,91484.6%White alone
- 5416.6%Asian alone
- 3113.8%Hispanic
- 3043.7%Black alone
- 831.0%Two or more races
- 80.10%American Indian alone
- 60.07%Other race alone
- 10.01%Native Hawaiian and Other
Pacific Islander alone
2000
2022
-
- 5,557,20966.0%White alone
- 1,117,19113.3%Hispanic
- 1,096,17113.0%Black alone
- 477,0125.7%Asian alone
- 133,6891.6%Two or more races
- 19,5650.2%Other race alone
- 11,3380.1%American Indian alone
- 2,1750.03%Native Hawaiian and Other
Pacific Islander alone

-
- 4,766,47651.5%White alone
- 2,028,47021.9%Hispanic
- 1,111,63212.0%Black alone
- 923,54610.0%Asian alone
- 332,2373.6%Two or more races
- 89,8471.0%Other race alone
- 8,5570.09%American Indian alone
- 9340.01%Native Hawaiian and Other
Pacific Islander alone

Income and house value in Erlton-Ellisburg
- Median household income in 2022
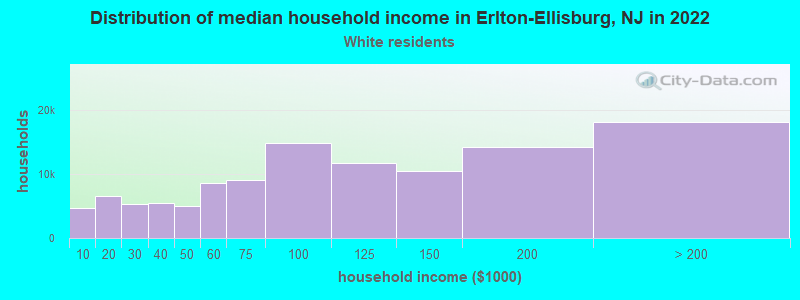
- $87,175White non-Hispanic householders
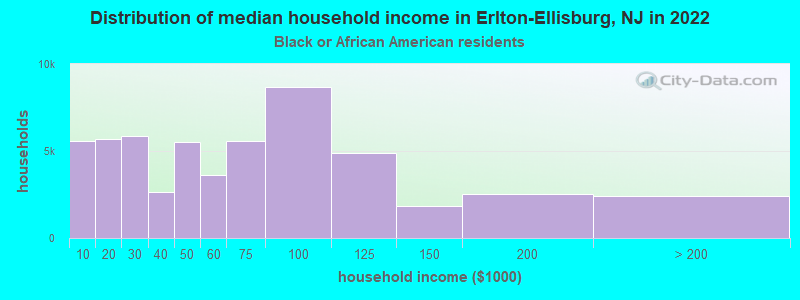
- $82,379Black householders
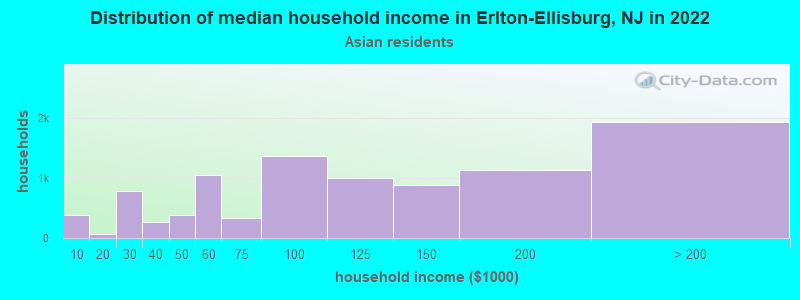
- $92,741Asian householders
- $63,982Some other race householders
- $47,124Two or more races householders
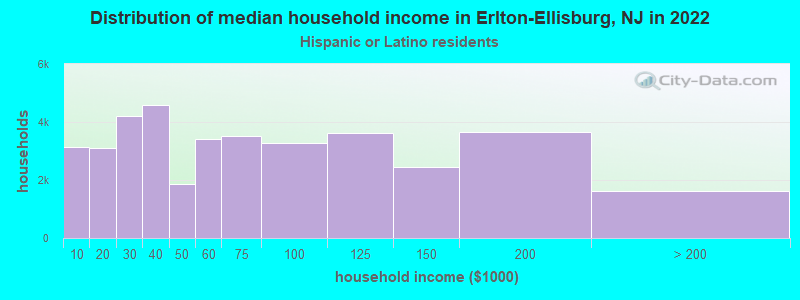
- $71,520Hispanic or Latino race householders
- Median 2022 house value
- $325,707White Non-Hispanic householders
- $335,801Black or African American householders
- $328,908Asian householders
- $302,565Two or more races householders
- $371,252Hispanic or Latino householders
Household income for White non-Hispanic householders
Household income for Black householders
Household income for Asian householders
Household income for Two or more races householders
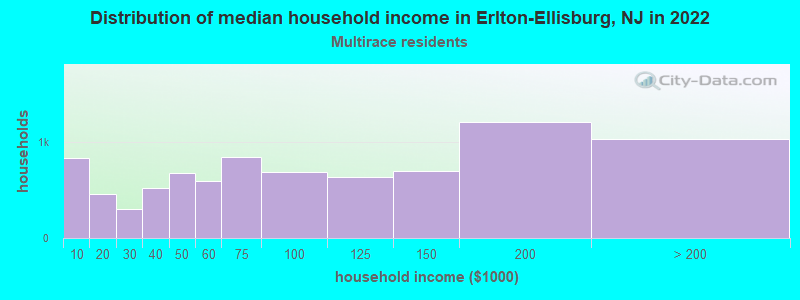
Household income for Hispanic or Latino race householders
Foreign-born residents in Erlton-Ellisburg
1,006 residents are foreign born (5.2% Europe, 5.1% Asia, 1.7% Latin America).
| This city: | 12.3% |
| New Jersey: | 17.5% |
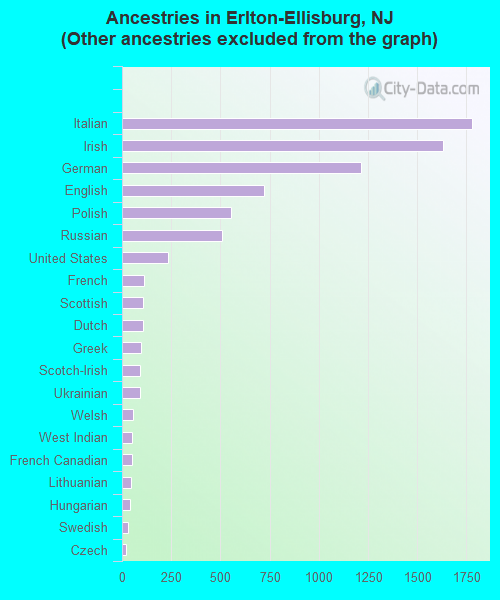
Ancestries in Erlton-Ellisburg

- 1,83719.5%Other
- 1,77618.8%Italian
- 1,63217.3%Irish
- 1,21512.9%German
- 7217.6%English
- 5565.9%Polish
- 5065.4%Russian
- 2332.5%United States
- 1101.2%French
- 1071.1%Scottish
- 1061.1%Dutch
- 981.0%Greek
- 941.0%Scotch-Irish
- 901.0%Ukrainian
- 560.6%Welsh
- 530.6%West Indian
- 520.6%French Canadian
- 480.5%Lithuanian
- 410.4%Hungarian
- 330.3%Swedish
- 180.2%Czech
- 140.1%Subsaharan African
- 110.1%Portuguese
- 100.1%Arab
- 80.08%Swiss
- 70.07%Norwegian
- 60.06%Danish
Zip codes: 08002.