Races in Evansville, Indiana (IN) Detailed Stats
Data:
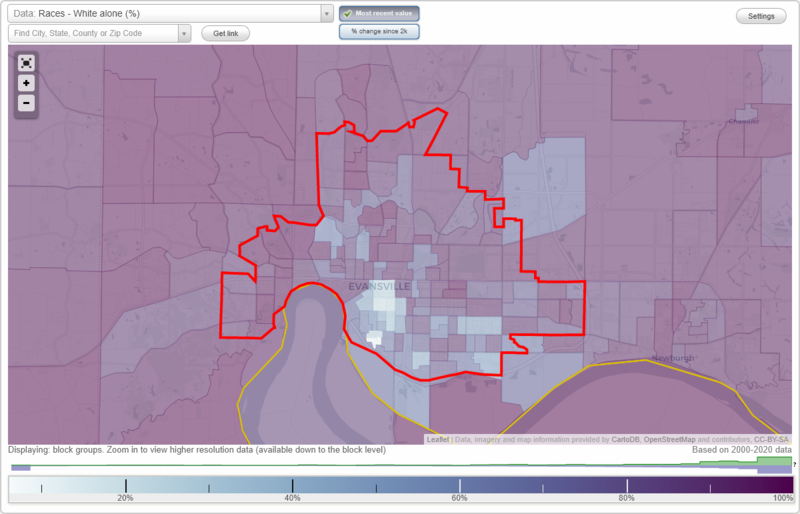
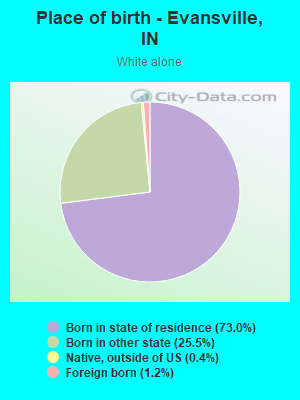
Races - White alone (%)
Races - White alone (% change since 2000)
Races - Black alone (%)
Races - Black alone (% change since 2000)
Races - American Indian alone (%)
Races - American Indian alone (% change since 2000)
Races - Asian alone (%)
Races - Asian alone (% change since 2000)
Races - Hispanic (%)
Races - Hispanic (% change since 2000)
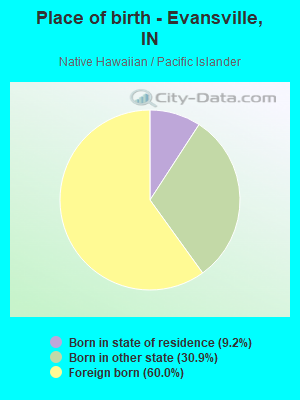
Races - Native Hawaiian and Other Pacific Islander alone (%)
Races - Native Hawaiian and Other Pacific Islander alone (% change since 2000)
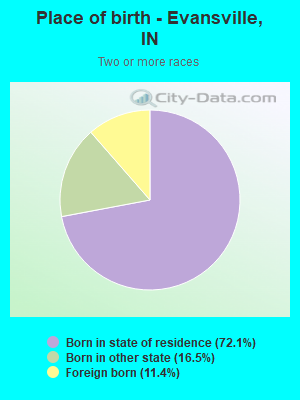
Races - Two or more races(%)
Races - Two or more races(% change since 2000)
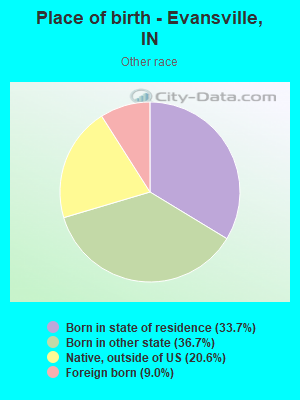
Races - Other race alone (%)
Races - Other race alone (% change since 2000)
Racial diversity
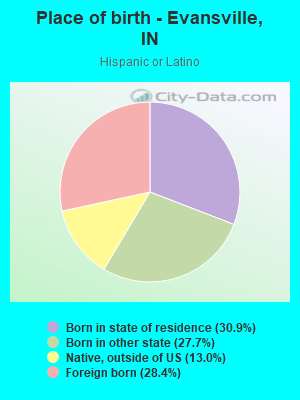
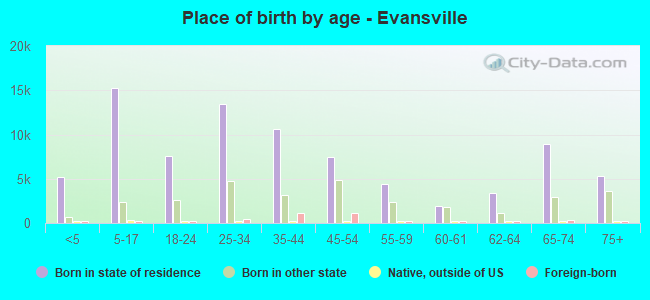
Place of birth - Born in state of residence (%)
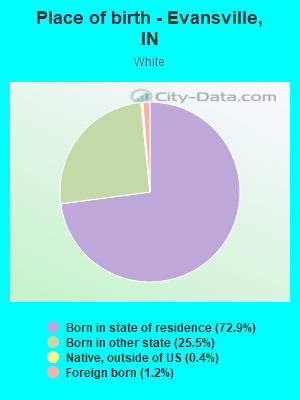
Place of birth - Born in state of residence (%) - White
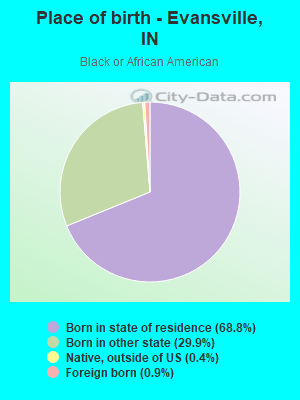
Place of birth - Born in state of residence (%) - Black or African American
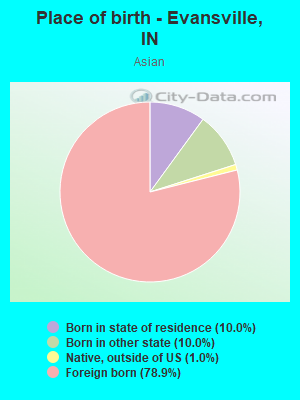
Place of birth - Born in state of residence (%) - Asian
Place of birth - Born in state of residence (%) - Hispanic or Latino
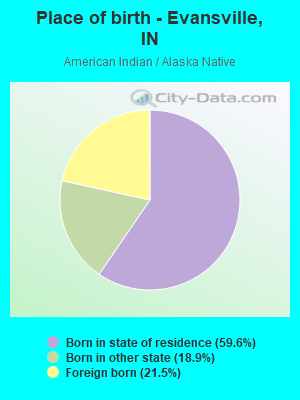
Place of birth - Born in state of residence (%) - American Indian and Alaska Native
Place of birth - Born in state of residence (%) - Multirace
Place of birth - Born in state of residence (%) - Other Race
Place of birth - Born in other state (%)
Place of birth - Born in other state (%) - White
Place of birth - Born in other state (%) - Black or African American
Place of birth - Born in other state (%) - Asian
Place of birth - Born in other state (%) - Hispanic or Latino
Place of birth - Born in other state (%) - American Indian and Alaska Native
Place of birth - Born in other state (%) - Multirace
Place of birth - Born in other state (%) - Other Race
Place of birth - Native, outside of US (%)
Place of birth - Native, outside of US (%) - White
Place of birth - Native, outside of US (%) - Black or African American
Place of birth - Native, outside of US (%) - Asian
Place of birth - Native, outside of US (%) - Hispanic or Latino
Place of birth - Native, outside of US (%) - American Indian and Alaska Native
Place of birth - Native, outside of US (%) - Multirace
Place of birth - Native, outside of US (%) - Other Race
Place of birth - Foreign born (%)
Place of birth - Foreign born (%) - White
Place of birth - Foreign born (%) - Black or African American
Place of birth - Foreign born (%) - Asian
Place of birth - Foreign born (%) - Hispanic or Latino
Place of birth - Foreign born (%) - American Indian and Alaska Native
Place of birth - Foreign born (%) - Multirace
Place of birth - Foreign born (%) - Other Race
Residents speaking English at home (%)
Residents speaking English at home - Born in the United States (%)
Residents speaking English at home - Native, born elsewhere (%)
Residents speaking English at home - Foreign born (%)
Residents speaking Spanish at home (%)
Residents speaking Spanish at home - Born in the United States (%)
Residents speaking Spanish at home - Native, born elsewhere (%)
Residents speaking Spanish at home - Foreign born (%)
Residents speaking other language at home (%)
Residents speaking other language at home - Born in the United States (%)
Residents speaking other language at home - Native, born elsewhere (%)
Residents speaking other language at home - Foreign born (%)
Marital status - Never married (%)
Marital status - Now married (%)
Marital status - Separated (%)
Marital status - Widowed (%)
Marital status - Divorced (%)
Ancestries Reported - Arab (%)
Ancestries Reported - Czech (%)
Ancestries Reported - Danish (%)
Ancestries Reported - Dutch (%)
Ancestries Reported - English (%)
Ancestries Reported - French (%)
Ancestries Reported - French Canadian (%)
Ancestries Reported - German (%)
Ancestries Reported - Greek (%)
Ancestries Reported - Hungarian (%)
Ancestries Reported - Irish (%)
Ancestries Reported - Italian (%)
Ancestries Reported - Lithuanian (%)
Ancestries Reported - Norwegian (%)
Ancestries Reported - Polish (%)
Ancestries Reported - Portuguese (%)
Ancestries Reported - Russian (%)
Ancestries Reported - Scotch-Irish (%)
Ancestries Reported - Scottish (%)
Ancestries Reported - Slovak (%)
Ancestries Reported - Subsaharan African (%)
Ancestries Reported - Swedish (%)
Ancestries Reported - Swiss (%)
Ancestries Reported - Ukrainian (%)
Ancestries Reported - United States (%)
Ancestries Reported - Welsh (%)
Ancestries Reported - West Indian (%)
Ancestries Reported - Other (%)
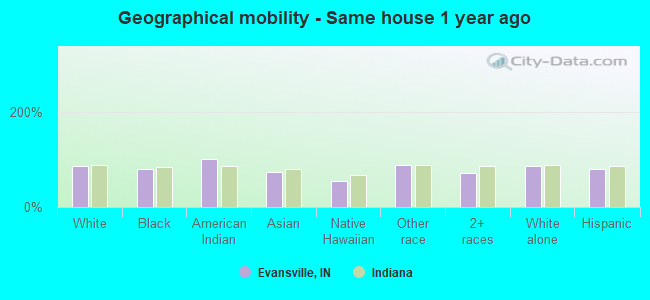
Geographical mobility - Same house 1 year ago (%)
Geographical mobility - Same house 1 year ago (%) - White
Geographical mobility - Same house 1 year ago (%) - Black or African American
Geographical mobility - Same house 1 year ago (%) - Asian
Geographical mobility - Same house 1 year ago (%) - Hispanic or Latino
Geographical mobility - Same house 1 year ago (%) - American Indian and Alaska Native
Geographical mobility - Same house 1 year ago (%) - Multirace
Geographical mobility - Same house 1 year ago (%) - Other Race
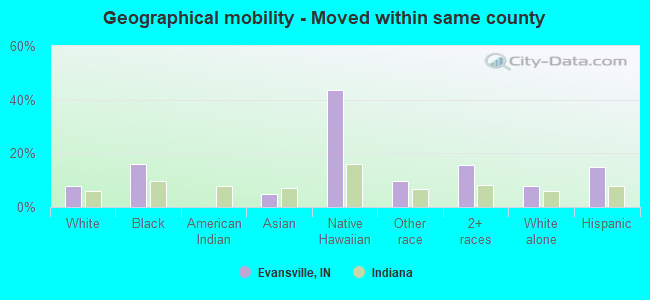
Geographical mobility - Moved within same county (%)
Geographical mobility - Moved within same county (%) - White
Geographical mobility - Moved within same county (%) - Black or African American
Geographical mobility - Moved within same county (%) - Asian
Geographical mobility - Moved within same county (%) - Hispanic or Latino
Geographical mobility - Moved within same county (%) - American Indian and Alaska Native
Geographical mobility - Moved within same county (%) - Multirace
Geographical mobility - Moved within same county (%) - Other Race
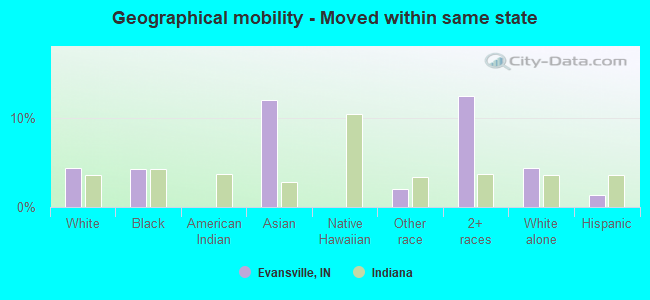
Geographical mobility - Moved from different county within same state (%)
Geographical mobility - Moved from different county within same state (%) - White
Geographical mobility - Moved from different county within same state (%) - Black or African American
Geographical mobility - Moved from different county within same state (%) - Asian
Geographical mobility - Moved from different county within same state (%) - Hispanic or Latino
Geographical mobility - Moved from different county within same state (%) - American Indian and Alaska Native
Geographical mobility - Moved from different county within same state (%) - Multirace
Geographical mobility - Moved from different county within same state (%) - Other Race
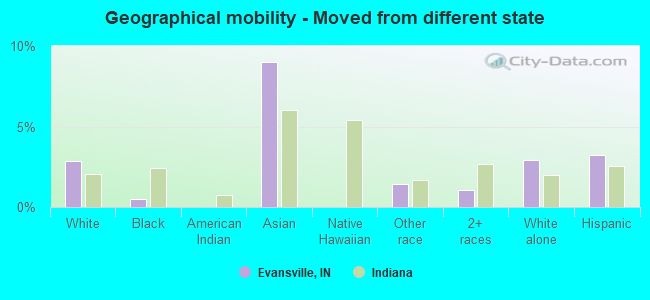
Geographical mobility - Moved from different state (%)
Geographical mobility - Moved from different state (%) - White
Geographical mobility - Moved from different state (%) - Black or African American
Geographical mobility - Moved from different state (%) - Asian
Geographical mobility - Moved from different state (%) - Hispanic or Latino
Geographical mobility - Moved from different state (%) - American Indian and Alaska Native
Geographical mobility - Moved from different state (%) - Multirace
Geographical mobility - Moved from different state (%) - Other Race
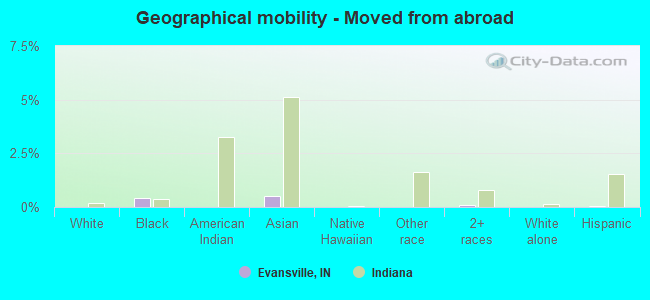
Geographical mobility - Moved from abroad (%)
Geographical mobility - Moved from abroad (%) - White
Geographical mobility - Moved from abroad (%) - Black or African American
Geographical mobility - Moved from abroad (%) - Asian
Geographical mobility - Moved from abroad (%) - Hispanic or Latino
Geographical mobility - Moved from abroad (%) - American Indian and Alaska Native
Geographical mobility - Moved from abroad (%) - Multirace
Geographical mobility - Moved from abroad (%) - Other Race
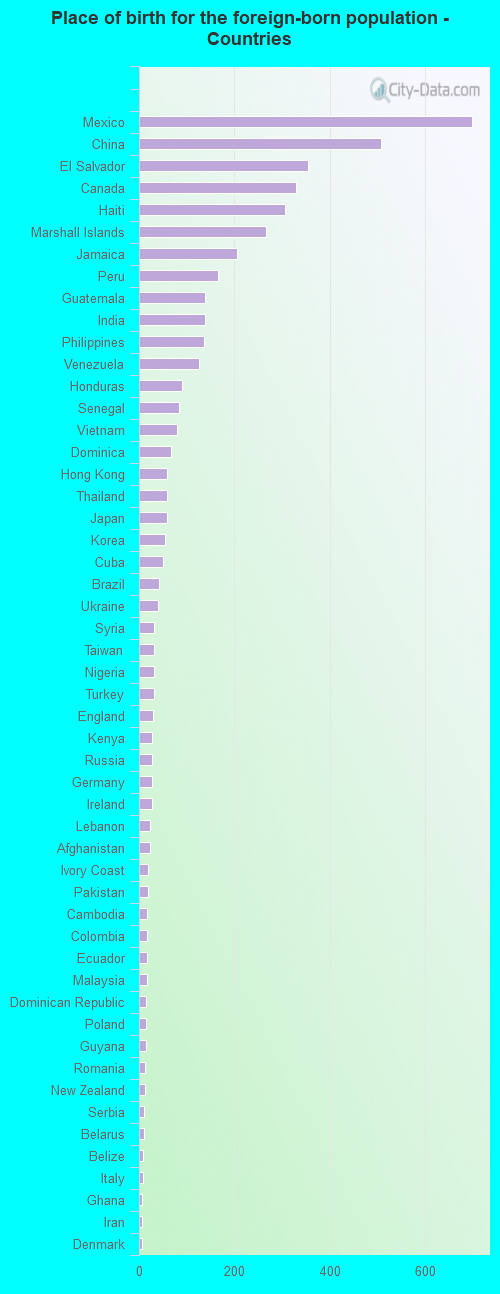
Place of birth for the foreign-born population - Ireland (%)
Place of birth for the foreign-born population - Denmark (%)
Place of birth for the foreign-born population - Norway (%)
Place of birth for the foreign-born population - Sweden (%)
Place of birth for the foreign-born population - United Kingdom (%)
Place of birth for the foreign-born population - England (%)
Place of birth for the foreign-born population - Scotland (%)
Place of birth for the foreign-born population - Other Northern Europe (%)
Place of birth for the foreign-born population - Austria (%)
Place of birth for the foreign-born population - Belgium (%)
Place of birth for the foreign-born population - France (%)
Place of birth for the foreign-born population - Germany (%)
Place of birth for the foreign-born population - Netherlands (%)
Place of birth for the foreign-born population - Switzerland (%)
Place of birth for the foreign-born population - Other Western Europe (%)
Place of birth for the foreign-born population - Greece (%)
Place of birth for the foreign-born population - Italy (%)
Place of birth for the foreign-born population - Portugal (%)
Place of birth for the foreign-born population - Spain (%)
Place of birth for the foreign-born population - Other Southern Europe (%)
Place of birth for the foreign-born population - Albania (%)
Place of birth for the foreign-born population - Belarus (%)
Place of birth for the foreign-born population - Bosnia and Herzegovina (%)
Place of birth for the foreign-born population - Bulgaria (%)
Place of birth for the foreign-born population - Croatia (%)
Place of birth for the foreign-born population - Czechoslovakia (%)
Place of birth for the foreign-born population - Hungary (%)
Place of birth for the foreign-born population - Latvia (%)
Place of birth for the foreign-born population - Lithuania (%)
Place of birth for the foreign-born population - North Macedonia (Macedonia) (%)
Place of birth for the foreign-born population - Moldova (%)
Place of birth for the foreign-born population - Poland (%)
Place of birth for the foreign-born population - Romania (%)
Place of birth for the foreign-born population - Russia (%)
Place of birth for the foreign-born population - Serbia (%)
Place of birth for the foreign-born population - Ukraine (%)
Place of birth for the foreign-born population - Other Eastern Europe (%)
Place of birth for the foreign-born population - China (%)
Place of birth for the foreign-born population - Hong Kong (%)
Place of birth for the foreign-born population - Taiwan (%)
Place of birth for the foreign-born population - Japan (%)
Place of birth for the foreign-born population - Korea (%)
Place of birth for the foreign-born population - Other Eastern Asia (%)
Place of birth for the foreign-born population - Afghanistan (%)
Place of birth for the foreign-born population - Bangladesh (%)
Place of birth for the foreign-born population - India (%)
Place of birth for the foreign-born population - Iran (%)
Place of birth for the foreign-born population - Kazakhstan (%)
Place of birth for the foreign-born population - Nepal (%)
Place of birth for the foreign-born population - Pakistan (%)
Place of birth for the foreign-born population - Sri Lanka (%)
Place of birth for the foreign-born population - Uzbekistan (%)
Place of birth for the foreign-born population - Other South Central Asia (%)
Place of birth for the foreign-born population - Burma (%)
Place of birth for the foreign-born population - Cambodia (%)
Place of birth for the foreign-born population - Indonesia (%)
Place of birth for the foreign-born population - Laos (%)
Place of birth for the foreign-born population - Malaysia (%)
Place of birth for the foreign-born population - Philippines (%)
Place of birth for the foreign-born population - Singapore (%)
Place of birth for the foreign-born population - Thailand (%)
Place of birth for the foreign-born population - Vietnam (%)
Place of birth for the foreign-born population - Other South Eastern Asia (%)
Place of birth for the foreign-born population - Armenia (%)
Place of birth for the foreign-born population - Iraq (%)
Place of birth for the foreign-born population - Israel (%)
Place of birth for the foreign-born population - Jordan (%)
Place of birth for the foreign-born population - Kuwait (%)
Place of birth for the foreign-born population - Lebanon (%)
Place of birth for the foreign-born population - Saudi Arabia (%)
Place of birth for the foreign-born population - Syria (%)
Place of birth for the foreign-born population - Turkey (%)
Place of birth for the foreign-born population - Yemen (%)
Place of birth for the foreign-born population - Other Western Asia (%)
Place of birth for the foreign-born population - Eritrea (%)
Place of birth for the foreign-born population - Ethiopia (%)
Place of birth for the foreign-born population - Kenya (%)
Place of birth for the foreign-born population - Somalia (%)
Place of birth for the foreign-born population - Uganda (%)
Place of birth for the foreign-born population - Zimbabwe (%)
Place of birth for the foreign-born population - Other Eastern Africa (%)
Place of birth for the foreign-born population - Cameroon (%)
Place of birth for the foreign-born population - Congo (%)
Place of birth for the foreign-born population - Democratic Republic of Congo (Zaire) (%)
Place of birth for the foreign-born population - Other Middle Africa (%)
Place of birth for the foreign-born population - Egypt (%)
Place of birth for the foreign-born population - Morocco (%)
Place of birth for the foreign-born population - Sudan (%)
Place of birth for the foreign-born population - Other Northern Africa (%)
Place of birth for the foreign-born population - South Africa (%)
Place of birth for the foreign-born population - Other Southern Africa (%)
Place of birth for the foreign-born population - Cabo Verde (%)
Place of birth for the foreign-born population - Ghana (%)
Place of birth for the foreign-born population - Liberia (%)
Place of birth for the foreign-born population - Nigeria (%)
Place of birth for the foreign-born population - Senegal (%)
Place of birth for the foreign-born population - Sierra Leone (%)
Place of birth for the foreign-born population - Other Western Africa (%)
Place of birth for the foreign-born population - Australia (%)
Place of birth for the foreign-born population - New Zealand (%)
Place of birth for the foreign-born population - Fiji (%)
Place of birth for the foreign-born population - Micronesia (%)
Place of birth for the foreign-born population - Bahamas (%)
Place of birth for the foreign-born population - Barbados (%)
Place of birth for the foreign-born population - Cuba (%)
Place of birth for the foreign-born population - Dominica (%)
Place of birth for the foreign-born population - Dominican Republic (%)
Place of birth for the foreign-born population - Grenada (%)
Place of birth for the foreign-born population - Haiti (%)
Place of birth for the foreign-born population - Jamaica (%)
Place of birth for the foreign-born population - St. Vincent and the Grenadines (%)
Place of birth for the foreign-born population - Trinidad and Tobago (%)
Place of birth for the foreign-born population - West Indies (%)
Place of birth for the foreign-born population - Other Caribbean (%)
Place of birth for the foreign-born population - Belize (%)
Place of birth for the foreign-born population - Costa Rica (%)
Place of birth for the foreign-born population - El Salvador (%)
Place of birth for the foreign-born population - Guatemala (%)
Place of birth for the foreign-born population - Honduras (%)
Place of birth for the foreign-born population - Mexico (%)
Place of birth for the foreign-born population - Nicaragua (%)
Place of birth for the foreign-born population - Panama (%)
Place of birth for the foreign-born population - Other Central America (%)
Place of birth for the foreign-born population - Argentina (%)
Place of birth for the foreign-born population - Bolivia (%)
Place of birth for the foreign-born population - Brazil (%)
Place of birth for the foreign-born population - Chile (%)
Place of birth for the foreign-born population - Colombia (%)
Place of birth for the foreign-born population - Ecuador (%)
Place of birth for the foreign-born population - Guyana (%)
Place of birth for the foreign-born population - Peru (%)
Place of birth for the foreign-born population - Uruguay (%)
Place of birth for the foreign-born population - Venezuela (%)
Place of birth for the foreign-born population - Other South America (%)
Place of birth for the foreign-born population - Canada (%)
Place of birth for the foreign-born population - Other Northern America (%)
Place of birth for the foreign-born population - Other (%)
Latest news about races in Evansville, IN collected exclusively by city-data.com from local newspapers, TV, and radio stations
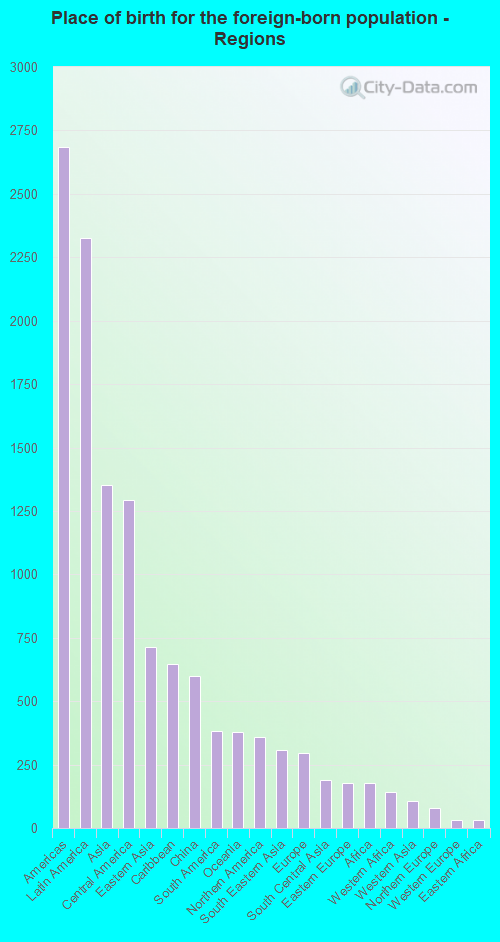
According to 2022 data, the most numerous races in Evansville, IN are White alone (90,096 residents), Black alone (14,920 residents), and Hispanic (4,084 residents). 95.2% of Evansville residents speak English at home. 4.2% of Evansville, IN residents are foreign-born (1.8% born in Latin America, 1.1% born in Asia), which is 43.2% less than the foreign-born rate of 6.0% across the entire state of Indiana.
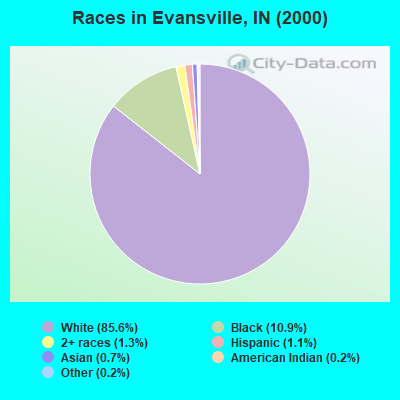
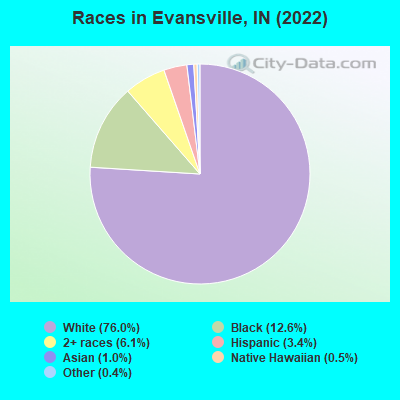
Race distribution in Evansville
2000 2022
5,219,373 85.8% White alone 505,462 8.3% Black alone 214,536 3.5% Hispanic 61,115 1.0% Two or more races 58,424 1.0% Asian alone 13,654 0.2% American Indian alone 6,348 0.1% Other race alone 1,573 0.03% Native Hawaiian and Other
5,192,455 76.0% White alone 628,054 9.2% Black alone 534,528 7.8% Hispanic 263,242 3.9% Two or more races 172,880 2.5% Asian alone 33,467 0.5% Other race alone 5,866 0.09% American Indian alone 2,545 0.04% Native Hawaiian and Other
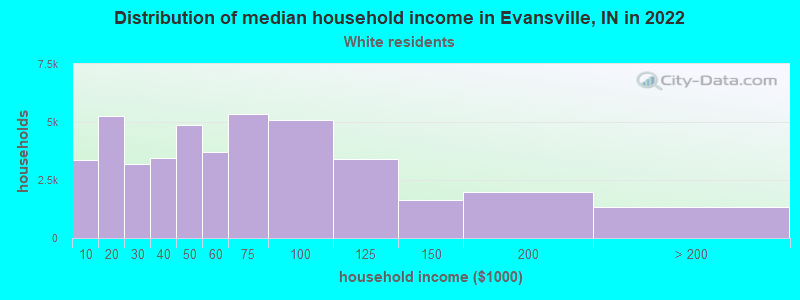
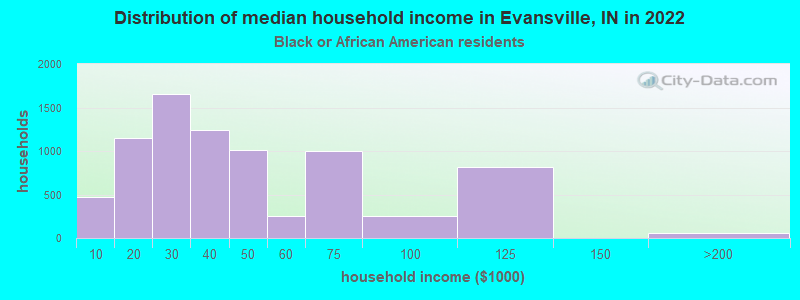
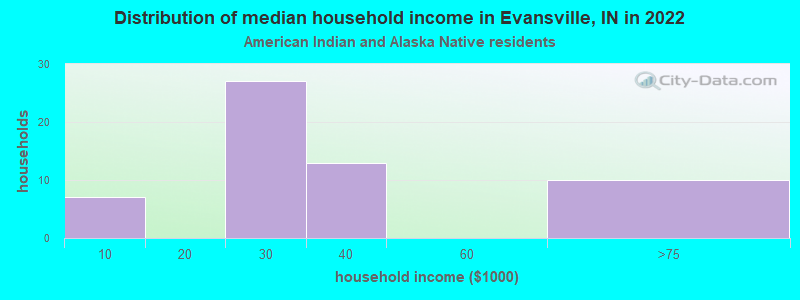
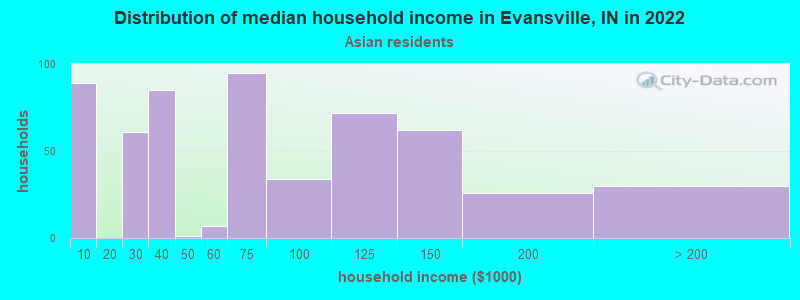
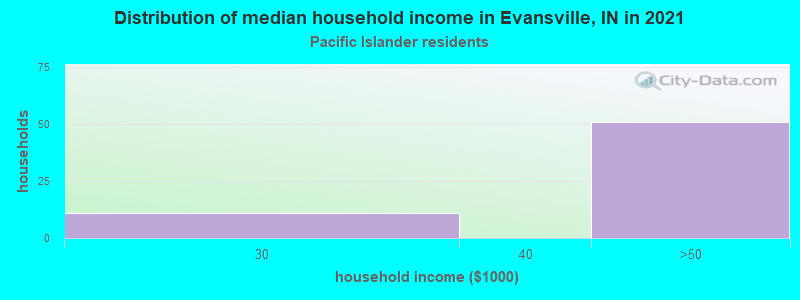
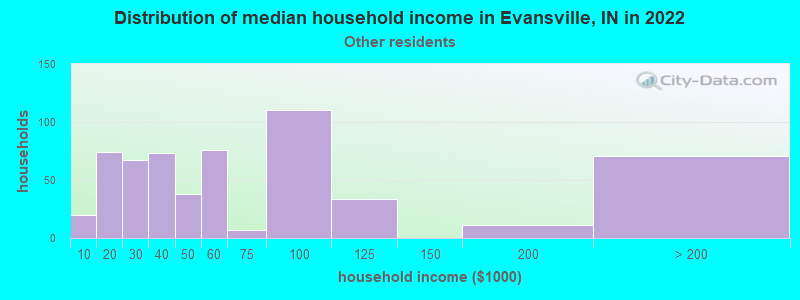
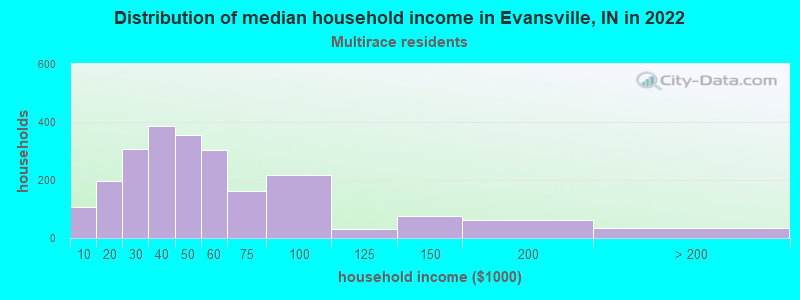
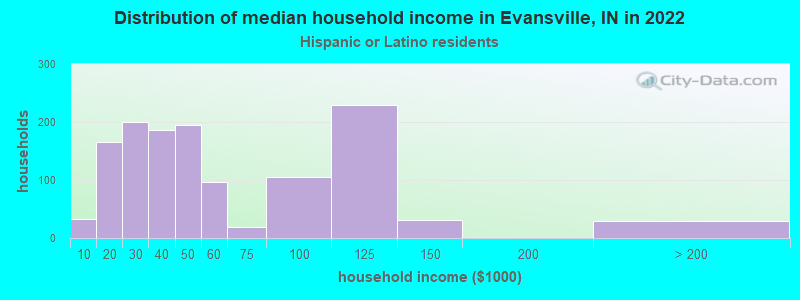
Income and house value in Evansville Median household income in 2022 $53,358 White non-Hispanic householders$32,408 Black householders$67,574 Asian householders$50,708 Some other race householders$29,620 Two or more races householders$33,265 Hispanic or Latino race householdersMedian 2022 house value $131,521 White Non-Hispanic householders$102,646 Black or African American householders$126,491 American Indian or Alaska Native householders $244,600 Asian householders$61,103 Some other race householders$122,393 Two or more races householders$122,393 Hispanic or Latino householders
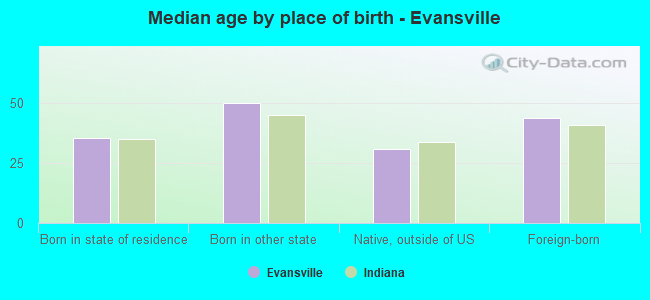
Median age by race in Evansville
41.6 Median age for White residents39.9 42.8 34.5 Median age for Black or African American residents34.4 34.6 -666,666,666.0 Median age for American Indian / Alaska Native residents-666,666,666.0 -666,666,666.0 38.5 Median age for Asian residents24.5 43.5 19.6 Median age for Native Hawaiian / Pacific Islander residents18.8 26.8 31.7 Median age for Other race residents42.8 20.1 22.0 Median age for Two or more races residents19.8 25.6 41.7 Median age for White alone residents39.9 42.9 38.1 Median age for Hispanic or Latino residents35.5 38.2
Owner/renter occupied households by race in Evansville
House owners and renters - White residents 27,023 63.3% Owner occupied15,692 36.7% Renter occupiedHouse owners and renters - Black or African American residents 1,965 24.8% Owner occupied5,949 75.2% Renter occupiedHouse owners and renters - American Indian / Alaska Native residents 24 29.8% Owner occupied56 70.2% Renter occupiedHouse owners and renters - Asian residents 282 50.2% Owner occupied281 49.8% Renter occupiedHouse owners and renters - Native Hawaiian / Pacific Islander residents 17 23.9% Owner occupied56 76.1% Renter occupiedHouse owners and renters - Other race residents 251 39.8% Owner occupied380 60.2% Renter occupiedHouse owners and renters - Two or more races residents 985 43.3% Owner occupied1,291 56.7% Renter occupiedHouse owners and renters - White alone residents 26,945 63.2% Owner occupied15,692 36.8% Renter occupiedHouse owners and renters - Hispanic or Latino residents 896 60.1% Owner occupied594 39.9% Renter occupied
Language usage in Evansville
English speakers - Total 95.2% of residents of Evansville speak English at home.
2.6% of residents speak Spanish at home 2,238 77.0% Speak English very well669 23.0% Speak English less than very well2.2% of residents speak other language at home 1,431 58.4% Speak English very well1,020 41.6% Speak English less than very well
English speakers - Born in the United States 96.4% of residents of Evansville speak English at home.
2.9% of residents speak Spanish at home 868 100.0% Speak English very well0.6% of residents speak other language at home 191 100.0% Speak English very well
English speakers - Native, born elsewhere 67.7% of residents of Evansville speak English at home.
32.3% of residents speak Spanish at home 230 76.9% Speak English very well69 23.1% Speak English less than very well
English speakers - Foreign-born 36.8% of residents of Evansville speak English at home.
19.2% of residents speak Spanish at home 248 33.6% Speak English very well490 66.4% Speak English less than very well44.0% of residents speak other language at home 670 39.6% Speak English very well1,020 60.4% Speak English less than very well
White (Caucasian) - Speak only English Native:
99.1% (84,904)Foreign-born:
31.2% (352)
White (Caucasian) - Speak another language Native:
0.9% (730)Foreign-born:
68.8% (776)
Black or African American - Speak only English Native:
97.4% (13,050)Foreign-born:
18.3% (207)
Black or African American - Speak another language Native:
2.6% (349)Foreign-born:
83.4% (943)
American Indian / Alaska Native - Speak another language Native:
87.2% (135)Foreign-born:
100.0% (57)
Asian - Speak only English Native:
45.2% (91)Foreign-born:
42.9% (403)
Asian - Speak another language Native:
100.0% (201)Foreign-born:
56.4% (530)
Native Hawaiian / Pacific Islander - Speak only English Native:
33.8% (40)Foreign-born:
58.7% (184)
Native Hawaiian / Pacific Islander - Speak another language Native:
67.0% (79)Foreign-born:
39.4% (124)
Other race - Speak only English Native:
55.9% (606)Foreign-born:
46.6% (406)
Other race - Speak another language Native:
44.5% (482)Foreign-born:
60.2% (525)
Two or more races - Speak only English Native:
92.5% (5,661)Foreign-born:
44.7% (166)
Two or more races - Speak another language Native:
5.5% (335)Foreign-born:
57.7% (214)
White alone - Speak only English Native:
99.1% (84,635)Foreign-born:
33.5% (352)
White alone - Speak another language Native:
0.9% (730)Foreign-born:
66.5% (698)
Hispanic or Latino - Speak only English Native:
47.3% (1,317)Foreign-born:
36.4% (422)
Hispanic or Latino - Speak another language Native:
52.7% (1,466)Foreign-born:
63.6% (738)
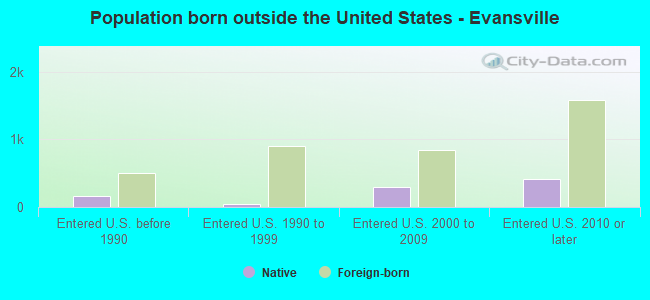
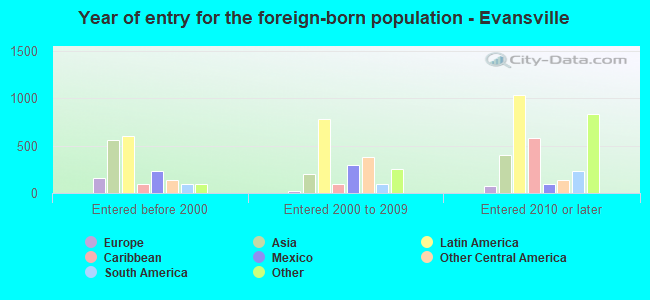
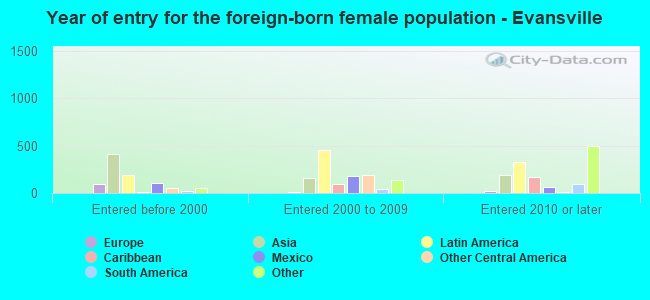
Foreign-born residents in Evansville 4,895 residents are foreign born (1.8% Latin America , 1.1% Asia ).
This city:
4.2%Indiana:
5.6%
Marital status for residents in Evansville Marital status - White (Caucasian) population 15 years and over
Males 35.8% Never married41.9% Now married1.1% Separated4.8% Widowed16.4% DivorcedFemales 28.1% Never married44.5% Now married1.9% Separated9.1% Widowed16.5% DivorcedWomen who gave birth in the past 12 months Now married:
58.0% (668)Unmarried:
42.0% (484)
Women who did not give birth in the past 12 months Now married:
40.1% (7,557)Unmarried:
59.9% (11,302)
Marital status - Black or African American population 15 years and over
Males 51.7% Never married36.6% Now married8.7% Separated0.0% Widowed3.0% DivorcedFemales 66.5% Never married19.0% Now married1.4% Separated5.1% Widowed7.9% DivorcedWomen who gave birth in the past 12 months Now married:
66.3% (122)Unmarried:
33.7% (62)
Women who did not give birth in the past 12 months Now married:
16.9% (632)Unmarried:
83.1% (3,110)
Marital status - American Indian / Alaska Native population 15 years and over
Males 35.1% Never married64.9% Now married0.0% Separated0.0% Widowed0.0% DivorcedFemales 0.0% Never married52.6% Now married0.0% Separated2.6% Widowed44.7% DivorcedWomen who did not give birth in the past 12 months Now married:
73.9% (40)Unmarried:
26.1% (14)
Marital status - Asian population 15 years and over
Males 45.7% Never married38.5% Now married7.3% Separated0.0% Widowed8.5% DivorcedFemales 23.9% Never married59.3% Now married0.0% Separated9.4% Widowed7.4% DivorcedWomen who did not give birth in the past 12 months Now married:
58.2% (283)Unmarried:
41.8% (203)
Marital status - Native Hawaiian / Pacific Islander population 15 years and over
Males 52.6% Never married47.4% Now married0.0% Separated0.0% Widowed0.0% DivorcedFemales 25.2% Never married63.6% Now married0.0% Separated11.2% Widowed0.0% DivorcedWomen who gave birth in the past 12 months Now married:
100.0% (16)Unmarried:
0.0% (0)
Women who did not give birth in the past 12 months Now married:
59.6% (56)Unmarried:
40.4% (38)
Marital status - Other race population 15 years and over
Males 36.1% Never married55.7% Now married3.5% Separated0.0% Widowed4.7% DivorcedFemales 36.1% Never married53.5% Now married2.3% Separated0.0% Widowed8.1% DivorcedWomen who gave birth in the past 12 months Now married:
0.0% (0)Unmarried:
100.0% (25)
Women who did not give birth in the past 12 months Now married:
58.5% (297)Unmarried:
41.5% (211)
Marital status - Two or more races population 15 years and over
Males 61.4% Never married34.0% Now married0.0% Separated1.3% Widowed3.3% DivorcedFemales 46.4% Never married19.2% Now married17.1% Separated3.7% Widowed13.6% DivorcedWomen who gave birth in the past 12 months Now married:
30.8% (5)Unmarried:
69.2% (12)
Women who did not give birth in the past 12 months Now married:
25.7% (434)Unmarried:
74.3% (1,254)
Marital status - White alone, not Hispanic / Latino population 15 years and over
Males 35.8% Never married41.9% Now married1.1% Separated4.8% Widowed16.4% DivorcedFemales 28.1% Never married44.4% Now married1.6% Separated9.2% Widowed16.6% DivorcedWomen who gave birth in the past 12 months Now married:
58.0% (668)Unmarried:
42.0% (484)
Women who did not give birth in the past 12 months Now married:
39.7% (7,382)Unmarried:
60.3% (11,224)
Marital status - Hispanic or Latino population 15 years and over
Males 58.3% Never married38.1% Now married0.0% Separated0.0% Widowed3.7% DivorcedFemales 25.1% Never married30.5% Now married34.5% Separated0.0% Widowed10.0% DivorcedWomen who gave birth in the past 12 months Now married:
58.8% (11)Unmarried:
41.2% (8)
Women who did not give birth in the past 12 months Now married:
49.7% (446)Unmarried:
50.3% (452)
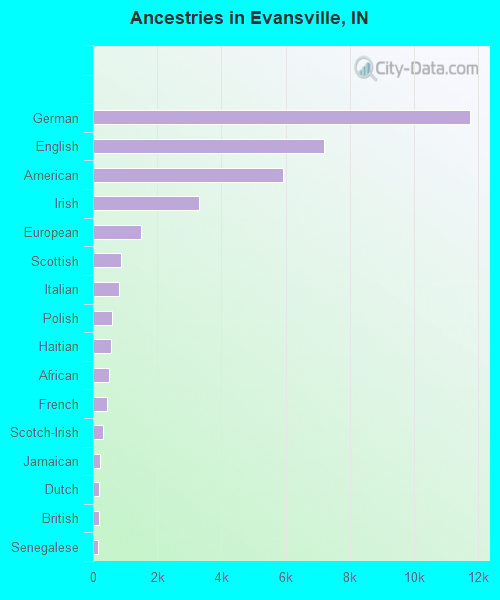
Ancestries in Evansville
11,754 21.4% German7,209 13.1% English5,924 10.8% American3,314 6.0% Irish1,488 2.7% European865 1.6% Scottish816 1.5% Italian600 1.1% Polish567 1.0% Haitian485 0.9% African450 0.8% French314 0.6% Scotch-Irish216 0.4% Jamaican188 0.3% Dutch183 0.3% British149 0.3% Senegalese98 0.2% Eastern European98 0.2% Norwegian98 0.2% Welsh95 0.2% Swedish66 0.1% Russian64 0.1% Ukrainian59 0.1% Scandinavian58 0.1% Syrian52 0.09% French Canadian49 0.09% Nigerian45 0.08% West Indian43 0.08% Greek41 0.07% Arab39 0.07% Israeli38 0.07% Northern European33 0.06% German Russian30 0.05% Kenyan29 0.05% Iranian27 0.05% Canadian25 0.05% Hungarian22 0.04% Austrian17 0.03% Guyanese17 0.03% Serbian15 0.03% Palestinian15 0.03% Swiss14 0.03% Romanian13 0.02% Danish11 0.02% Brazilian10 0.02% Belgian10 0.02% Trinidadian and Tobagonian9 0.02% Czech7 0.01% Czechoslovakian7 0.01% Turkish6 0.01% Pennsylvania German6 0.01% Jordanian5 0.01% Lithuanian4 0.01% Albanian4 0.01% Ghanaian4 0.01% Bahamian3 0.01% Finnish
Geographical mobility in Evansville Same house 1 year ago 76,513 85.0% White (Caucasian)11,863 78.8% Black or African American326 100.0% American Indian / Alaska Native851 72.7% Asian255 54.6% Native Hawaiian / Pacific Islander1,767 86.6% Other race6,051 70.9% Two or more races76,166 85.0% White alone, not Hispanic / Latino3,354 80.1% Hispanic or LatinoMoved within same county 6,987 7.8% White / Caucasian2,409 16.0% Black or African American56 4.8% Asian203 43.5% Native Hawaiian / Pacific Islander199 9.8% Other race1,323 15.5% Two or more races6,987 7.8% White alone, not Hispanic / Latino626 14.9% Hispanic or LatinoMoved within same state 3,907 4.3% White / Caucasian641 4.3% Black or African American140 12.0% Asian41 2.0% Other race1,062 12.4% Two or more races3,907 4.4% White alone, not Hispanic / Latino57 1.4% Hispanic or LatinoMoved from different state 2,599 2.9% White / Caucasian74 0.5% Black or African American106 9.0% Asian30 1.5% Other race91 1.1% Two or more races2,599 2.9% White alone, not Hispanic / Latino134 3.2% Hispanic or LatinoMoved from abroad 65 0.4% Black or African American6 0.5% Asian7 0.1% Two or more races3 0.1% Hispanic or Latino
Children Nativity (place of birth) in Evansville
Children under 6 years - Living with two parents Both parents native 4,100 100.0% NativeBoth parents foreign-born 174 93.3% Native12 6.7% Foreign-bornOne native, one foreign-born parent 405 100.0% NativeChildren under 6 years - Living with one parent Native parent 2,833 100.0% NativeForeign-born parent 24 66.1% Native13 33.9% Foreign-bornChildren 6 to 17 years - Living with two parents Both parents native 6,654 99.4% Native40 0.6% Foreign-bornBoth parents foreign-born 177 59.4% Native121 40.6% Foreign-bornOne native, one foreign-born parent 281 100.0% NativeChildren 6 to 17 years - Living with one parent Native parent 6,927 100.0% NativeForeign-born parent 550 53.7% Native474 46.3% Foreign-born
Grandparents responsible for own grandchildren in Evansville
Grandparents (30 to 59 years) White / Caucasian 438 63.5% Responsible for grandchildren252 36.5% Not responsible for grandchildrenBlack or African American 47 29.4% Responsible for grandchildren112 70.6% Not responsible for grandchildrenNative Hawaiian / Pacific Islander 19 63.5% Responsible for grandchildren11 36.5% Not responsible for grandchildrenOther race 29 100.0% Not responsible for grandchildrenTwo or more races 3 100.0% Responsible for grandchildrenWhite alone, not Hispanic / Latino 438 63.5% Responsible for grandchildren252 36.5% Not responsible for grandchildrenHispanic or Latino 19 100.0% Not responsible for grandchildrenGrandparents (60 years and over) White / Caucasian 33 4.1% Responsible for grandchildren775 95.9% Not responsible for grandchildrenBlack or African American 155 55.3% Responsible for grandchildren126 44.7% Not responsible for grandchildrenNative Hawaiian / Pacific Islander 22 100.0% Not responsible for grandchildrenOther race 10 100.0% Not responsible for grandchildrenTwo or more races 20 40.5% Responsible for grandchildren29 59.5% Not responsible for grandchildrenWhite alone, not Hispanic / Latino 33 4.1% Responsible for grandchildren775 95.9% Not responsible for grandchildrenHispanic or Latino 9 100.0% Not responsible for grandchildren