Races in Excelsior Springs, Missouri (MO) Detailed Stats
Data:
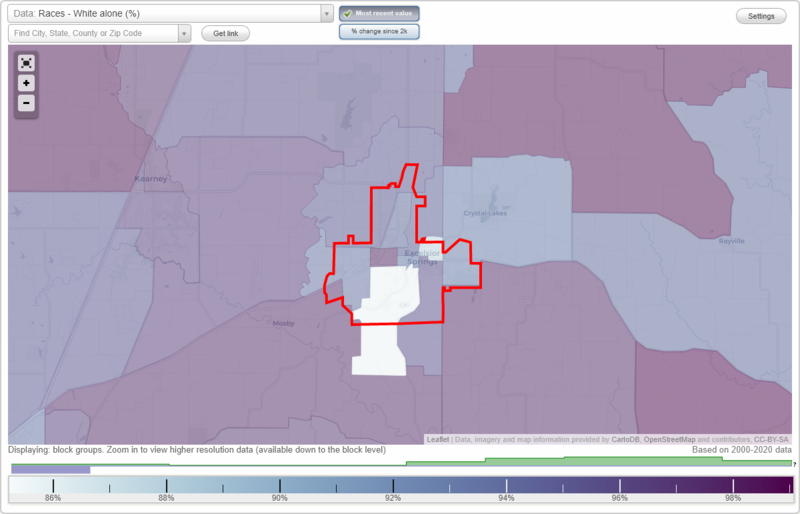
Races - White alone (%)
Races - White alone (% change since 2000)
Races - Black alone (%)
Races - Black alone (% change since 2000)
Races - American Indian alone (%)
Races - American Indian alone (% change since 2000)
Races - Asian alone (%)
Races - Asian alone (% change since 2000)
Races - Hispanic (%)
Races - Hispanic (% change since 2000)
Races - Native Hawaiian and Other Pacific Islander alone (%)
Races - Native Hawaiian and Other Pacific Islander alone (% change since 2000)
Races - Two or more races(%)
Races - Two or more races(% change since 2000)
Races - Other race alone (%)
Races - Other race alone (% change since 2000)
Racial diversity
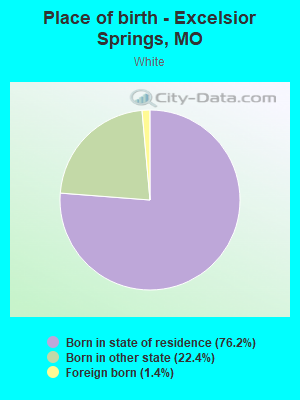
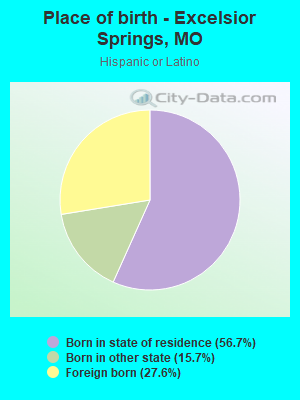
Place of birth - Born in state of residence (%)
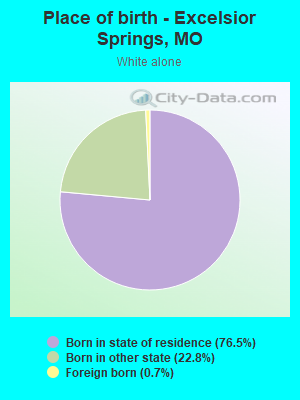
Place of birth - Born in state of residence (%) - White
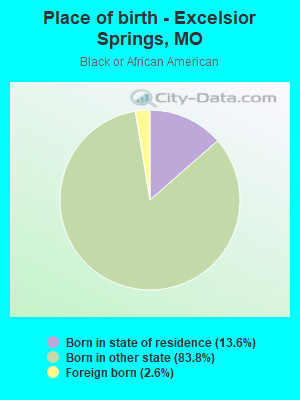
Place of birth - Born in state of residence (%) - Black or African American
Place of birth - Born in state of residence (%) - Asian
Place of birth - Born in state of residence (%) - Hispanic or Latino
Place of birth - Born in state of residence (%) - American Indian and Alaska Native
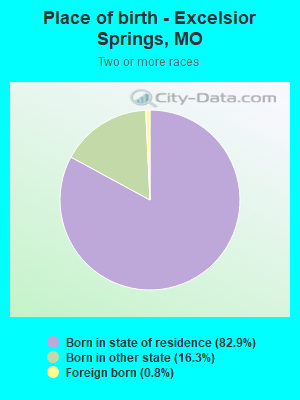
Place of birth - Born in state of residence (%) - Multirace
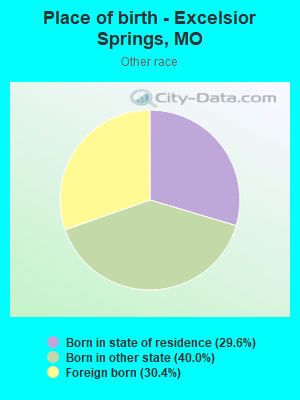
Place of birth - Born in state of residence (%) - Other Race
Place of birth - Born in other state (%)
Place of birth - Born in other state (%) - White
Place of birth - Born in other state (%) - Black or African American
Place of birth - Born in other state (%) - Asian
Place of birth - Born in other state (%) - Hispanic or Latino
Place of birth - Born in other state (%) - American Indian and Alaska Native
Place of birth - Born in other state (%) - Multirace
Place of birth - Born in other state (%) - Other Race
Place of birth - Native, outside of US (%)
Place of birth - Native, outside of US (%) - White
Place of birth - Native, outside of US (%) - Black or African American
Place of birth - Native, outside of US (%) - Asian
Place of birth - Native, outside of US (%) - Hispanic or Latino
Place of birth - Native, outside of US (%) - American Indian and Alaska Native
Place of birth - Native, outside of US (%) - Multirace
Place of birth - Native, outside of US (%) - Other Race
Place of birth - Foreign born (%)
Place of birth - Foreign born (%) - White
Place of birth - Foreign born (%) - Black or African American
Place of birth - Foreign born (%) - Asian
Place of birth - Foreign born (%) - Hispanic or Latino
Place of birth - Foreign born (%) - American Indian and Alaska Native
Place of birth - Foreign born (%) - Multirace
Place of birth - Foreign born (%) - Other Race
Residents speaking English at home (%)
Residents speaking English at home - Born in the United States (%)
Residents speaking English at home - Native, born elsewhere (%)
Residents speaking English at home - Foreign born (%)
Residents speaking Spanish at home (%)
Residents speaking Spanish at home - Born in the United States (%)
Residents speaking Spanish at home - Native, born elsewhere (%)
Residents speaking Spanish at home - Foreign born (%)
Residents speaking other language at home (%)
Residents speaking other language at home - Born in the United States (%)
Residents speaking other language at home - Native, born elsewhere (%)
Residents speaking other language at home - Foreign born (%)
Marital status - Never married (%)
Marital status - Now married (%)
Marital status - Separated (%)
Marital status - Widowed (%)
Marital status - Divorced (%)
Ancestries Reported - Arab (%)
Ancestries Reported - Czech (%)
Ancestries Reported - Danish (%)
Ancestries Reported - Dutch (%)
Ancestries Reported - English (%)
Ancestries Reported - French (%)
Ancestries Reported - French Canadian (%)
Ancestries Reported - German (%)
Ancestries Reported - Greek (%)
Ancestries Reported - Hungarian (%)
Ancestries Reported - Irish (%)
Ancestries Reported - Italian (%)
Ancestries Reported - Lithuanian (%)
Ancestries Reported - Norwegian (%)
Ancestries Reported - Polish (%)
Ancestries Reported - Portuguese (%)
Ancestries Reported - Russian (%)
Ancestries Reported - Scotch-Irish (%)
Ancestries Reported - Scottish (%)
Ancestries Reported - Slovak (%)
Ancestries Reported - Subsaharan African (%)
Ancestries Reported - Swedish (%)
Ancestries Reported - Swiss (%)
Ancestries Reported - Ukrainian (%)
Ancestries Reported - United States (%)
Ancestries Reported - Welsh (%)
Ancestries Reported - West Indian (%)
Ancestries Reported - Other (%)
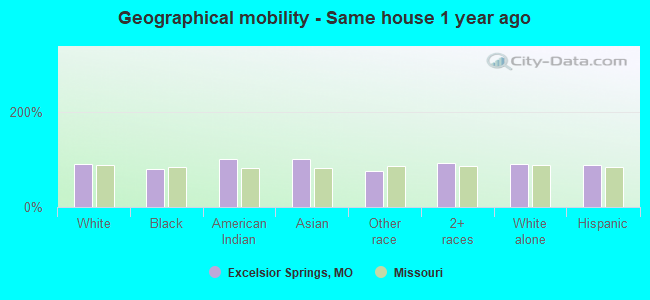
Geographical mobility - Same house 1 year ago (%)
Geographical mobility - Same house 1 year ago (%) - White
Geographical mobility - Same house 1 year ago (%) - Black or African American
Geographical mobility - Same house 1 year ago (%) - Asian
Geographical mobility - Same house 1 year ago (%) - Hispanic or Latino
Geographical mobility - Same house 1 year ago (%) - American Indian and Alaska Native
Geographical mobility - Same house 1 year ago (%) - Multirace
Geographical mobility - Same house 1 year ago (%) - Other Race
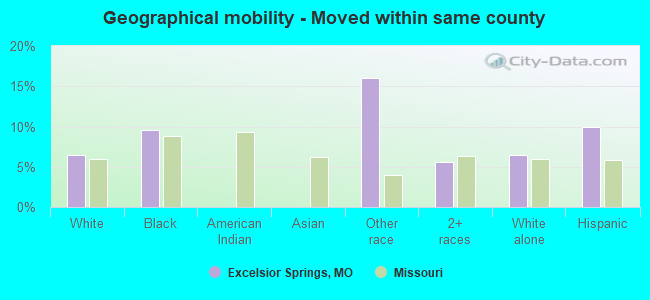
Geographical mobility - Moved within same county (%)
Geographical mobility - Moved within same county (%) - White
Geographical mobility - Moved within same county (%) - Black or African American
Geographical mobility - Moved within same county (%) - Asian
Geographical mobility - Moved within same county (%) - Hispanic or Latino
Geographical mobility - Moved within same county (%) - American Indian and Alaska Native
Geographical mobility - Moved within same county (%) - Multirace
Geographical mobility - Moved within same county (%) - Other Race
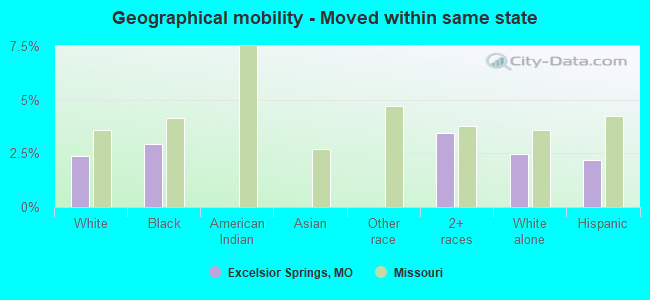
Geographical mobility - Moved from different county within same state (%)
Geographical mobility - Moved from different county within same state (%) - White
Geographical mobility - Moved from different county within same state (%) - Black or African American
Geographical mobility - Moved from different county within same state (%) - Asian
Geographical mobility - Moved from different county within same state (%) - Hispanic or Latino
Geographical mobility - Moved from different county within same state (%) - American Indian and Alaska Native
Geographical mobility - Moved from different county within same state (%) - Multirace
Geographical mobility - Moved from different county within same state (%) - Other Race
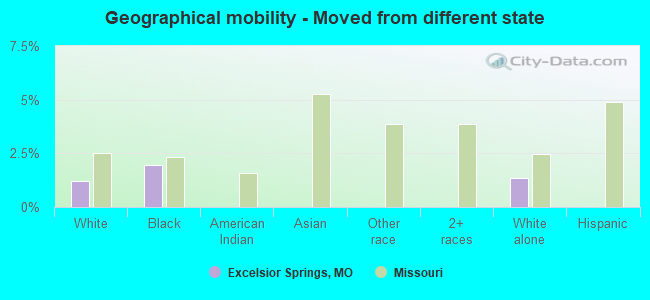
Geographical mobility - Moved from different state (%)
Geographical mobility - Moved from different state (%) - White
Geographical mobility - Moved from different state (%) - Black or African American
Geographical mobility - Moved from different state (%) - Asian
Geographical mobility - Moved from different state (%) - Hispanic or Latino
Geographical mobility - Moved from different state (%) - American Indian and Alaska Native
Geographical mobility - Moved from different state (%) - Multirace
Geographical mobility - Moved from different state (%) - Other Race
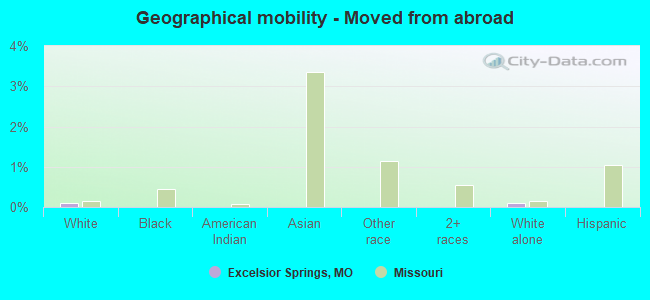
Geographical mobility - Moved from abroad (%)
Geographical mobility - Moved from abroad (%) - White
Geographical mobility - Moved from abroad (%) - Black or African American
Geographical mobility - Moved from abroad (%) - Asian
Geographical mobility - Moved from abroad (%) - Hispanic or Latino
Geographical mobility - Moved from abroad (%) - American Indian and Alaska Native
Geographical mobility - Moved from abroad (%) - Multirace
Geographical mobility - Moved from abroad (%) - Other Race
Place of birth for the foreign-born population - Ireland (%)
Place of birth for the foreign-born population - Denmark (%)
Place of birth for the foreign-born population - Norway (%)
Place of birth for the foreign-born population - Sweden (%)
Place of birth for the foreign-born population - United Kingdom (%)
Place of birth for the foreign-born population - England (%)
Place of birth for the foreign-born population - Scotland (%)
Place of birth for the foreign-born population - Other Northern Europe (%)
Place of birth for the foreign-born population - Austria (%)
Place of birth for the foreign-born population - Belgium (%)
Place of birth for the foreign-born population - France (%)
Place of birth for the foreign-born population - Germany (%)
Place of birth for the foreign-born population - Netherlands (%)
Place of birth for the foreign-born population - Switzerland (%)
Place of birth for the foreign-born population - Other Western Europe (%)
Place of birth for the foreign-born population - Greece (%)
Place of birth for the foreign-born population - Italy (%)
Place of birth for the foreign-born population - Portugal (%)
Place of birth for the foreign-born population - Spain (%)
Place of birth for the foreign-born population - Other Southern Europe (%)
Place of birth for the foreign-born population - Albania (%)
Place of birth for the foreign-born population - Belarus (%)
Place of birth for the foreign-born population - Bosnia and Herzegovina (%)
Place of birth for the foreign-born population - Bulgaria (%)
Place of birth for the foreign-born population - Croatia (%)
Place of birth for the foreign-born population - Czechoslovakia (%)
Place of birth for the foreign-born population - Hungary (%)
Place of birth for the foreign-born population - Latvia (%)
Place of birth for the foreign-born population - Lithuania (%)
Place of birth for the foreign-born population - North Macedonia (Macedonia) (%)
Place of birth for the foreign-born population - Moldova (%)
Place of birth for the foreign-born population - Poland (%)
Place of birth for the foreign-born population - Romania (%)
Place of birth for the foreign-born population - Russia (%)
Place of birth for the foreign-born population - Serbia (%)
Place of birth for the foreign-born population - Ukraine (%)
Place of birth for the foreign-born population - Other Eastern Europe (%)
Place of birth for the foreign-born population - China (%)
Place of birth for the foreign-born population - Hong Kong (%)
Place of birth for the foreign-born population - Taiwan (%)
Place of birth for the foreign-born population - Japan (%)
Place of birth for the foreign-born population - Korea (%)
Place of birth for the foreign-born population - Other Eastern Asia (%)
Place of birth for the foreign-born population - Afghanistan (%)
Place of birth for the foreign-born population - Bangladesh (%)
Place of birth for the foreign-born population - India (%)
Place of birth for the foreign-born population - Iran (%)
Place of birth for the foreign-born population - Kazakhstan (%)
Place of birth for the foreign-born population - Nepal (%)
Place of birth for the foreign-born population - Pakistan (%)
Place of birth for the foreign-born population - Sri Lanka (%)
Place of birth for the foreign-born population - Uzbekistan (%)
Place of birth for the foreign-born population - Other South Central Asia (%)
Place of birth for the foreign-born population - Burma (%)
Place of birth for the foreign-born population - Cambodia (%)
Place of birth for the foreign-born population - Indonesia (%)
Place of birth for the foreign-born population - Laos (%)
Place of birth for the foreign-born population - Malaysia (%)
Place of birth for the foreign-born population - Philippines (%)
Place of birth for the foreign-born population - Singapore (%)
Place of birth for the foreign-born population - Thailand (%)
Place of birth for the foreign-born population - Vietnam (%)
Place of birth for the foreign-born population - Other South Eastern Asia (%)
Place of birth for the foreign-born population - Armenia (%)
Place of birth for the foreign-born population - Iraq (%)
Place of birth for the foreign-born population - Israel (%)
Place of birth for the foreign-born population - Jordan (%)
Place of birth for the foreign-born population - Kuwait (%)
Place of birth for the foreign-born population - Lebanon (%)
Place of birth for the foreign-born population - Saudi Arabia (%)
Place of birth for the foreign-born population - Syria (%)
Place of birth for the foreign-born population - Turkey (%)
Place of birth for the foreign-born population - Yemen (%)
Place of birth for the foreign-born population - Other Western Asia (%)
Place of birth for the foreign-born population - Eritrea (%)
Place of birth for the foreign-born population - Ethiopia (%)
Place of birth for the foreign-born population - Kenya (%)
Place of birth for the foreign-born population - Somalia (%)
Place of birth for the foreign-born population - Uganda (%)
Place of birth for the foreign-born population - Zimbabwe (%)
Place of birth for the foreign-born population - Other Eastern Africa (%)
Place of birth for the foreign-born population - Cameroon (%)
Place of birth for the foreign-born population - Congo (%)
Place of birth for the foreign-born population - Democratic Republic of Congo (Zaire) (%)
Place of birth for the foreign-born population - Other Middle Africa (%)
Place of birth for the foreign-born population - Egypt (%)
Place of birth for the foreign-born population - Morocco (%)
Place of birth for the foreign-born population - Sudan (%)
Place of birth for the foreign-born population - Other Northern Africa (%)
Place of birth for the foreign-born population - South Africa (%)
Place of birth for the foreign-born population - Other Southern Africa (%)
Place of birth for the foreign-born population - Cabo Verde (%)
Place of birth for the foreign-born population - Ghana (%)
Place of birth for the foreign-born population - Liberia (%)
Place of birth for the foreign-born population - Nigeria (%)
Place of birth for the foreign-born population - Senegal (%)
Place of birth for the foreign-born population - Sierra Leone (%)
Place of birth for the foreign-born population - Other Western Africa (%)
Place of birth for the foreign-born population - Australia (%)
Place of birth for the foreign-born population - New Zealand (%)
Place of birth for the foreign-born population - Fiji (%)
Place of birth for the foreign-born population - Micronesia (%)
Place of birth for the foreign-born population - Bahamas (%)
Place of birth for the foreign-born population - Barbados (%)
Place of birth for the foreign-born population - Cuba (%)
Place of birth for the foreign-born population - Dominica (%)
Place of birth for the foreign-born population - Dominican Republic (%)
Place of birth for the foreign-born population - Grenada (%)
Place of birth for the foreign-born population - Haiti (%)
Place of birth for the foreign-born population - Jamaica (%)
Place of birth for the foreign-born population - St. Vincent and the Grenadines (%)
Place of birth for the foreign-born population - Trinidad and Tobago (%)
Place of birth for the foreign-born population - West Indies (%)
Place of birth for the foreign-born population - Other Caribbean (%)
Place of birth for the foreign-born population - Belize (%)
Place of birth for the foreign-born population - Costa Rica (%)
Place of birth for the foreign-born population - El Salvador (%)
Place of birth for the foreign-born population - Guatemala (%)
Place of birth for the foreign-born population - Honduras (%)
Place of birth for the foreign-born population - Mexico (%)
Place of birth for the foreign-born population - Nicaragua (%)
Place of birth for the foreign-born population - Panama (%)
Place of birth for the foreign-born population - Other Central America (%)
Place of birth for the foreign-born population - Argentina (%)
Place of birth for the foreign-born population - Bolivia (%)
Place of birth for the foreign-born population - Brazil (%)
Place of birth for the foreign-born population - Chile (%)
Place of birth for the foreign-born population - Colombia (%)
Place of birth for the foreign-born population - Ecuador (%)
Place of birth for the foreign-born population - Guyana (%)
Place of birth for the foreign-born population - Peru (%)
Place of birth for the foreign-born population - Uruguay (%)
Place of birth for the foreign-born population - Venezuela (%)
Place of birth for the foreign-born population - Other South America (%)
Place of birth for the foreign-born population - Canada (%)
Place of birth for the foreign-born population - Other Northern America (%)
Place of birth for the foreign-born population - Other (%)
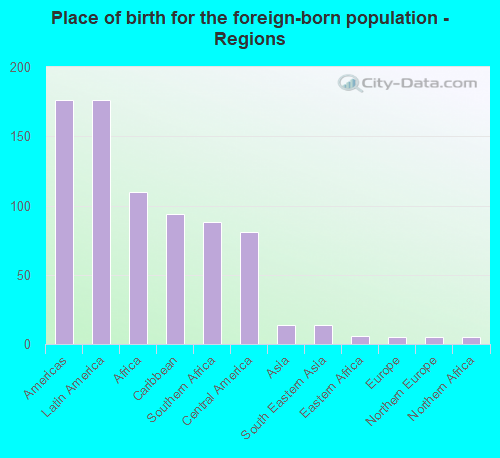
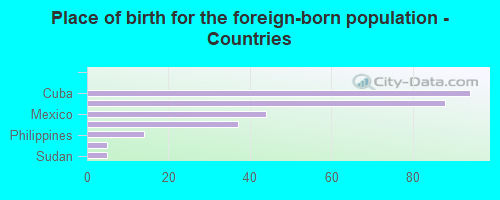
According to 2022 data, the most numerous races in Excelsior Springs, MO are White alone (8,878 residents), Black alone (619 residents), and Two or more races (406 residents). 94.5% of Excelsior Springs residents speak English at home. 2.9% of Excelsior Springs, MO residents are foreign-born (1.7% born in Latin America, 1.1% born in Africa), which is 39.6% less than the foreign-born rate of 4.0% across the entire state of Missouri.
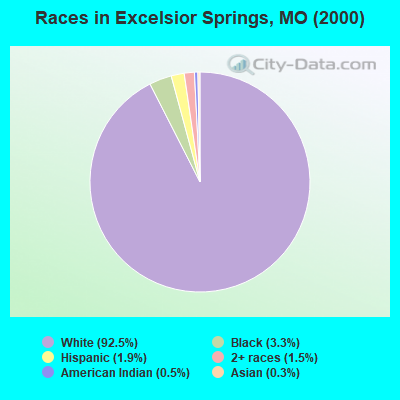
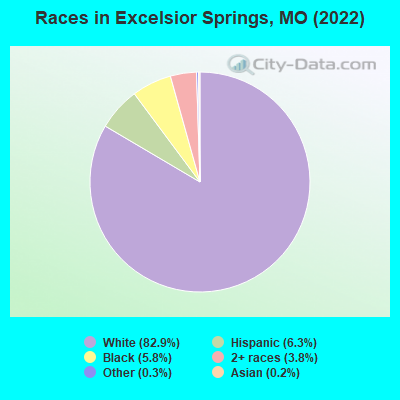
Race distribution in Excelsior Springs
2000 2022
4,686,474 83.8% White alone 625,667 11.2% Black alone 118,592 2.1% Hispanic 71,905 1.3% Two or more races 61,041 1.1% Asian alone 23,302 0.4% American Indian alone 5,291 0.09% Other race alone 2,939 0.05% Native Hawaiian and Other
4,733,411 76.6% White alone 656,739 10.6% Black alone 316,300 5.1% Two or more races 291,763 4.7% Hispanic 132,436 2.1% Asian alone 27,467 0.4% Other race alone 12,313 0.2% American Indian alone 7,528 0.1% Native Hawaiian and Other
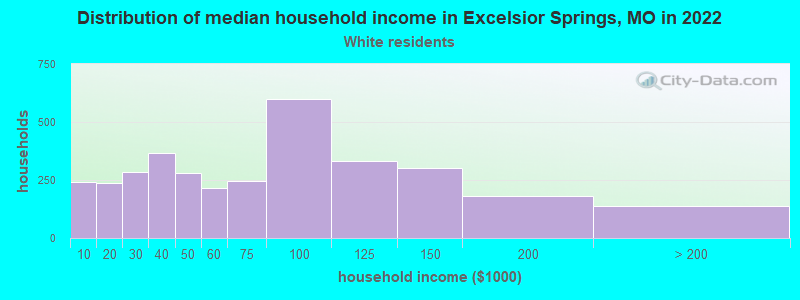
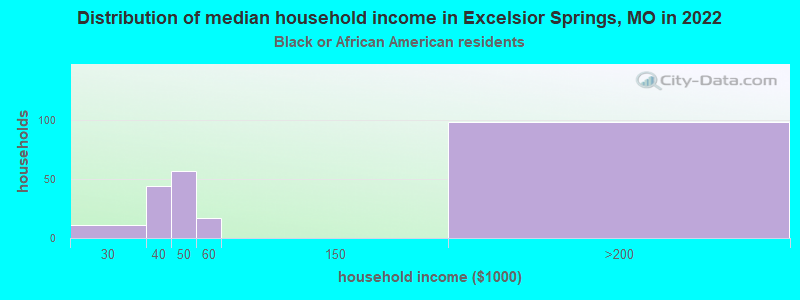
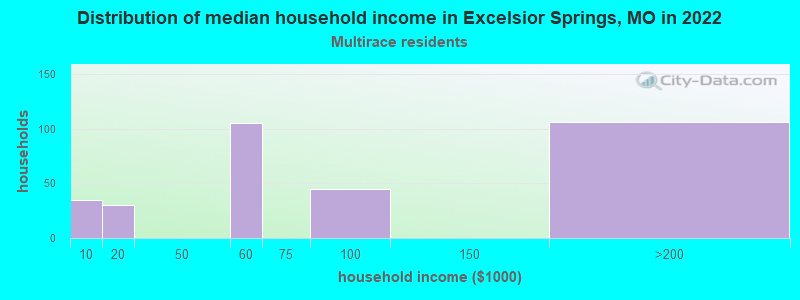
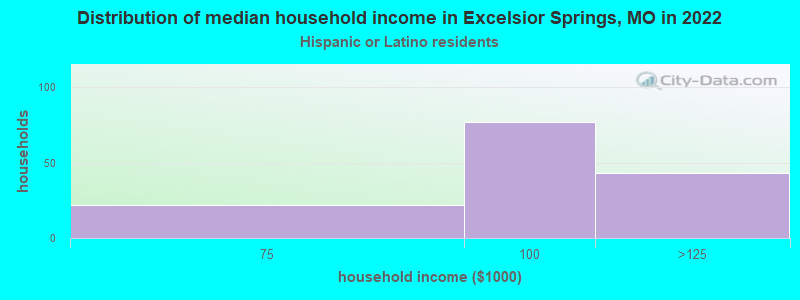
Income and house value in Excelsior Springs Median household income in 2022 $67,010 White non-Hispanic householders$69,236 Two or more races householders$76,916 Hispanic or Latino race householdersMedian 2022 house value $188,105 White Non-Hispanic householders$126,159 Black or African American householders$192,870 American Indian or Alaska Native householders$213,972 Two or more races householders$197,181 Hispanic or Latino householders
Median age by race in Excelsior Springs
36.7 Median age for White residents34.7 38.9 37.3 Median age for Black or African American residents35.9 38.7 -536,470,587.7 Median age for American Indian / Alaska Native residents-560,115,190.2 -452,173,912.6 -649,275,361.7 Median age for Asian residents-696,109,357.9 -600,694,443.8 -693,430,656.2 Median age for Native Hawaiian / Pacific Islander residents-683,513,838.1 -752,136,751.4 29.0 Median age for Other race residents28.3 28.9 34.3 Median age for Two or more races residents36.8 10.1 37.9 Median age for White alone residents36.3 38.6 22.9 Median age for Hispanic or Latino residents22.8 29.9
Owner/renter occupied households by race in Excelsior Springs
House owners and renters - White residents 2,222 66.0% Owner occupied1,145 34.0% Renter occupiedHouse owners and renters - Black or African American residents 72 28.9% Owner occupied178 71.1% Renter occupiedHouse owners and renters - Other race residents 69 100.0% Owner occupiedHouse owners and renters - Two or more races residents 154 61.6% Owner occupied96 38.4% Renter occupiedHouse owners and renters - White alone residents 2,168 65.8% Owner occupied1,128 34.2% Renter occupiedHouse owners and renters - Hispanic or Latino residents 125 89.2% Owner occupied15 10.8% Renter occupied
Language usage in Excelsior Springs
English speakers - Total 94.5% of residents of Excelsior Springs speak English at home.
4.6% of residents speak Spanish at home 311 66.2% Speak English very well159 33.8% Speak English less than very well1.1% of residents speak other language at home 101 93.5% Speak English very well7 6.5% Speak English less than very well
English speakers - Born in the United States 95.0% of residents of Excelsior Springs speak English at home.
4.6% of residents speak Spanish at home 123 95.3% Speak English very well6 4.7% Speak English less than very well0.6% of residents speak other language at home 17 100.0% Speak English very well
English speakers - Foreign-born 18.5% of residents of Excelsior Springs speak English at home.
65.6% of residents speak Spanish at home 57 31.5% Speak English very well124 68.5% Speak English less than very well11.6% of residents speak other language at home 25 78.1% Speak English very well7 21.9% Speak English less than very well
White (Caucasian) - Speak only English Native:
97.3% (8,411)Foreign-born:
36.0% (48)
White (Caucasian) - Speak another language Native:
2.4% (208)Foreign-born:
61.7% (82)
Black or African American - Speak another language Native:
3.0% (18)Foreign-born:
89.4% (16)
Other race - Speak another language Native:
38.0% (50)Foreign-born:
98.4% (53)
Two or more races - Speak only English Native:
89.1% (473)Foreign-born:
95.7% (4)
White alone - Speak only English Native:
98.6% (8,310)Foreign-born:
74.2% (51)
Hispanic or Latino - Speak only English Native:
60.0% (299)Foreign-born:
1.0% (2)
Hispanic or Latino - Speak another language Native:
41.4% (206)Foreign-born:
100.0% (179)
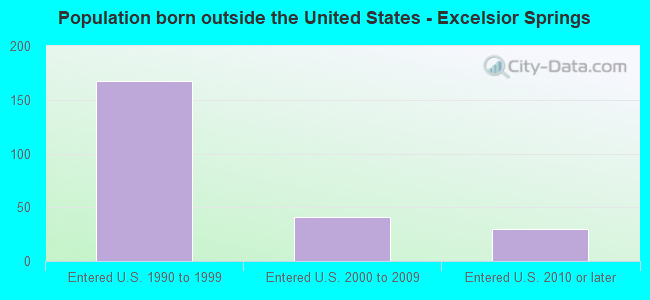
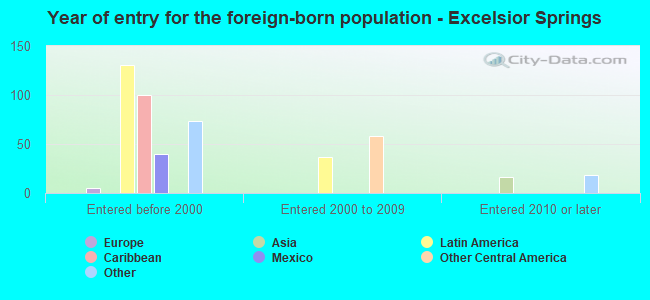
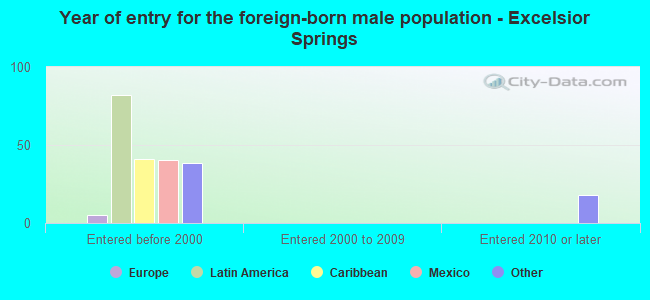
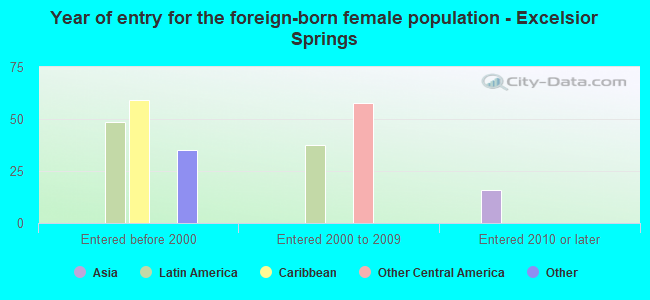
Foreign-born residents in Excelsior Springs 307 residents are foreign born (1.7% Latin America , 1.1% Africa ).
This city:
2.9%Missouri:
4.2%
Marital status for residents in Excelsior Springs Marital status - White (Caucasian) population 15 years and over
Males 38.7% Never married50.2% Now married2.8% Separated2.6% Widowed5.6% DivorcedFemales 21.0% Never married49.2% Now married1.6% Separated11.1% Widowed17.1% DivorcedWomen who gave birth in the past 12 months Now married:
88.9% (40)Unmarried:
11.1% (5)
Women who did not give birth in the past 12 months Now married:
51.9% (1,031)Unmarried:
48.1% (956)
Marital status - Black or African American population 15 years and over
Males 53.7% Never married42.9% Now married0.0% Separated0.0% Widowed3.5% DivorcedFemales 79.8% Never married14.6% Now married0.0% Separated5.6% Widowed0.0% DivorcedWomen who did not give birth in the past 12 months Now married:
0.0% (0)Unmarried:
100.0% (281)
Marital status - Other race population 15 years and over
Males 84.6% Never married15.4% Now married0.0% Separated0.0% Widowed0.0% DivorcedFemales 81.2% Never married15.0% Now married0.0% Separated3.8% Widowed0.0% DivorcedWomen who did not give birth in the past 12 months Now married:
15.6% (15)Unmarried:
84.4% (79)
Marital status - Two or more races population 15 years and over
Males 46.2% Never married50.8% Now married0.0% Separated0.0% Widowed3.0% DivorcedFemales 17.9% Never married82.1% Now married0.0% Separated0.0% Widowed0.0% DivorcedWomen who did not give birth in the past 12 months Now married:
77.8% (77)Unmarried:
22.2% (22)
Marital status - White alone, not Hispanic / Latino population 15 years and over
Males 35.7% Never married52.3% Now married3.0% Separated2.9% Widowed6.1% DivorcedFemales 21.4% Never married48.1% Now married1.6% Separated11.3% Widowed17.5% DivorcedWomen who gave birth in the past 12 months Now married:
88.9% (40)Unmarried:
11.1% (5)
Women who did not give birth in the past 12 months Now married:
49.9% (957)Unmarried:
50.1% (960)
Marital status - Hispanic or Latino population 15 years and over
Males 75.5% Never married24.5% Now married0.0% Separated0.0% Widowed0.0% DivorcedFemales 28.8% Never married68.9% Now married0.0% Separated2.3% Widowed0.0% DivorcedWomen who did not give birth in the past 12 months Now married:
70.5% (100)Unmarried:
29.5% (42)
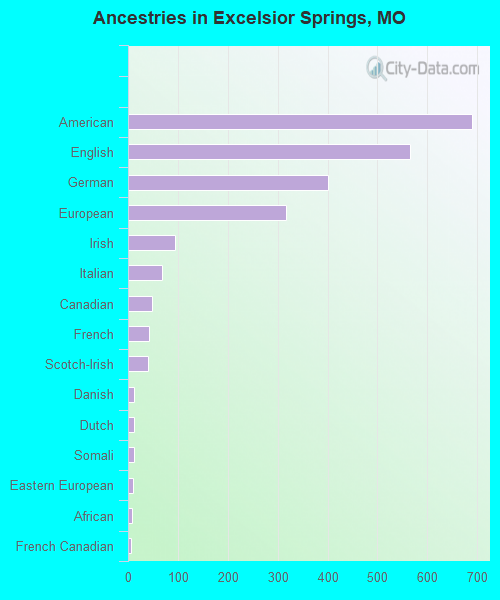
Ancestries in Excelsior Springs
689 20.4% American565 16.7% English400 11.8% German316 9.3% European94 2.8% Irish69 2.0% Italian49 1.4% Canadian43 1.3% French40 1.2% Scotch-Irish13 0.4% Danish12 0.4% Dutch12 0.4% Somali11 0.3% Eastern European9 0.3% African7 0.2% French Canadian
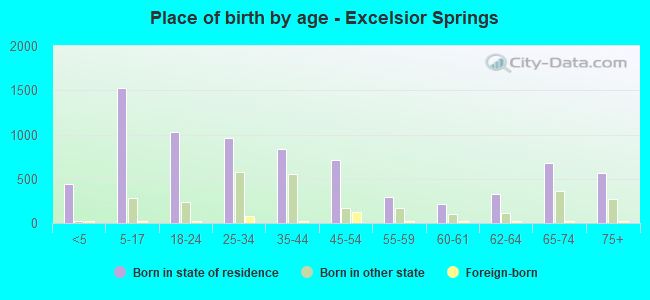
Children Nativity (place of birth) in Excelsior Springs
Children under 6 years - Living with two parents Both parents native 461 100.0% NativeChildren under 6 years - Living with one parent Native parent 90 100.0% Native
Children 6 to 17 years - Living with two parents Both parents native 1,164 100.0% NativeOne native, one foreign-born parent 3 100.0% NativeChildren 6 to 17 years - Living with one parent Native parent 413 100.0% Native
Grandparents responsible for own grandchildren in Excelsior Springs
Grandparents (30 to 59 years) White / Caucasian 62 100.0% Responsible for grandchildrenWhite alone, not Hispanic / Latino 62 100.0% Responsible for grandchildrenGrandparents (60 years and over) White / Caucasian 47 49.6% Responsible for grandchildren48 50.4% Not responsible for grandchildrenWhite alone, not Hispanic / Latino 49 48.9% Responsible for grandchildren51 51.1% Not responsible for grandchildren